. 2020 Oct;586(7830):606-611.
doi: 10.1038/s41586-020-2631-z. Epub 2020 Aug 19.

Immune-evasive human islet-like organoids ameliorate diabetes

Affiliations

Immune-evasive human islet-like organoids ameliorate diabetes

Eiji Yoshihara et al. Nature. 2020 Oct.

Erratum in

Abstract

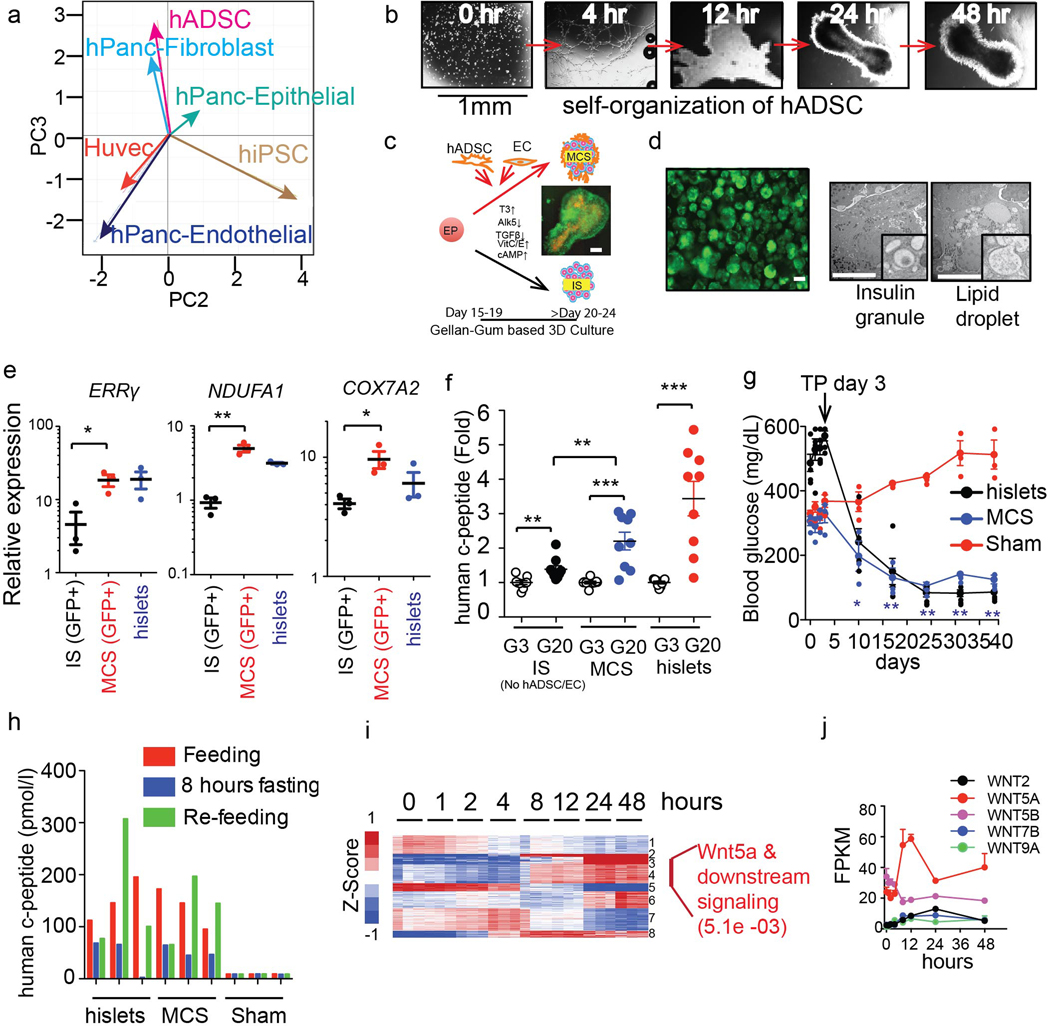
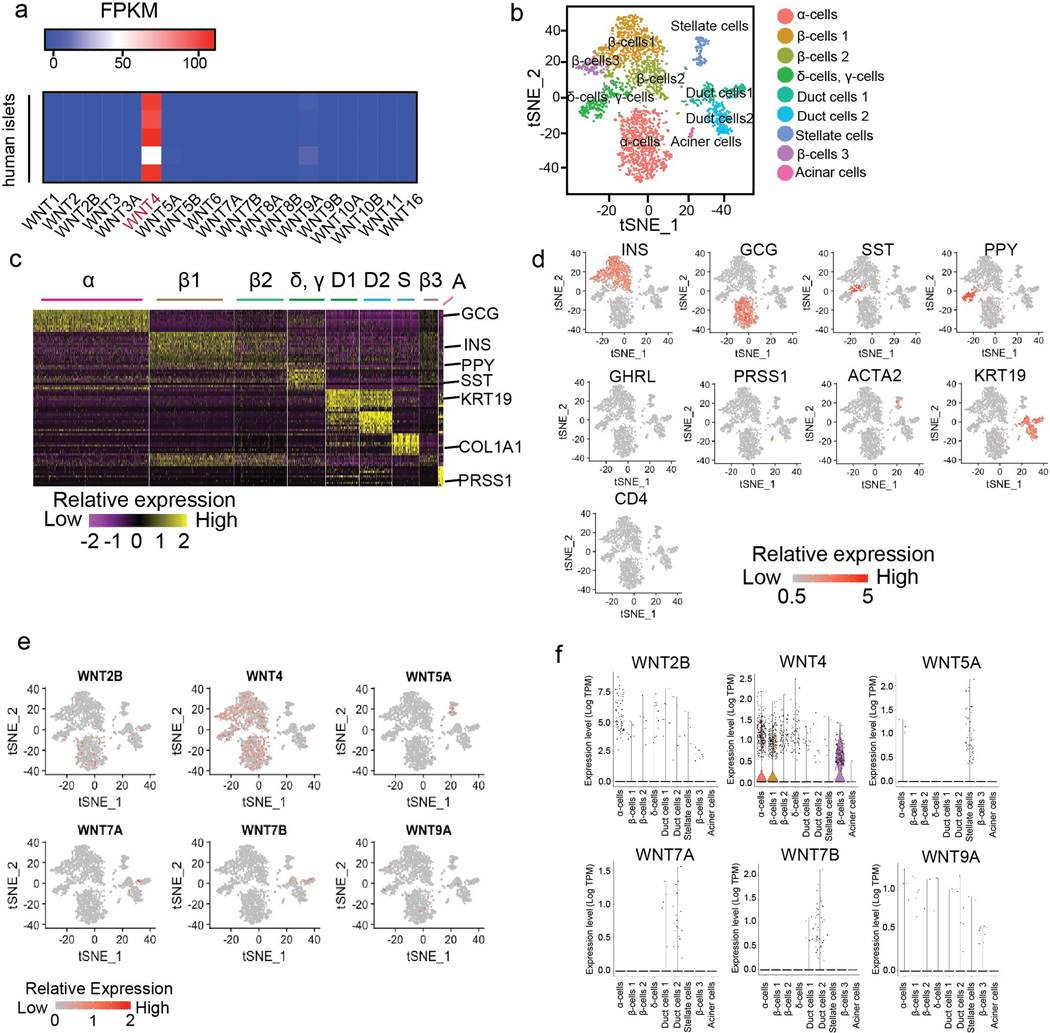
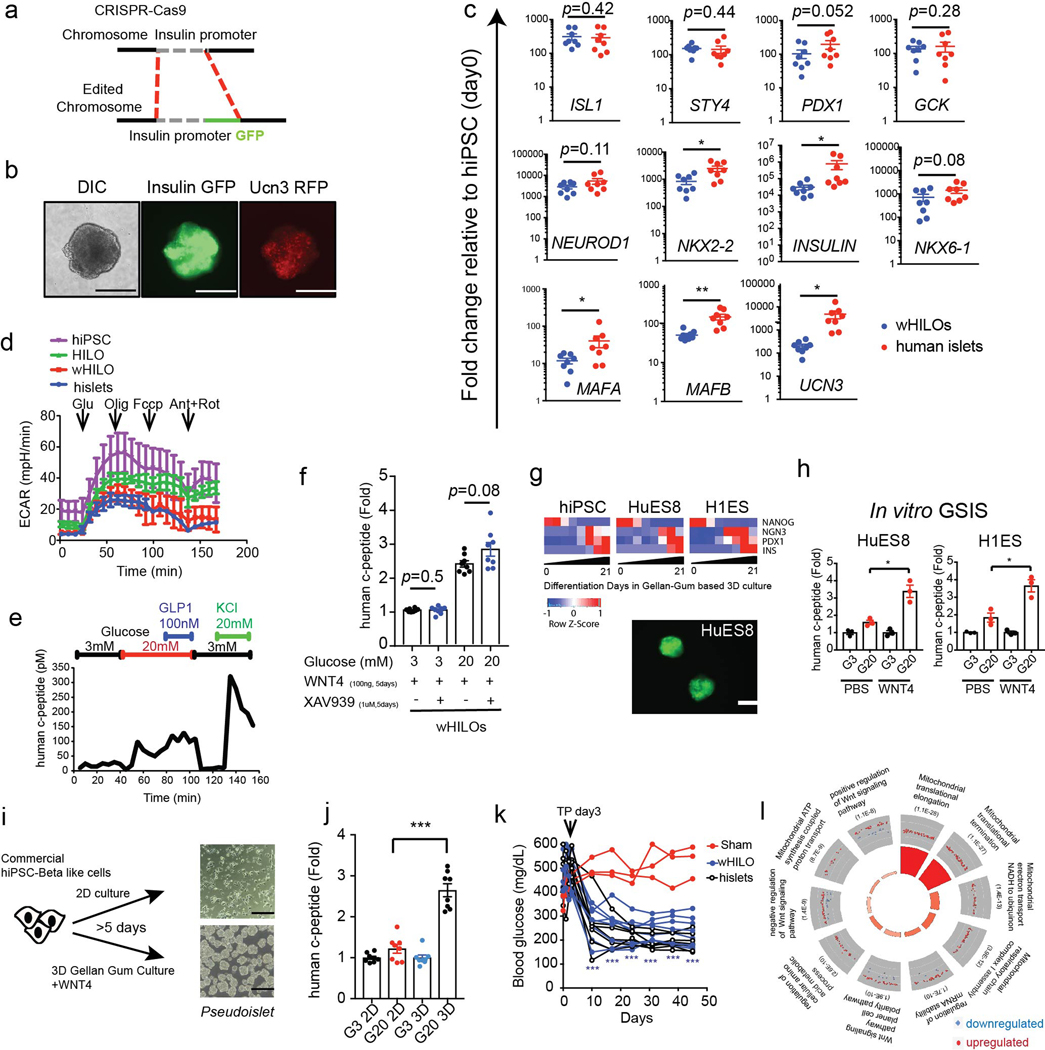
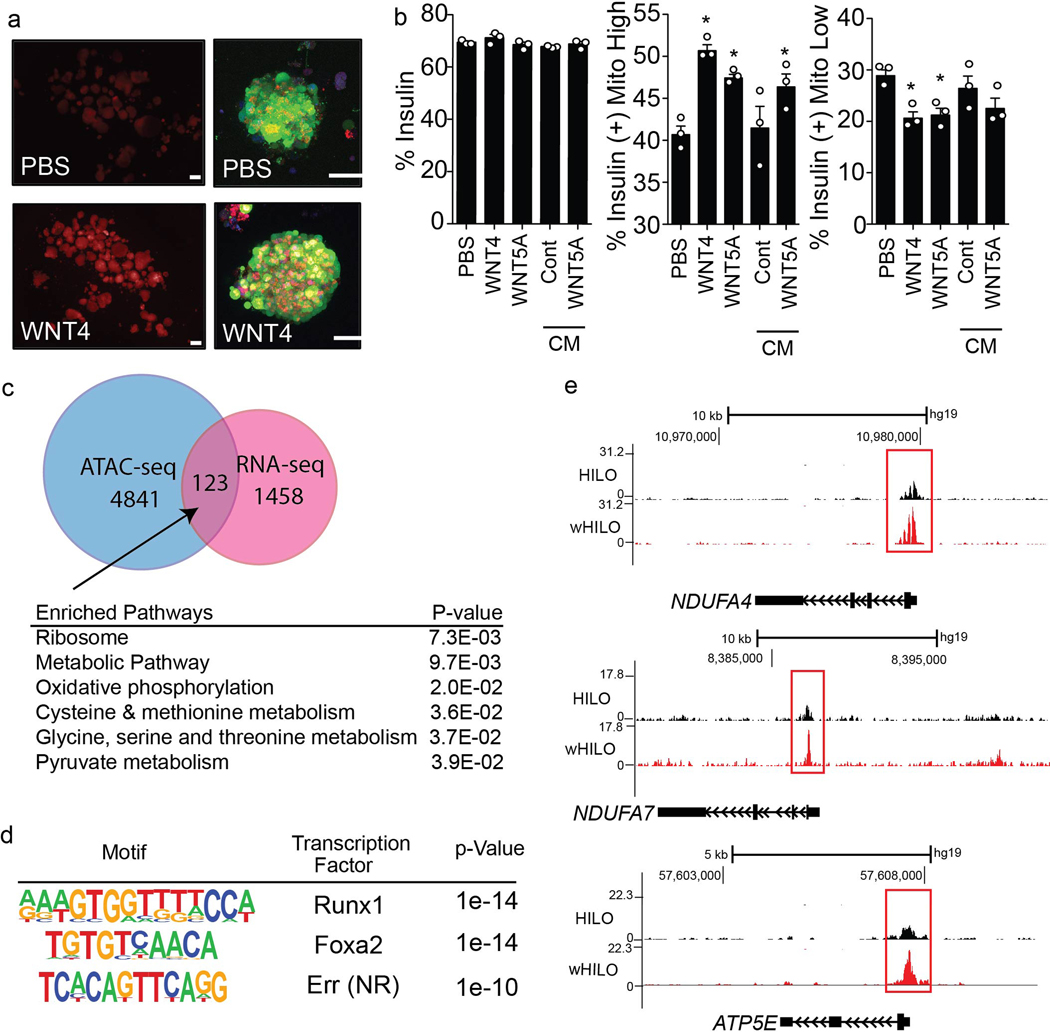
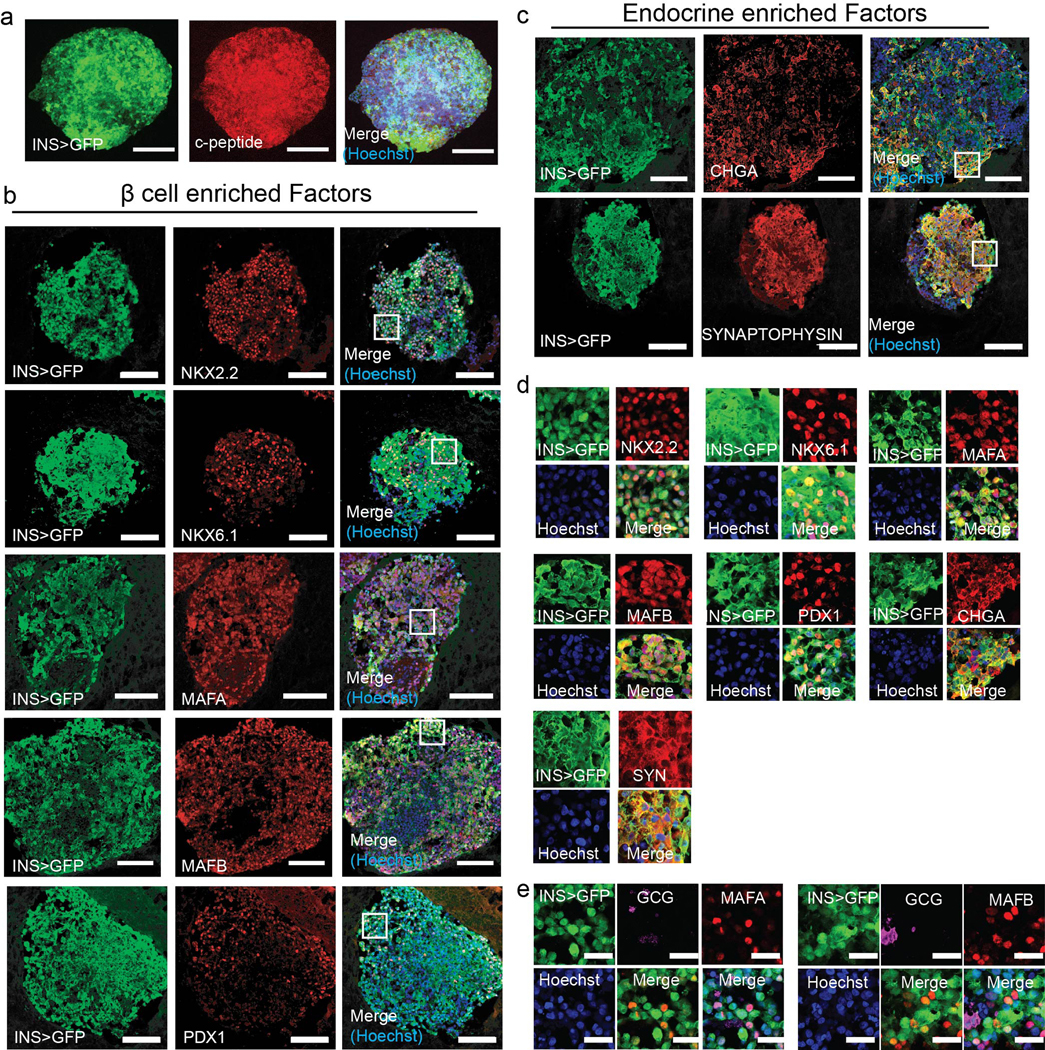
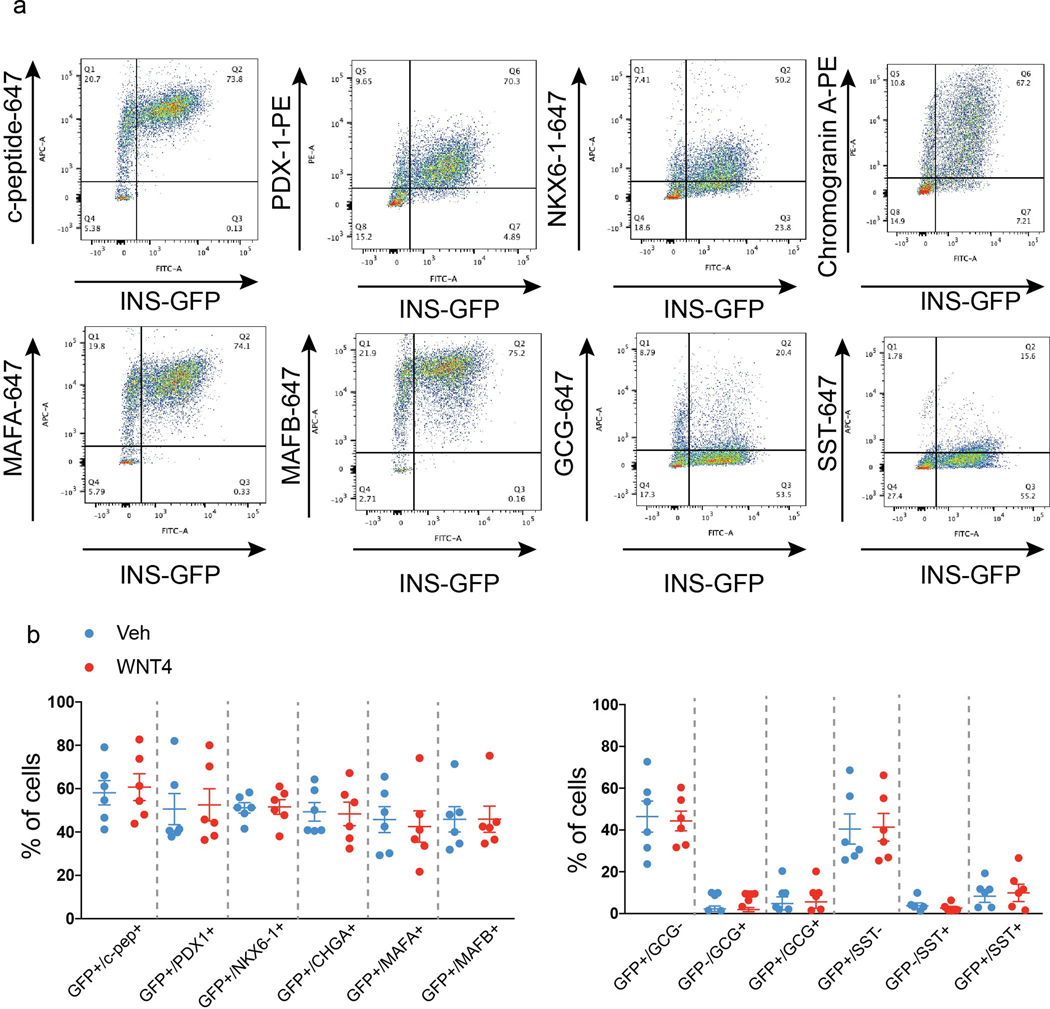
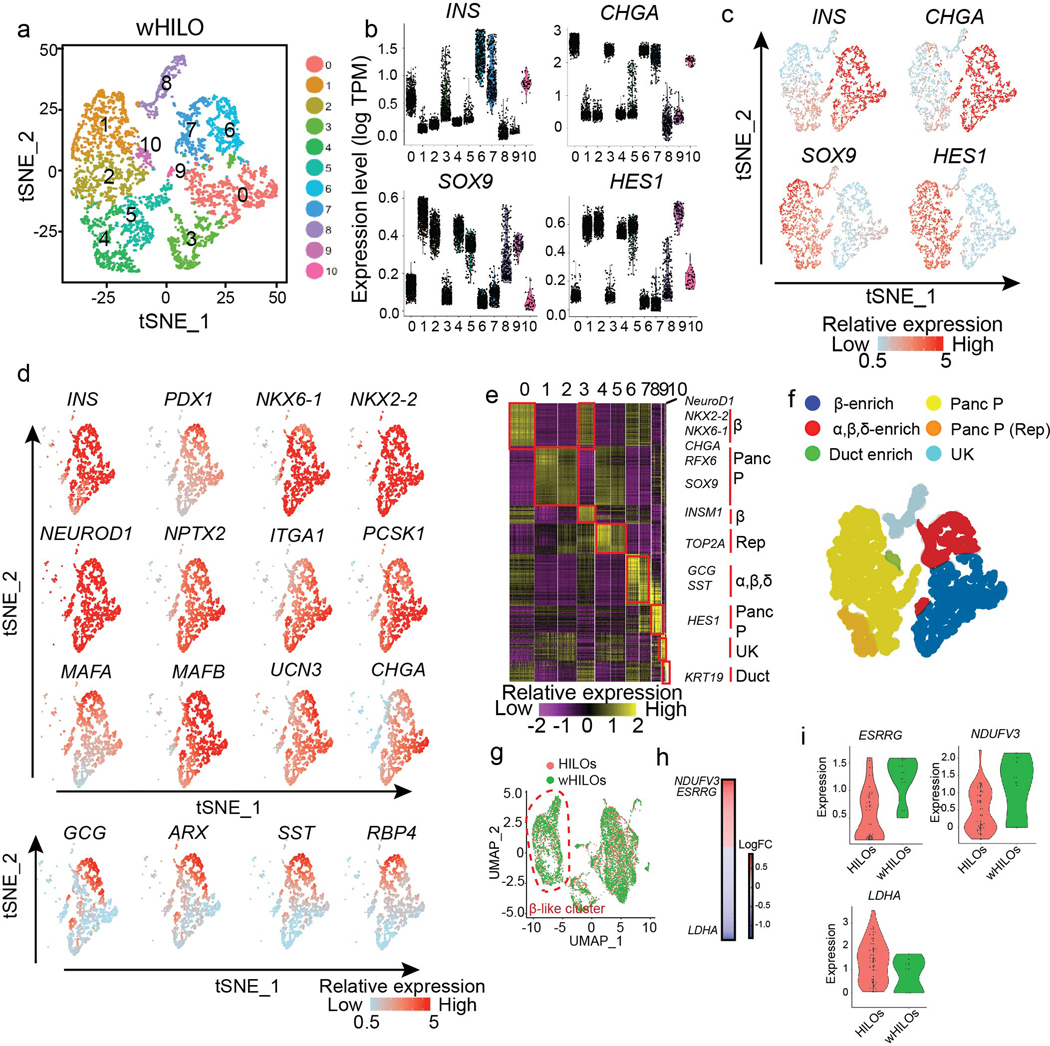
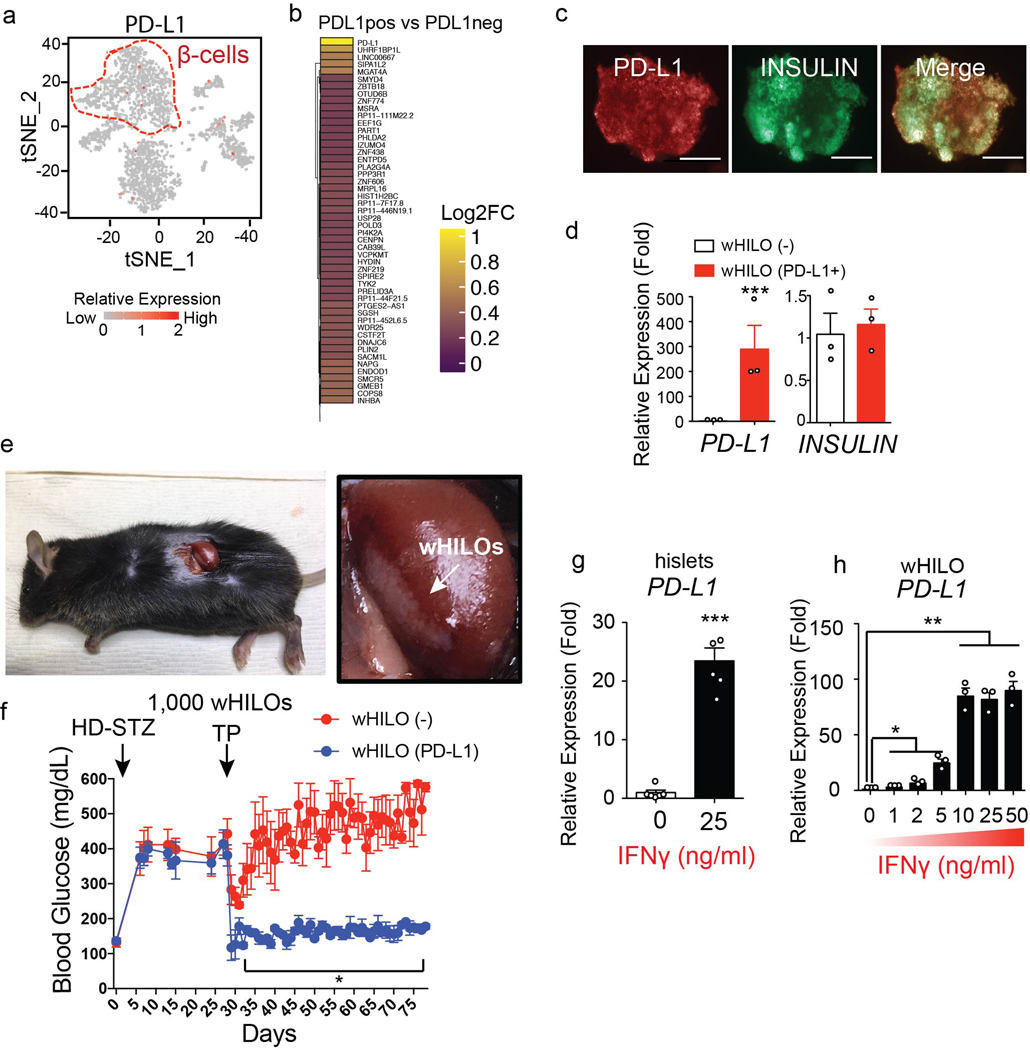
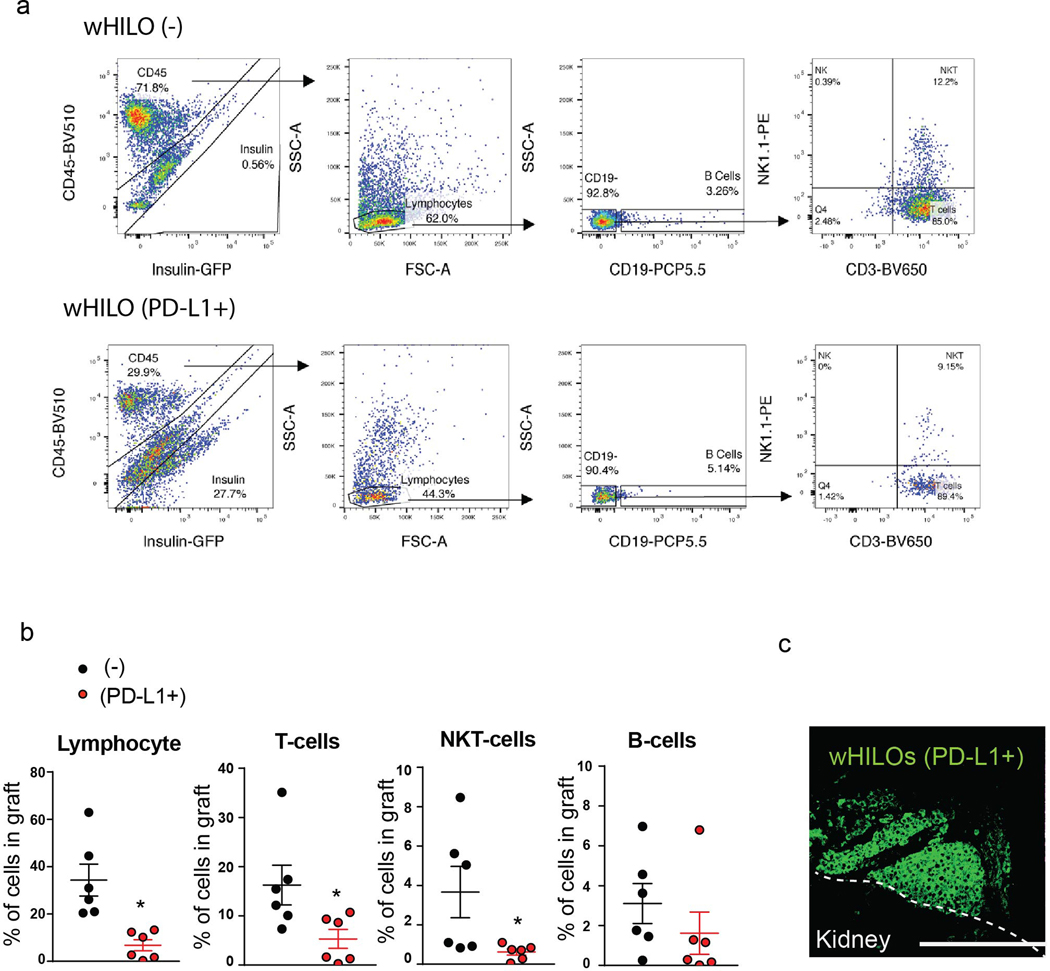
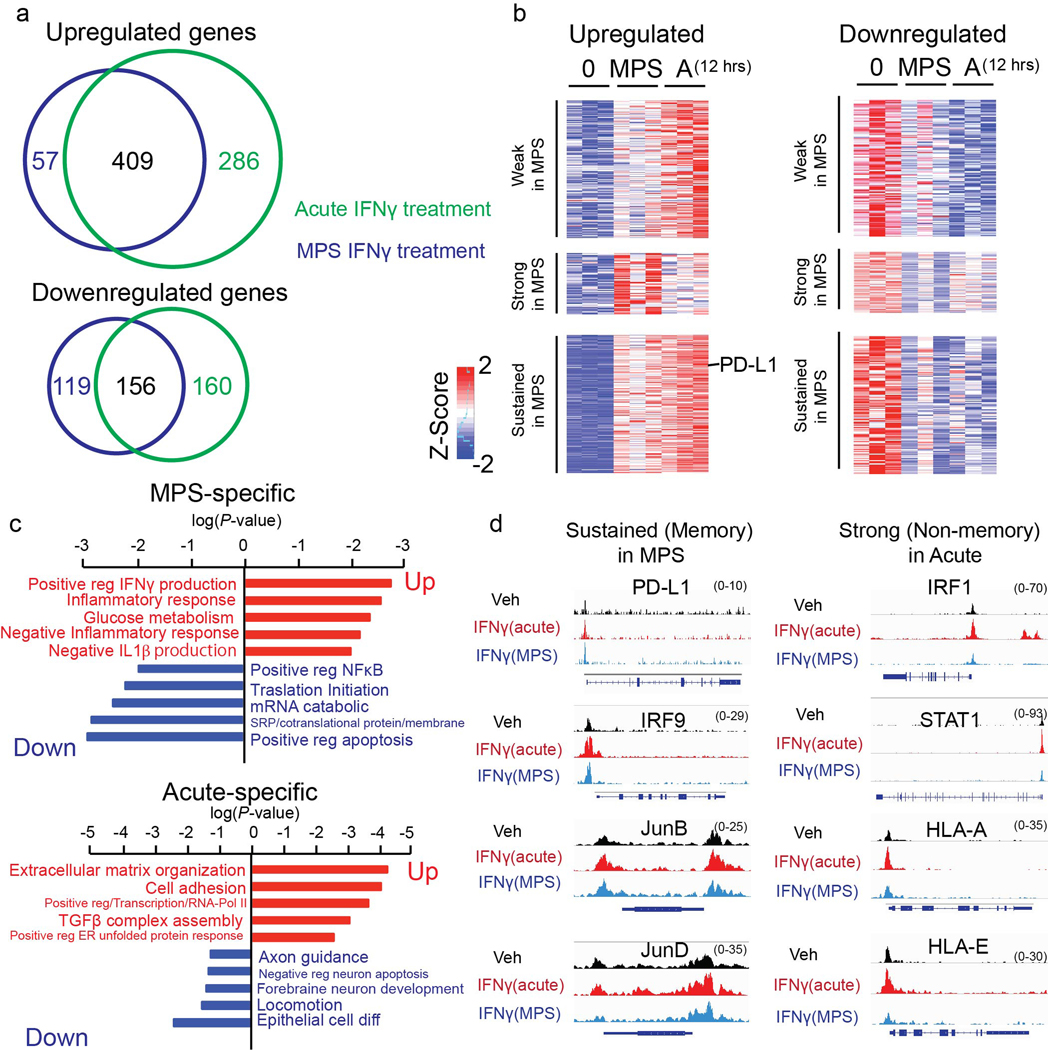
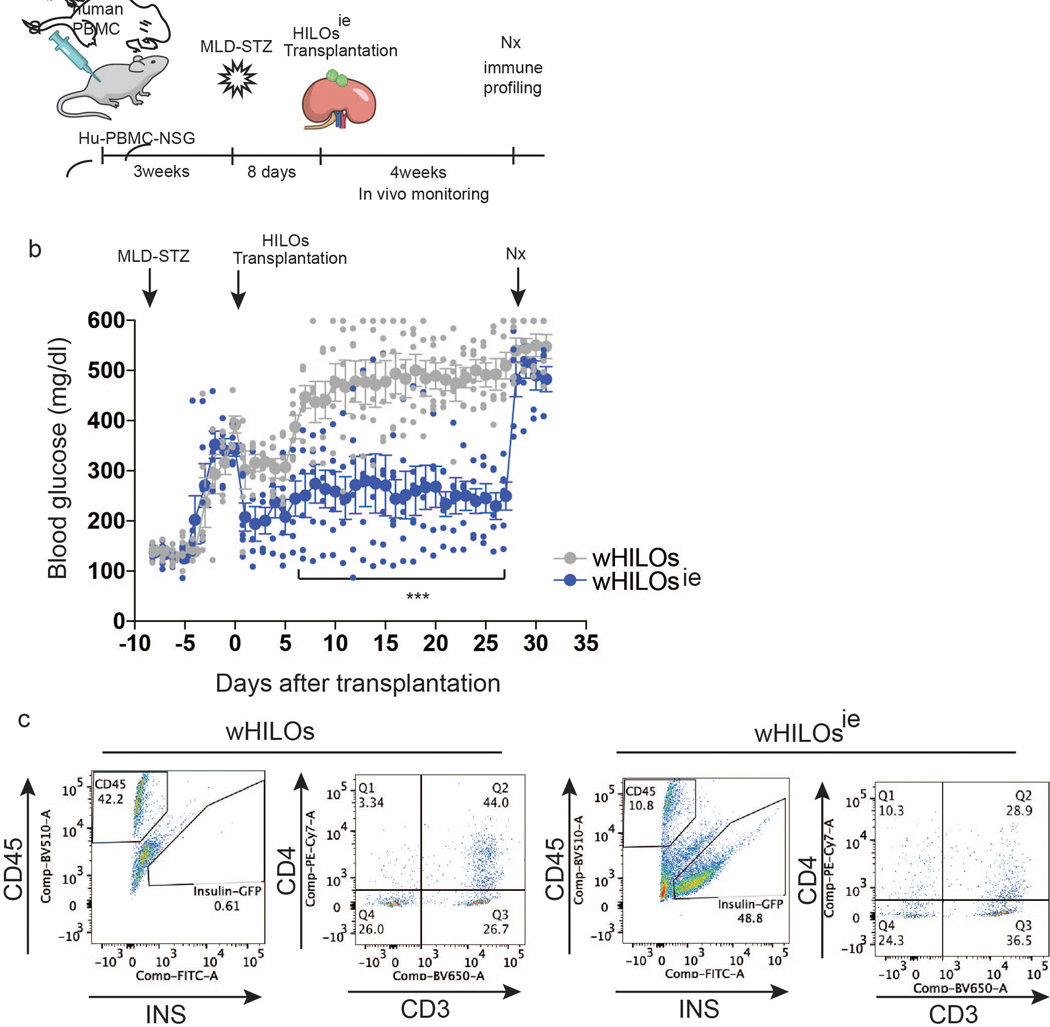
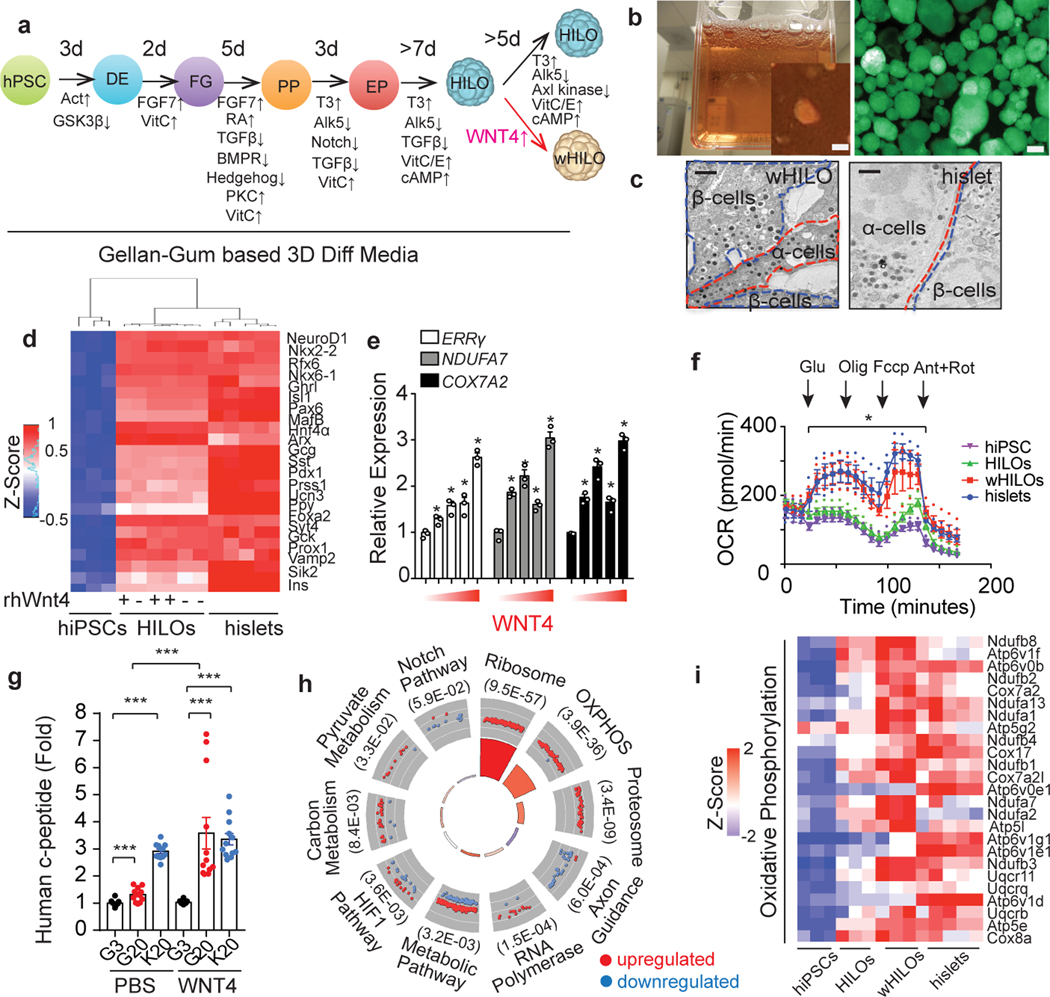
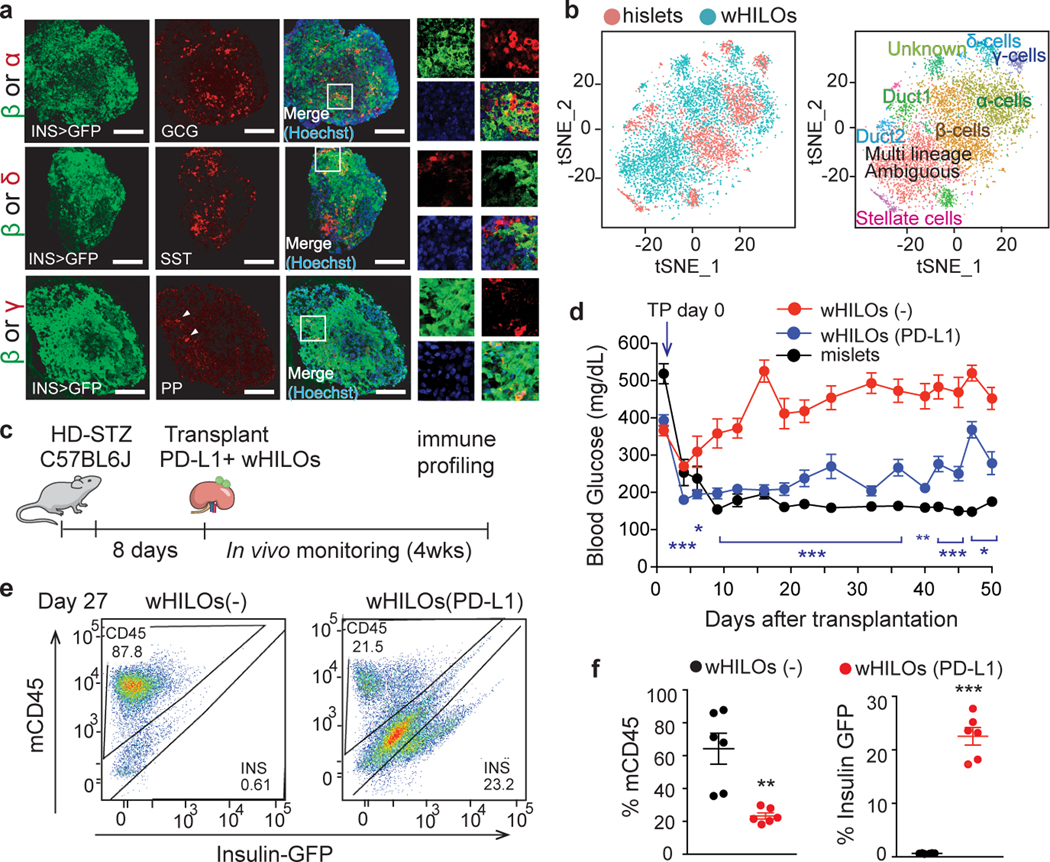
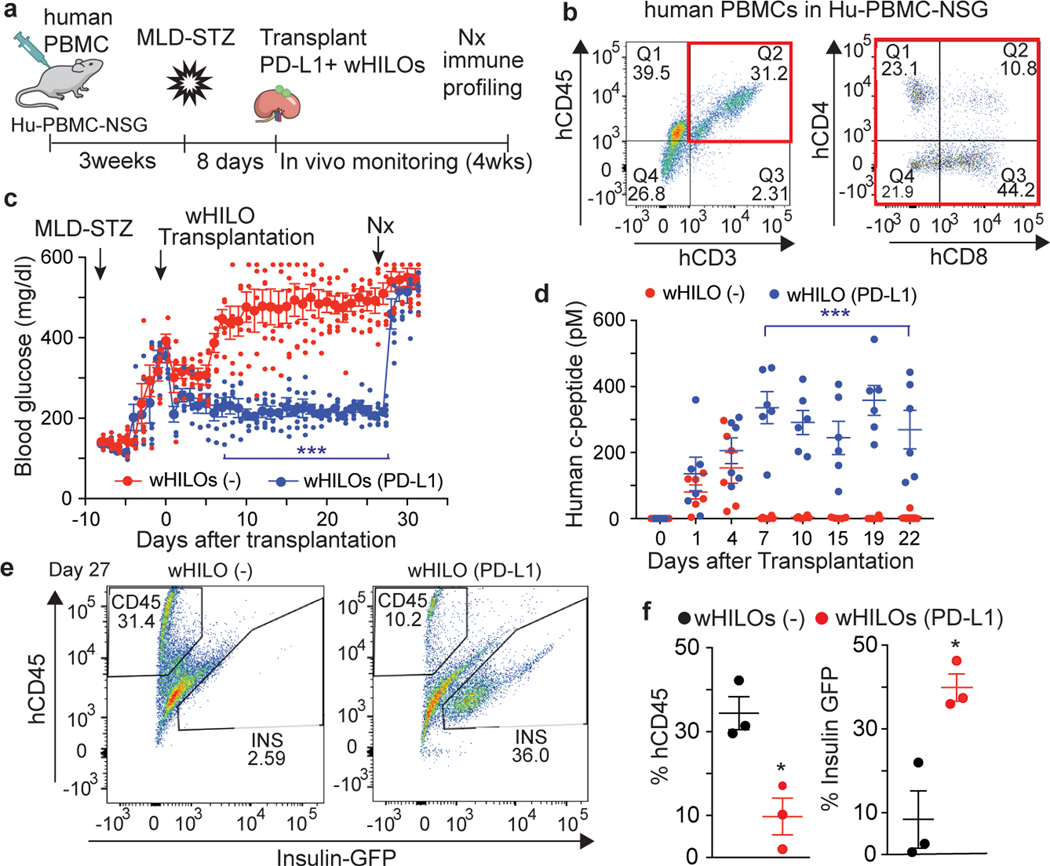
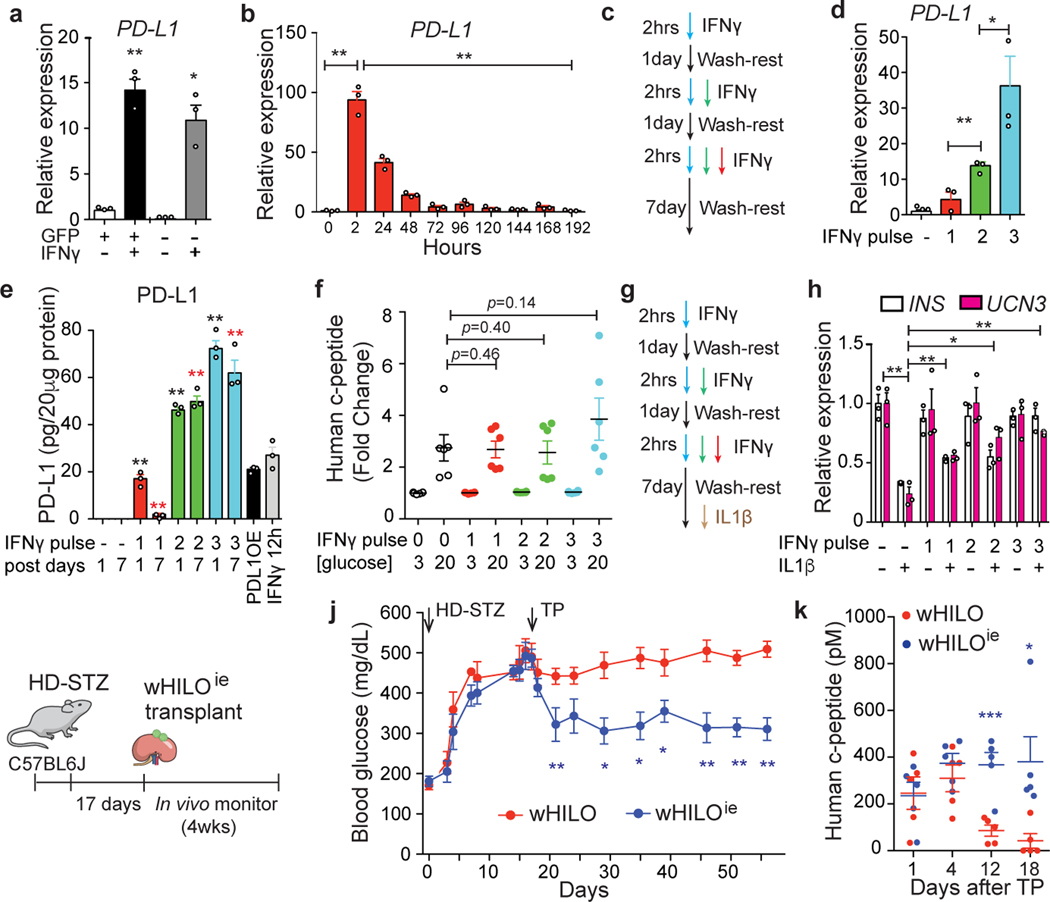
Islets derived from stem cells hold promise as a therapy for insulin-dependent diabetes, but there remain challenges towards achieving this goal1-6. Here we generate human islet-like organoids (HILOs) from induced pluripotent stem cells and show that non-canonical WNT4 signalling drives the metabolic maturation necessary for robust ex vivo glucose-stimulated insulin secretion. These functionally mature HILOs contain endocrine-like cell types that, upon transplantation, rapidly re-establish glucose homeostasis in diabetic NOD/SCID mice. Overexpression of the immune checkpoint protein programmed death-ligand 1 (PD-L1) protected HILO xenografts such that they were able to restore glucose homeostasis in immune-competent diabetic mice for 50 days. Furthermore, ex vivo stimulation with interferon-γ induced endogenous PD-L1 expression and restricted T cell activation and graft rejection. The generation of glucose-responsive islet-like organoids that are able to avoid immune detection provides a promising alternative to cadaveric and device-dependent therapies in the treatment of diabetes.


Figures

Extended Data Fig. 1.
Extended Data Fig. 1.. Cellular crosstalk drives functional maturation of hiPSC-derived β-like cells
a, Principal Component analysis of transcriptomes from human iPSCs (hiPSCs), primary human pancreatic epithelial cells (hPanc Epithelial), human adipose-derived stem cells (hADSCs), human pancreatic fibroblasts (hPanc Fibroblast), human umbilical vein endothelial cells (HUVECs) and human pancreatic microvascular endothelial cells (hPanc Endothelial) (n=3) b, Time course of human adipose-derived stem cell (hADSC) culture in Matrigel (1:1 dilution in hADSC media, 2 million cells in 300μl) showing intrinsic self-organization. Scale bar 1mm. c, Schematic for multi cellular islet-like spheroids (MCS) and islet-like spheroid (IS) generation. hiPSC-derived endocrine progenitor (EP) were co-cultured with hADSC and endothelial cells (EC, HUVECs) in gellan gum-based 3D culture system (left). MCS generated in Matrigel showing the incorporation of ECs (Lentivirus-mCherry expression) and insulin expression (Lentivirus-GFP, right). Scale bar 100 μm. d, MCS cultured in 3D gellan gum system showing insulin expression (Lentivirus-GFP, upper panel). Electron microscopy images of MCS showing insulin granules (lower right) and lipid droplets in hADSC (lower right). e, Gene expression in sorted insulin-expressing cells (GFP+) from IS, MCS, or human islets (hislets) (n=3) f, Human c-peptide secretion in response to 3mM (G3) or 20 mM (G20) glucose from IS, MCS and hislets (n=9) g, Random fed blood glucose levels in STZ-induced diabetic NOD-SCID mice after sham treatment or transplantation of MCS (500) or human islets (n=3, 3 and 5 respectively). h, Serum human c-peptide levels during feeding, fasting, and refeeding cycles in mice 4 weeks after transplantation (n=3 per group). i, Heatmap of expression changes during hADSC culture in Matrigel (left). Most significantly affected gene ontology category in indicated gene clusters (right) (n=3) j, Temporal expression of WNTs during hADSC self organization shown in (b) (n=3) Error bars represent ± SEM. *p<0.05, **p<0.01, ***p<0.001, one-tailed, student’s paired t test. Data representative of 3 independent experiments (b, d, e, f, g) or experimental triplicates (a, h, i, j).
Extended Data Fig. 2.
Extended Data Fig. 2.. WNT expression in human islets
a, Heatmap of relative expression of WNTs in human islets (n=5). b, tSNE clustering of human islet single cell transcriptomes (n= 3245). Annotated cell types assigned based on known marker gene expression. c, Heatmap of expression of top 10 signature genes in human islet cell clusters from Fig. 1b. d, Single cell expression of signature hormonal and cell type-specific genes in human islets. e,f, Single cell (e) and violin plots (f) of WNT2B, WNT4, WNT5A, WNT7A, WNT7B and WNT9A expression in human islets, statistics provided in Supplementary Table 5. Data from 3 pooled human islets (b-f).
Extended Data Fig. 3.
Extended Data Fig. 3.. Phenotypic and genotypic characterization of HILOs
a, Schematic of CRISPR-Cas9 knock-in for endogenous human insulin promoter-driven GFP expression in hiPSC. b, Representative differential interference contrast (DIC) images of wHILOs with insulin-GFP and UCN3-RFP expression (scale bar, 100μm, n=3). c, Relative expression of ISL1, SYT4, PDX1, GCK, NEUROD1, NKX2–2, INS, NKX6–1, MAFA, MAFB and UCN3 in wHILOs and human islets determined by qPCR (n=8 per sample type). d, Extracellular acidification rate (ECAR) measured in day 0 hiPSC spheroids (purple), PBS-treated HILOs (green), WNT4-treated HILOs (red) and human islets (blue) (n=3) e, Kinetics of human c-peptide secretion from WNT4-treated HILOs in response to progressive exposure to 3 mM glucose, 20 mM glucose, 20 mM glucose + 100 nM GLP-1, 3 mM glucose, and 3 mM glucose + 20 mM KCl. f, Glucose-stimulated human c-peptide secretion from wHILOs treated with and without XAV939 to promote β-catenin degradation (XAV939, 1μM for 3 days) (n=8) g, Temporal gene expression (NANOG, NGN3, PDX1, INS) during differentiation of hiPS, HUES8 and H1ES cells to HILOs (upper panel). Insulin-driven GFP expression in day 21 HILOs derived from HUES8 (lower panel, scale bar 100 μm). h, in vitro c-peptide secretion in response to 3 mM (G3) and 20 mM (G20) glucose in wHILOs from HUES8 and H1ES (n=3) i, Schematic depicting culture conditions for commercially available hiPSC-derived β-like cells (left) and light microscopy image of cultured cells (right, scale bar 100 μm). j, in vitro c-peptide secretion in response to 3 mM (G3) and 20 mM (G20) glucose from cultures described in (i) (n=8) k, Blood glucose levels in STZ-induced diabetic NOD-SCID mice. Transplantation (TP) of 500 wHILOs, hislets, or sham surgery was performed at day 3 (n=7, 6, and 3, respectively). l, Gene ontology of transcriptional changes induced by WNT4 treatment (100ng/ml WNT4 from day 26 to day 33) in wHILOs. Error bars represent ± SEM. *p<0.05, **p<0.01, ***p<0.001, one-tailed, student’s paired t test. Data representative of 3 independent experiments (b-h, i lower panel, k) or experimental triplicates (i upper panel, l).
Extended Data Fig. 4.
Extended Data Fig. 4.. WNT4 promotes mitochondrial maturation of HILOs
a, Representative images of insulin-GFP expression and MitoTracker staining (red) in PBS- and WNT4-treated HILOs (scale bar, 100μm). b, Flow cytometry quantification of insulin expression (GFP) and mitochondrial content in HILOs treated with recombinant human WNT4 (rhWNT4), WNT5A (rhWNT5A), or conditioned media (CM) from control or WNT5A overexpressing fibroblasts (n=3) c, Venn diagram showing overlap between WNT4-induced increases in chromatin accessibility in GFP+ cells and increases in HILO gene expression (upper panel), and gene ontology pathways enriched in the intersection gene set. d, Motifs enriched in the intersection gene set from (c). e, Chromatin accessibility at ERRγ target genes determined by ATAC-Seq in insulin-expressing cells sorted from HILOs treated with PBS or WNT4 (wHILO) for 7 days (fold change>1.5). Error bars represent ± SEM. *p<0.05, one-tailed, student’s paired t test. Data representative of 3 (a, b) or 2 (c-e) independent experiments.
Extended Data Fig. 5.
Extended Data Fig. 5.. ERRγ is required for WNT4-driven metabolic maturation
a-b, Postnatal islets (day P11–14) from WT and β cell specific ERRγKO mice were cultured with or without rhWNT4 (100ng/ml) for >5 days. Relative gene expression measured by qPCR (a), and insulin secretion in response to 3mM and 20mM glucose (b). n=3. Error bars represent ± SEM.*p<0.05, **p<0.01, ***p<0.001, one-tailed, student’s paired t test. Data representative of 2 independent experiments (a, b).
Extended Data Fig. 6.
Extended Data Fig. 6.. Immunofluorescence characterization of wHILOs
a-c, Confocal images of wHILOs stained for C-peptide (a), β cell enriched markers NKX2–2, NKX6–1, MAFA, MAFB, PDX1 (b), and endocrine markers chromogranin A (CHGA), Synaptophysin (red) with Insulin-GFP (green) visualization (c). (d) Magnification of 75μm x75μm boxed regions shown in (b) and (c). (e) Immunofluorescence images of wHILOs showing insulin (GFP), β cell markers MAFA and MAFB, and α cell marker glucagon expression. Hoechst nuclei staining (blue). Scale bar: 100 μm panels a-c, 10μm panel e. Images are representative of 3 independent experiments.
Extended Data Fig. 7.
Extended Data Fig. 7.. Flow cytometry analysis of HILOs
a, Representative flow cytometry results for β cell and endocrine marker co-staining in HILOs with and without WNT4 treatment. b, Quantification of results in a (n=6).
Extended Data Fig. 8.
Extended Data Fig. 8.. Single cell analysis of wHILOs
a, tSNE clustering of single cell transcriptomes from WNT4-treated HILOs (wHILOs, n=4840). b, c, Violin Plots (b) and single cell expression (c) of INS, CHGA, SOX9, HES1 in wHILOs. d, Expression of β cell-enriched (INS, PDX1, NKX6–1, NKX2–2, NEUROD1, NPTX2, ITGA1, PCSK1, MAFA, MAFB, UCN3, CHGA), α cell-enriched (GCG, ARX) and δ cell-enriched genes (SST, RBP4) overlaid on tSNE clustering. e, Heatmap of top 10 differentially expressed genes in each cell cluster. f, tSNE clusters colored according to cell type (Panc P = pancreatic progenitor, Rep = replicating, UK = unknown) g, UMAP clustering of combined HILOs and wHILO single cell data sets after expression restoration of sparse counts using SAVER. h, Heatmap shows the differentially expressed genes (LogFC) between HILOs and wHILOs in ESRRG and INS double positive cells using WhichCells function (expression > 0.1). i, Distribution of ERRγ (ESRRG; min: 0.10, 0.50; 1stQ: 0.14, 1.15; mean: 0.54, 1.22; 3rdQ 0.90, 1.56; max: 1.60, 1.60 for HILOs and wHILOs respectively), NDUFV3 (min: −0.31, 1.21; 1stQ; −0.01, 1.33; mean: 0.49, 1.67; 3rdQ 1.00, 1.98; max: 2.22, 2.14 for HILOs and wHILOs respectively), LDHA (min: 0.05, 1.02; 1stQ; 0.50, 1.21; mean: 1.35, 1.33; 3rdQ 1.90, 1.44; max: 3.53, 1.67 for HILOs and wHILOs respectively) gene expression in ESRRG and INS double-positive HILOs (n=38) and wHILOs (n=9). Data pooled from three independent samples (a-i).
Extended Data Fig. 9.
Extended Data Fig. 9.. PD-L1 expression in HILOs
a, Endogenous PD-L1 expression highlighted in red in human islet cells (n= 3245) (β cells are outlined in red). b, Heatmap of top differentially expressed genes between PD-L1+ and PD-L1- β cells. c, Immunohistochemistry showing overlap of lentiviral-driven PD-L1 expression and insulin promoter-driven GFP expression in wHILOs (scale bar, 100μm). d, Human PD-L1 and human insulin expression in wHILOs with and without lentiviral PD-L1 overexpression, as measured by qPCR (n=3). e, Transplantation of PD-L1 overexpressing wHILOs into the kidney capsule of STZ-induced diabetic mice. f, Blood glucose levels of C57BL6J mice treated with high dose streptozotocin (HD-STZ) prior to transplantation of wHILOs with and without PD-L1 overexpression (500 wHILOs into each kidney, total 1,000 wHILOs) (n=3) g, PD-L1 expression in human islet 12 hours after IFNγ stimulation (n=5). h, PD-L1 expression in wHILOs 12 hours after indicated IFNγ stimulation (n=3). Error bars represent ± SEM. *p<0.05, **p<0.01, ***p<0.001, one-tailed, student’s paired t test. Data were pooled from 3 independent samples (a) or representative of 3 independent experiments (c, d, g, h).
Extended Data Fig. 10.
Extended Data Fig. 10.. Immune profiling of C57BL6J wHILO grafts
a, Flow cytometry analysis of insulin expressing and mouse immune (CD45+) cells recovered from kidney capsule grafts 27 days after transplantation of wHILOs with and without PD-L1 expression. CD45+ cells were further categorized as B cells (CD19+), T cells (CD3+) and NK cells (NK1.1+). b, Quantification of a, (n=6 and 6). c, wHILO (PD-L1) cells in kidney graft 27 days after transplantation (insulin promoter driven GFP expression). Scale bar, 100 μm. Error bars represent ± SEM. *p<0.05, one tailed, student’s paired t test. Data representative of 2 independent experiments.
Extended Data Fig. 11.
Extended Data Fig. 11.. IFNγ-induced changes in wHILOs
a, Venn diagram of differentially regulated genes upon acute (12h at 10 ng/ml) and multi pulse stimulated (MPS; 2h at 10 ng/ml for 3 days) IFNγ treatment of wHILOs. b, Heatmap of differentially expressed genes upon acute and MPS IFNγ stimulation. Sustainable PD-L1 gene expression by MPS is indicated. c, Gene ontology of selectively regulated genes upon MPS-IFNγ (top panel) and acute IFNγ (bottom panel) treatments. d, Browser tracks showing chromatin accessibility at selected genes 7 days after last IFNγ treatment in MPS or 12 hours after acute IFNγ stimulation in wHILOs. Data were from triplicate (a-c) or duplicate (d) samples.
Extended Data Fig. 12.
Extended Data Fig. 12.. Immune evasive wHILOs by enhanced endogenous PD-L1 expression
a, Schematic showing multi-low dose streptozotocin treatment (MLD-STZ, 50mg/kg/day for 5 days) of Hu-PBMC-NSG mice to make immune competent diabetic model. MPS induced PD-L1 expressing wHILOs (n=500) were transplanted under kidney capsule. b, Random fed blood glucose levels in STZ-induced diabetic Hu-PBMC-NSG mice after transplantation of wHILOs with or without MPS (n=6). Data for wHILOs (−) from Fig. 4c was used since those experiments were performed in parallel. c, Flow cytometry analyses of insulin-expressing and human immune (CD45+) cells recovered from kidney capsule grafts 27 days after transplantation of wHILOs with or without MPS. Error bars represent ± SEM. *p<0.05, **p<0.01, ***p<0.001, one-tailed, student’s paired t test. Data were compiled from (b) or representative of 2 independent experiments.
Fig. 1.
Fig. 1.. WNT4 induces functional maturation of human islet-like organoids (HILOs)
a, Schematic of human islet-like organoid (HILO) generation. b, Representative images of HILOs in 3D culture (left panel), and insulin expression (human insulin promoter driven GFP, right panel, scale bar 100 μm). c, Electron microscopy images showing insulin and glucagon granules in β and α cells, respectively, in WNT4-treated HILOs (wHILOs) and human islets. Scale bar, 1 μm. d, Heatmap of relative expressions of key islet genes in hiPSCs (n=3), HILOs treated with PBS (−)(n=3) or WNT4 (+) (n=3), and human islets (n=5) (log2 expression with Z-score). e, Relative expression of ERRγ, NDUFA7 and COX7A2 in HILOs after treatment with increasing concentrations of WNT4 (0, 10, 25, 50, 200ng/ml for 5 days) (n=3). f, Oxygen consumption rate (OCR) measured in hiPSC spheroids (day 0, purple), PBS-treated HILOs (green), WNT4-treated HILOs (red) and human islets (blue) (n=3) g, in vitro human c-peptide secretion in response to 3mM (G3) or 20 mM (G20) glucose or 20mM KCl (K20) from HILOs generated with and without WNT4 treatment (n=12) h, Gene ontology of WNT4-regulated genes in HILOs (100ng/ml WNT4 from day 26 to day 33). i, Heatmap of relative expressions of oxidative phosphorylation genes in 3D cultured hiPSCs (n=3), HILOs (n=3), HILOs after WNT4 treatment (wHILOs) (n=3), and human islets (n=5)(Z-Score). Error bars represent ± SEM.*p<0.05, ***p<0.001, one-tailed, student’s paired t test. Data representative of 3 independent experiments (c, e, f, g).
Fig. 2.
Fig. 2.. Exogenous PD-L1 expression extends wHILO functionality in immune competent mice
a, Representative immunofluorescence staining for glucagon, somatostatin and pancreatic polypeptide (PP) in wHILOs. b, tSNE clustering of combined wHILO (blue dots, n=4840) and human islet (red dots, n= 3245) single cell transcriptomes (left panel) and clustering analysis-defined cell types (left). c, Schematic of experimental program. High dose streptozotocin (HD-STZ, 180mg/kg) induced diabetic C57BL6J mice received transplants of wHILOs with and without PD-L1 overexpression (n=500), or mouse islets. d, Random fed blood glucose levels after transplantation of wHILOs with or without PD-L1 expression (n=11 and 9, respectively), and C57BL6J islets (n=7). e, Flow cytometric analysis of insulin-expressing and mouse immune (CD45+) cells recovered from kidney capsule grafts 27 days after transplantation of wHILOs with and without PD-L1 expression (n=6). f, Quantification of analyses in (d). Error bars represent ± SEM. *p<0.05, **p<0.01, ***p<0.001, one-tailed, student’s paired t test. Images are representative of 3 independent experiments. Data were representative (e), or compiled from 3 independent samples (b) or experiments (d, f).
Fig. 3.
Fig. 3.. wHILOs (PD-L1) provide extended glucose control in humanized mice
a, Schematic showing transplantation of wHILOs with and without PD-L1 overexpression (500 HILOs per mouse) into multi low dose streptozotocin (MLD-STZ, 50mg/kg/day for 5 days) induced diabetic Hu-PBMC-NSG mice. b, Flow cytometric analysis of human T cells (CD4+ and CD8+ cells in CD45+/CD3+ population) in PBMC from Hu-PBMC-NSG mice (n=15 mice), 3 weeks after human PBMC transplantation. c, Random fed blood glucose levels in MLD-STZ induced diabetic Hu-PBMC-NSG mice after transplantation of wHILOs with or without PD-L1 expression (n=6). d, Serum human c-peptide levels in mice described in (c) (n=6). e, Flow cytometric analysis of insulin-expressing and human CD45+ immune cells recovered from kidney capsule grafts 27 days after transplantation of wHILOs with and without PD-L1 expression. f, Quantification of analyses in (e) (n=3). Error bars represent ± SEM. *p<0.05, **p<0.01, ***p<0.001, one-tailed, student’s paired t test. Data representative (b, e) or compiled from (c, d, f) 2 independent experiments.
Fig. 4.
Fig. 4.. Enhanced endogenous PD-L1 expression generates immune evasive wHILOs
a, PD-L1 expression in cells sorted for insulin expression (GFP+ and GFP-, respectively) from wHILOs after IFNγ treatment (10ng/ml, 12 hours). b, Temporal PD-L1 expression in wHILOs after a single IFNγ treatment (10ng/ml, 2 hours). c, Schematic of IFNγ (10ng/ml) pulse treatment. d, PD-L1 expression induced by indicated cycles of IFNγ treatment, 7 days after last treatment. e, PD-L1 protein levels 1 and 7 days after indicated IFNγ (10ng/ml) treatments. PD-L1 overexpressing wHILOs (PDL1OE) and a single 12 h exposure to IFNγ were used as positive control. f, Human c-peptide secretion from IFNγ treated wHILOs in response to 3mM (G3) or 20mM (G20) glucose. g, Schematic of IFNγ treatment in combination with an IL1β challenge (10ng/ml for 24 hours) to induce β cell dedifferentiation. h, INS and UCN3 expression after indicated IFNγ and IL1β treatments of wHILOs. i, Schematic of experimental program. High dose streptozotocin (HD-STZ, 180mg/kg) induced diabetic C57BL6J mice received transplants of 500 wHILOs with or without the IFNγ treatment shown in (c). j, Blood glucose levels in recipient mice after transplantation at day 17 of wHILOs or IFNγ multi pulse-stimulated wHILO (wHILOie) (n=6). k, Serum human c-peptide levels in mice described in (i) (n=5). Error bars represent ± SEM. *p<0.05, **p<0.01, one-tailed, student’s paired t test. n=3 (a,b,d,e,h) and n=6 (e). Data representative (a, b, d, e, f, h) or compiled from (j, k) 3 independent experiments.

Comment in

References

    1. Yoshihara E. et al. ERRgamma Is Required for the Metabolic Maturation of Therapeutically Functional Glucose-Responsive beta Cells. Cell metabolism 23, 622–634, doi:10.1016/j.cmet.2016.03.005 (2016). - DOI - PMC - PubMed
    1. Hrvatin S. et al. Differentiated human stem cells resemble fetal, not adult, beta cells. Proceedings of the National Academy of Sciences of the United States of America 111, 3038–3043, doi:10.1073/pnas.1400709111 (2014). - DOI - PMC - PubMed
    1. Rezania A. et al. Reversal of diabetes with insulin-producing cells derived in vitro from human pluripotent stem cells. Nature biotechnology 32, 1121–1133, doi:10.1038/nbt.3033 (2014). - DOI - PubMed
    1. Pagliuca FW et al. Generation of functional human pancreatic beta cells in vitro. Cell 159, 428–439, doi:10.1016/j.cell.2014.09.040 (2014). - DOI - PMC - PubMed
    1. Kieffer TJ Closing in on Mass Production of Mature Human Beta Cells. Cell stem cell 18, 699–702, doi:10.1016/j.stem.2016.05.014 (2016). - DOI - PubMed

Publication types

MeSH terms