Features of increased malignancy in eosinophilic clear cell renal cell carcinoma
- PMID: 32815150
- PMCID: PMC7756750
- DOI: 10.1002/path.5532
Features of increased malignancy in eosinophilic clear cell renal cell carcinoma
Abstract
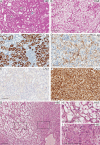
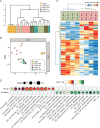
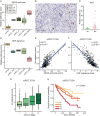
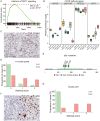
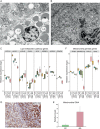
Clear cell renal cell carcinoma (ccRCC) is the most common form of renal cancer. Due to inactivation of the von Hippel-Lindau tumour suppressor, the hypoxia-inducible transcription factors (HIFs) are constitutively activated in these tumours, resulting in a pseudo-hypoxic phenotype. The HIFs induce the expression of genes involved in angiogenesis and cell survival, but they also reset the cellular metabolism to protect cells from oxygen and nutrient deprivation. ccRCC tumours are highly vascularized and the cytoplasm of the cancer cells is filled with lipid droplets and glycogen, resulting in the histologically distinctive pale (clear) cytoplasm. Intratumoural heterogeneity may occur, and in some tumours, areas with granular, eosinophilic cytoplasm are found. Little is known regarding these traits and how they relate to the coexistent clear cell component, yet eosinophilic ccRCC is associated with higher grade and clinically more aggressive tumours. In this study, we have for the first time performed RNA sequencing comparing histologically verified clear cell and eosinophilic areas from ccRCC tissue, aiming to analyse the characteristics of these cell types. Findings from RNA sequencing were confirmed by immunohistochemical staining of biphasic ccRCC. We found that the eosinophilic phenotype displayed a higher proliferative drive and lower differentiation, and we confirmed a correlation to tumours of higher stage. We further identified mutations of the tumour suppressor p53 (TP53) exclusively in the eosinophilic ccRCC component, where mTORC1 activity was also elevated. Also, eosinophilic areas were less vascularized, yet harboured more abundant infiltrating immune cells. The cytoplasm of clear cell ccRCC cells was filled with lipids but had very low mitochondrial content, while the reverse was found in eosinophilic tissue. We herein suggest possible transcriptional mechanisms behind these phenomena. © 2020 The Authors. The Journal of Pathology published by John Wiley & Sons, Ltd. on behalf of The Pathological Society of Great Britain and Ireland.
Keywords: VHL; clear cell; electron microscopy; eosinophilic; granular; kidney cancer; mTOR; mitochondria; p53; renal cell carcinoma; vasculature.
© 2020 The Authors. The Journal of Pathology published by John Wiley & Sons, Ltd. on behalf of The Pathological Society of Great Britain and Ireland.
Figures

Similar articles
-
Combined deletion of Vhl, Trp53 and Kif3a causes cystic and neoplastic renal lesions.J Pathol. 2016 Jul;239(3):365-73. doi: 10.1002/path.4736. Epub 2016 May 30. J Pathol. 2016. PMID: 27126173
-
The von Hippel-Lindau tumor suppressor protein regulates gene expression and tumor growth through histone demethylase JARID1C.Oncogene. 2012 Feb 9;31(6):776-86. doi: 10.1038/onc.2011.266. Epub 2011 Jul 4. Oncogene. 2012. PMID: 21725364 Free PMC article.
-
VHL missense mutations in the p53 binding domain show different effects on p53 signaling and HIFα degradation in clear cell renal cell carcinoma.Oncotarget. 2017 Feb 7;8(6):10199-10212. doi: 10.18632/oncotarget.14372. Oncotarget. 2017. PMID: 28052007 Free PMC article.
-
Clear cell renal cell carcinoma with wild-type von Hippel-Lindau gene: a non-existent or new tumour entity?Histopathology. 2019 Jan;74(1):60-67. doi: 10.1111/his.13749. Histopathology. 2019. PMID: 30565303 Review.
-
Significance of PI3K signalling pathway in clear cell renal cell carcinoma in relation to VHL and HIF status.J Clin Pathol. 2021 Apr;74(4):216-222. doi: 10.1136/jclinpath-2020-206693. Epub 2020 May 28. J Clin Pathol. 2021. PMID: 32467322 Review.
Cited by
-
Dynamic changes of SCGN expression imply different phases of clear cell renal cell carcinoma progression.Discov Oncol. 2024 Jun 3;15(1):205. doi: 10.1007/s12672-024-01071-4. Discov Oncol. 2024. PMID: 38831128 Free PMC article.
-
Versatile roles of annexin A4 in clear cell renal cell carcinoma: Impact on membrane repair, transcriptional signatures, and composition of the tumor microenvironment.iScience. 2025 Mar 11;28(4):112198. doi: 10.1016/j.isci.2025.112198. eCollection 2025 Apr 18. iScience. 2025. PMID: 40212597 Free PMC article.
-
Comparison of Histologic Parameters and Predictive Gene Signatures in Clear Cell Renal Cell Carcinoma Response to Systemic Therapy.Pathol Int. 2025 Jun;75(6):267-277. doi: 10.1111/pin.70012. Epub 2025 May 27. Pathol Int. 2025. PMID: 40432277 Free PMC article.
-
Mutated ASXL1 upregulates mTOR expression in renal cell carcinoma with fibromyomatous stroma.Virchows Arch. 2024 Aug;485(2):379-382. doi: 10.1007/s00428-023-03667-7. Epub 2023 Dec 16. Virchows Arch. 2024. PMID: 38102390
-
Integration of NRP1, RGS5, and FOXM1 expression, and tumour necrosis, as a postoperative prognostic classifier based on molecular subtypes of clear cell renal cell carcinoma.J Pathol Clin Res. 2021 Nov;7(6):590-603. doi: 10.1002/cjp2.232. Epub 2021 Jul 2. J Pathol Clin Res. 2021. PMID: 34212534 Free PMC article.
References
-
- Ricketts CJ, De Cubas AA, Fan H, et al The Cancer Genome Atlas comprehensive molecular characterization of renal cell carcinoma. Cell Rep 2018; 23 3698. - PubMed
-
- Rini BI, Campbell SC, Escudier B. Renal cell carcinoma. Lancet 2009; 373 1119–1132. - PubMed
-
- Moch H, Humphrey PA, Ulbright TM, et al WHO Classification of Tumours of the Urinary System and Male Genital Organs WHO Classification of Tumours Vol. 8, (4th edn). IARC Press: Lyon, 2016.
-
- Kaelin WG Jr. The von Hippel–Lindau tumor suppressor protein and clear cell renal carcinoma. Clin Cancer Res 2007; 13(2 Pt 2): 680s–684s. - PubMed
Publication types
MeSH terms
Substances
LinkOut - more resources
Full Text Sources
Medical
Research Materials
Miscellaneous

