Review
. 2020 Oct 14;120(19):10834-10886.
doi: 10.1021/acs.chemrev.0c00015. Epub 2020 Aug 20.

Physical and Chemical Factors Influencing the Printability of Hydrogel-based Extrusion Bioinks

Affiliations
Review

Physical and Chemical Factors Influencing the Printability of Hydrogel-based Extrusion Bioinks

Sang Cheon Lee et al. Chem Rev. .

Abstract

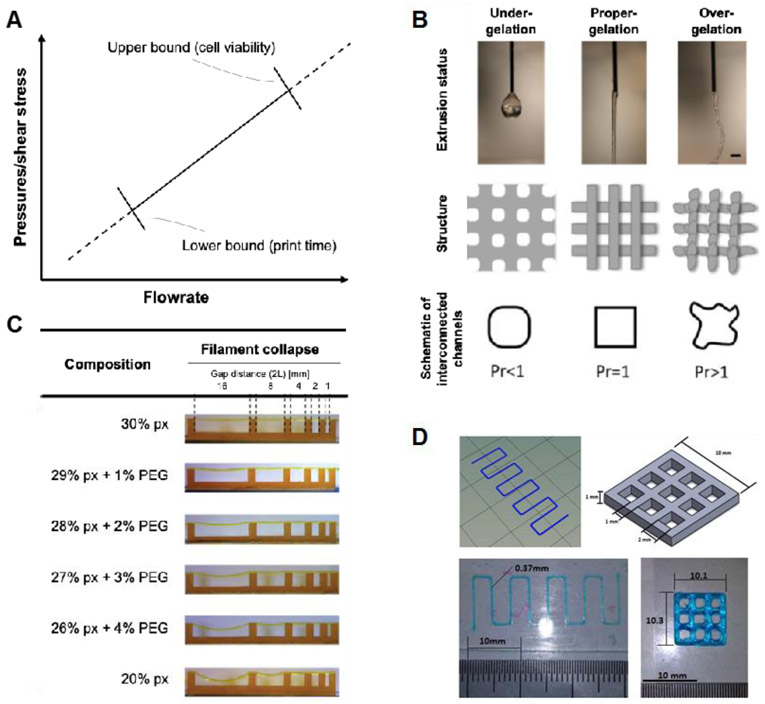
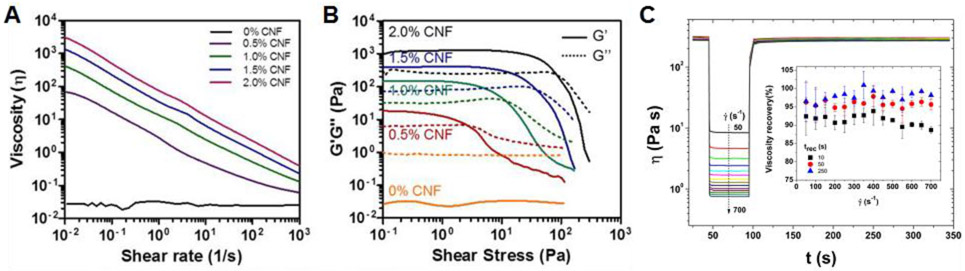
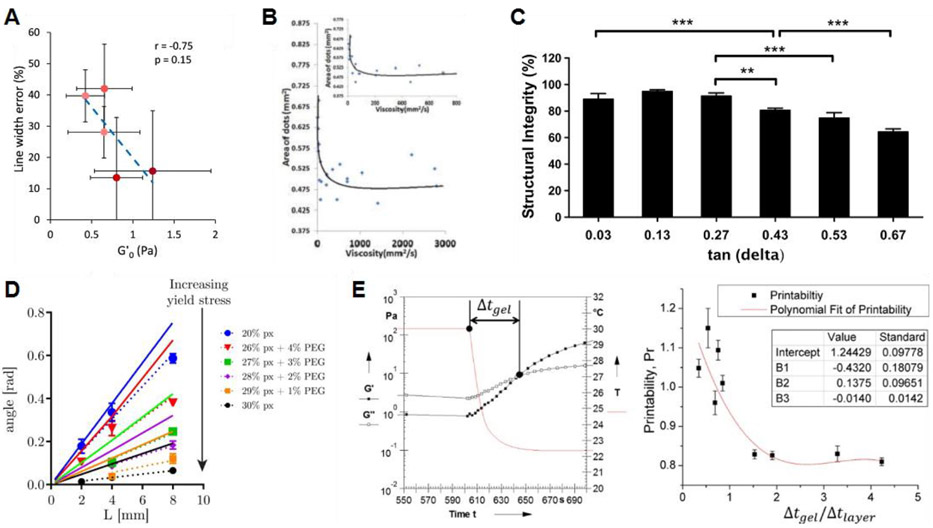
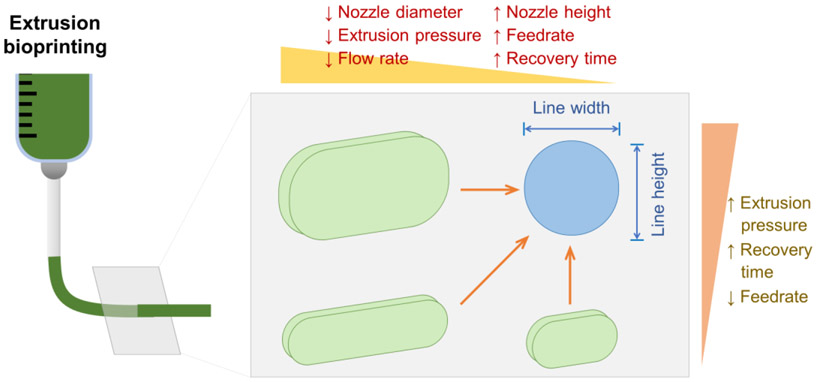
Bioprinting researchers agree that "printability" is a key characteristic for bioink development, but neither the meaning of the term nor the best way to experimentally measure it has been established. Furthermore, little is known with respect to the underlying mechanisms which determine a bioink's printability. A thorough understanding of these mechanisms is key to the intentional design of new bioinks. For the purposes of this review, the domain of printability is defined as the bioink requirements which are unique to bioprinting and occur during the printing process. Within this domain, the different aspects of printability and the factors which influence them are reviewed. The extrudability, filament classification, shape fidelity, and printing accuracy of bioinks are examined in detail with respect to their rheological properties, chemical structure, and printing parameters. These relationships are discussed and areas where further research is needed, are identified. This review serves to aid the bioink development process, which will continue to play a major role in the successes and failures of bioprinting, tissue engineering, and regenerative medicine going forward.


Figures

Figure 1.
Figure 1.
Different aspects of printability. (A) Extrudability can be defined at any point along with the pressure-flowrate relationship. Notably, a minimum flowrate is required to achieve reasonable print times and maximum extrusion force is limited to achieve reasonable cell viability after extrusion. (B) Filament classification has been used to describe the types of filaments which a bioink can form. This example measure from Ouyang et al. shows how the phenomenon can both be observed qualitatively and measured quantitatively. Reprinted with permission from ref. Copyright 2017 IOP Publishing Ltd. (C) Shape fidelity refers to the ability of a bioink to maintain its structure upon deposition. The example here from Ribeiro et al. tests a bioink’s ability to form lateral pores. Reprinted with permission from ref. Copyright 2017 IOP Publishing Ltd. (D) Printing accuracy refers to the similarity of the printed structure to the original design as influenced by the printing conditions. This example from Giuseppe et al. uses zig-zag and cross-hatch structures to compare dimensions. Reprinted with permission from ref. Copyright 2017 Elsevier Ltd.
Figure 2.
Figure 2.
Common rheological measures associated with bioink printability (A) Shear-thinning behavior of bioinks (log scale) with viscosity decreasing as shear rate increases. Reprinted with permission from ref. Copyright 2017 BioResources. (B) Viscoelastic and yielding behavior of bioinks. G’ and G” can be averaged from the linear viscoelastic region while yield stress can be defined at the crossover point between G’ and G”. Reprinted with permission from ref. Copyright 2017 BioResources. (C) Recovery behavior of a bioink using different shear rates to model the extrusion phase. Reprinted with permission from ref. Copyright 2018 Springer-Verlag London Ltd.
Figure 3.
Figure 3.
Identified relationships between rheology and shape fidelity. (A) Diamantides et al. related the storage modulus of their bioinks to filament width relative to nozzle size. Reprinted with permission from ref. Copyright 2017 IOP Publishing Ltd. (B) Jia et al. related the viscosity of their bioinks to the area covered by printed dots. Reprinted with permission from ref. Copyright 2014 Elsevier Ltd. (C) Gao et al. related the tan delta (loss tangent) of their bioinks to the height of a 5-layer tubular structure. Reprinted with permission from ref. Copyright 2018 IOP Publishing Ltd. (D) Ribeiro et al. related the yield stress of their bioinks to its angle of deflection across unsupported gaps of varying distances. Reprinted with permission from ref. Copyright 2017 IOP Publishing Ltd. (E) Ouyang et al. related the gelation kinetics of their bioinks to the shape of horizontal pores, quantified using their Pr value. Reprinted with permission from ref. Copyright 2016 IOP Publishing Ltd.
Figure 4.
Figure 4.
Relationships among printability measures and process parameters to control line width and line height (cross-sectional geometry).
Figure 5.
Figure 5.
(A) Schematic illustration for preparing gallol-rich, shear-thinning hydrogels of HA-Ga/OEGCG. (B) The proposed multiple hydrogen bond formation (red dashed line) between the gallol-to-gallol moieties and gallol-to-HA backbone. (C) Changes in viscosity as a function of shear rates for HA-Ga/OEGCG hydrogels with the [HA unit]/[gallol in OEGCG] ratio of 7 (blue), 2 (black), or 0.5 (red). (D) The recovery measurement of G′ displaying the hydrogel structure under alternating strain from 0.1% to 10% back down to 0.1%. (E) A photograph showing the injectability of the HA-Ga/OEGCG hydrogel (the ratio = 0.5) using a 26G needle (inner diameter = 0.26 mm). Reprinted with permission from ref. Copyright 2017 American Chemical Society. (F) Schematic illustration of the 3D printing where the gallol ECM hydrogel ink transitions from a shear-thinning hydrogel during printing to one with mechanical stabilization via oxidation after the printing. (G) Printability of the gallol ECM ink with various concentrations (4, 6 wt%) and injectability as a function of the time after gel formation (0.5, 1, 2 h). Scale bars of 4 mm. Reprinted with permission from ref. Copyright 2019 Elsevier.
Figure 6.
Figure 6.
(A) Chemical structure of the ABA triblock copolymer. (B) Schematics of the reversible sol-gel transition of the prepared hydrogel under temperature switch. (C) Gelation test of UNONU and NON polymer solutions under cold (4°C) and warm (37°C) conditions via simple tilting. (D) Dynamic strain amplitude cyclic test (γ = 0.5% and 200%) of the hydrogel at 37°C showing rapid self-healing behavior. (E) Frequency-dependent (at a strain of 1%) oscillatory shear rheology of the hydrogel. (F) Viscosity measurement of the hydrogel (inset: injection test of the hydrogel at room temperature). (G) Hydrogels were cut into equal halves by a razor blade. (H) The self-healed hydrogels can also withstand stretching, scale bars: 1 cm. Reprinted with permission from ref. Copyright 2017 American Chemical Society.
Figure 7.
Figure 7.
(A) Scheme of the synthesis of PEDOT:S-Alg-Ad polymers. (B) Schematic of dynamic cross-link formation utilizing host-guest complexation. (C) Continuous flow experiments showing the shear stress (closed symbols) and viscosity (open symbols) of different host-guest conductive hydrogels. (D) Self-healing property of the conductive hydrogel when the alternate step strain switched from 1 to 500%. (E) Bright-field images of the self-healing process of PEDOT:S-Alg-Ad (2:1)/Pβ-CD hydrogels. Reprinted with permission from ref. Copyright 2019 American Chemical Society.
Figure 8.
Figure 8.
(A) Schematic illustration of (i) synthesis of the highly branched CB[n]-threaded polyrotaxane (HBP-CB[n]) via a semi-batch RAFT polymerization in the presence of CB[n] (CTA : chain transfer agent (benzyltrithiocarbonyl propionic acid) and ACVA : 4,4′-azobis(4-cyanovaleric acid)), (ii) chemical structures of its linear analog (LP), and (iii) naphthyl-functionalized hydroxyethyl cellulose (HECNp). (B) Formation of hydrogel networks through a two-component strategy from HBP-CB[8] polyrotaxane (HBP-CB[8]@HECNp) or a three-component strategy from its linear analog (LP@CB[8]@HECNp). Inset: inverted vial tests for the hydrogel networks. Reprinted with permission from ref. Copyright 2018 WILEY-VCH. (C) Light-controlled supramolecular hydrogels. (D) Step-strain rheology alternating between 10% staring and 300% strain for physically crosslinked hydrogels (State I), chemically cross-linked hydrogels (State II), or hydrogels with cross-links reversed by exposure to 254 nm irradiation (State III). (E) Hydrogel swelling and dissipation determined by bathing pre-formed hydrogels in water and hydrogel stability through vial inversion. (F) Hydrogels were patterned by irradiation with 365 nm light using a mask, and the remaining supramolecular network was dissolved in water to leave a patterned covalent hydrogel. Reprinted with permission from ref. Copyright 2019 The Royal Society of Chemistry.
Figure 9.
Figure 9.
(A) Schematic illustration and molecular structure of bisphosphonate-modified hyaluronic acid (HA-BP). (B) Efficient in situ self-assembly of BP-M NPs surrounding grafted BP groups of HA-BP macromers via BP-M coordination. (C) Hydrogel networks are stabilized by the BP-M NPs. (D) Representative elements (AEM and TM) and diameters of corresponding divalent cations (numbers under the name of elements, unit: pm) used for hydrogel fabrication. (E,F) Representative oscillatory rheological analysis results of the nanocomposite hydrogels prepared with a series of AEM ions and TM ions, respectively. All hydrogels were prepared with identical concentrations of ions, free BP, and HA-BP. (G) Rheological data for the HA-BP-M nanocomposite hydrogels under alternating high (20%) and low shear (0.1%). Reprinted with permission from ref. Copyright 2019 WILEY-VCH.
Figure 10.
Figure 10.
(A) Illustration of the hierarchical self-assembly process during gelation and the Printed hollow triangle structure. (B) Gelation in the folate/Zn2+ system. (C) Viscosity of folate/Zn2+ hydrogel at an increased shear rate followed by reverse shear rate decrease in continuous flow experiments. (D) Continuous step-stain measurements, which were carried out in steps of 50 and 0.5% oscillatory strain for four cycles. (Hydrogels used in (C) and (D) were [folate] = 15 mM, folate/Zn2+ = 1/1.8.). Reprinted with permission from ref. Copyright 2018 American Chemical Society.
Figure 11.
Figure 11.
Schematic representation of the method developed to fabricate the DC and DN hydrogels. Besides the DOPA-CHT, GP, and Fe3+ ions, DN hydrogels are also composed of MMW-CHT. The inset depicts a picture of the obtained hydrogels (DC and DN showed a similar appearance). Two crosslinking processes were employed to produce the hydrogels, namely a covalent cross-linking using GP and a physical cross-inking through coordination bonds in the presence of Fe3+ ions. Therefore, DC hydrogels can be composed of bis- and tris-complexes Fe:DOPA-CHT (a) or/and covalent bonds between two DOPA-CHT chains (b). Additionally, DN hydrogel can also establish covalent bonds between a chain of DOPA-CHT and a chain of MMW-CHT (c) or/and between two chains of MMW-CHT (d). Reprinted with permission from ref. Copyright 2017 WILEY-VCH.
Figure 12.
Figure 12.
(A) 4-Arm PEG-His forms hydrogel networks with Ni2+, Cu2+, or Co2+ ions based on His-M2+ coordination complexes formation. (B) Viscoelastic properties of PEG-His-M2+ hydrogels controlled by longwave low-intensity UV irradiation (365 nm). Reprinted with permission from ref. Copyright 2017 The Royal Society of Chemistry. (C) Schematic showing the protein network assembled by SpyTag/SpyCatcher chemistry and Co/His6-tag coordination. AA, SpyTag-ELP-SpyTag. BB, SpyCatcher-ELP-SpyCatcher. ELP, elastin-like polypeptide. (D, E) Dynamic frequency sweep tests on the products of AA + BB + Co2+ and AA + BB + Co2+ + NaIO4 with a fixed strain of 5%. The concentration of Co2+ is 3 mM. The insets show the products of AA + BB + Co2+ in the absence and presence of NaIO4. Reprinted with permission from ref. Copyright 2019 American Chemical Society.
Figure 13.
Figure 13.
(A) ELP-HA is composed of hydrazine-modified elastin-like protein (ELP-HYD) and aldehyde-modified hyaluronic acid (HA-ALD). (B) Schematic of ELP-HA hydrogel formation. (C) Photographs demonstrating the injectability and rapid self-healing of ELP-HA hydrogels. (D) Oscillatory time sweep of ELP-HYD (4 wt%) and HA-ALD (2 wt%) before mixing and after mixing to form the ELP–HA (2, 1 wt%) hydrogel. Storage modulus (G′) shown with filled symbols and loss modulus (G″) shown with empty symbols; tested at 25 °C. (E) Oscillatory time sweep of ELP–HA hydrogels for 5 min at 25°C and 5 min at 37°C. (F) ELP-HA hydrogel viscosity as a function of shear rate at 37°C under continuous flow. (G) Shear-thinning and self-healing behavior of ELP–HA hydrogel under alternating shear rates of 0.1 and 10 s−1 at 37°C. Reprinted with permission from ref. Copyright 2017 WILEY-VCH.
Figure 14.
Figure 14.
(A) Double cross-linked HA-az-F127 hydrogel. (b) Rheological results on (A) time sweep tests. (B) Temperature sweep tests in the temperature range of 4-60 °C at a frequency of 1 Hz, (G3 is the hydrogel with solid content of 15 wt% and the ratio of 5:5 (hydrazine to aldehyde)). (C) Viscosity as a function of shear rate. (D) G′ and G″ of Gel3 from the continuous step strain measurements (1% → 300% → 1%) under 1 Hz. (E) Photographs of self-healing process: (e1) as-formed hydrogel; (e2) two halves of the hydrogel in PTFE mold; (e3, e4) self-healed hydrogel after 30 min; (e5) stretching with forceps; and (e6) recovered shape. Reprinted with permission from ref. Copyright 2018 American Chemical Society.
Figure 15.
Figure 15.
(A) A schematic of the methodology used to form 3D-printable, doubly dynamic self-healing cryogels. The inset demonstrates the chemical structure of the cryogels and their macroporous morphology. (B) Apparent viscosity curves of oxime-based hydrogels 25°C (black squares) and 80°C (red triangles). The gel exhibits shear thinning behavior, suitable for 3D printing. (C) A stable, shape-retaining extruded filament of oxime-based hydrogels. (D) Self-healing rheology of oxime-based hydrogels. (E) 3D-printed oxime-based hydrogel scaffold after 3 cryogelation cycles at −10°C and induction of macroscopic cuts (a representative cryogel is demonstrated). (F) The damaged halves of the scaffold were brought into contact, to facilitate the healing process. (G) The damaged scaffold recovered from the cut and could be lifted as a single self-supporting unit after ~3 h. Reproduced from the licensed article of a Creative Commons Attribution 3.0 Unported License.
Figure 16.
Figure 16.
Proposed gelation mechanism for dithiolane-containing triblock copolymers in the presence of thiols. The physical cross-linking via the bridging PEG chains was shown in red. The chemical cross-linking via the thiol-initiated ring-opening polymerization of dithiolanes was shown in blue. CMC: critical micelle concentration, Nagg: aggregation number, DH: hydrodynamic diameter. Reprinted with permission from ref. Copyright 2017 American Chemical Society.
Figure 17.
Figure 17.
(A) Schematic illustration of injectable, self-healing, and multi-responsive hydrogel cross-linked by benzoxaborole-galactose complexation. (B) Chemical structures of PLDL (PLAEMA-b-PDEGMA-b-PLAEMA: poly(2-lactobioamidoethyl methacrylamide-b-di(ethylene glycol) methyl ether methacrylate-b-2-lactobioamidoethyl methacrylamide)) and PAB (P(AAm-st-MAABP): poly(acrylamide-st-5-methacrylamido-1,2-benzoxaborole)). (C) Images showing the self-healing process by reconnecting two pieces of hydrogel together. (D) Storage modulus and loss modulus value change in response to the imposed strain. (E) The corresponding strain variation: increasing first from 0.1% to 500% to break the gel and then dropping back to a small strain of 1% for gel recovery. (F) Shear-thinning property of the hydrogel. Reprinted with permission from ref. Copyright 2019 American Chemical Society.
Figure 18.
Figure 18.
(A) DNA sequence (AC)12S1 (black) is used to disperse SWCNTs. The linker DNA (green) has two regions: one complementary to S1 to hybridize with the SWCNT and one self-complementary (CG) repeat of variable length, separated by a single adenosine base. (B) Proposed structure upon gel formation, wherein (AC)12S1 helically wraps around the SWCNT while the linker DNA forms duplexes with both S1 and other linker strands, thereby providing the cross-linking mechanism. (C) Cryo-SEM of a lyophilized SWCNT-DNA gel, showing a network of SWCNTs amid aggregated buffer salts and DNA. (D) Photographs of the inverted-vial test to demonstrate the sol-gel transition (solution on left and gel on right). (E) Viscosity versus shear stress for a typical gel, compared to an ungelled sample. (F) Storage (G′) and loss (G″) moduli as a function of SWCNT concentration. Linker DNA concentration is increased in proportion to SWCNT concentration. Dashed black and red lines indicate moduli for a 5 mg mL−1 van der Waals gel. (G) Number of inter-SWCNT and intra-SWCNT cross-links in simulation, as a function of the number of SWCNTs for gel systems formed at slow and fast annealing rates. Reprinted with permission from ref. Copyright 2018 WILEY-VCH.
Figure 19.
Figure 19.
(A-C) Schematic diagrams for fabrication of the A-aGO/SA/PAAm nanocomposite hydrogel: (A) Homogeneous aqueous solution of SA, A-aGO, acrylamide (AAm), N,N’-methylene bisacrylamide (MBA), and photoinitiator. (B) Ca2+ ions inducing ionic association of SA chains. (C) UV exposure resulting in the final A-aGO/SA/PAAm nanocomposite hydrogel. (D) Apparent viscosity as a function of shear rate for the A-aGO0.2/SACa-6 and SACa-6 hydrogels as well as the SA solution without Ca2+ ions. (E) Storage modulus G′ and loss modulus G″ as a function of oscillation strain at an angular frequency of 1 Hz for the A-aGO0.2/SACa-6 and SACa-6 hydrogels as well as the SA solution without Ca2+ ions. (F) Changes of G′ and G″ with time at alternant oscillation strains of 2% and 300% and at an angular frequency of 1 Hz for the A-aGO0.2/SACa-6 hydrogel, where the red numbers represent the average modulus at the oscillation strain of 2%. (G) Hollow pentagon printed from the A-aGO0.2/SACa-6/AAm hydrogel bioinks (15 layers) viewed from the top and side. 3D printed hollow pentagon patterns from (H) the SACa-6/AAm hydrogel and (I) the GO0.2/SACa-6/AAm hydrogel inks, respectively. Reprinted with permission from ref . Copyright 2017 American Chemical Society.
Figure 20.
Figure 20.
(A) Illustration of the synthesis of nanocomposite hydrogels. (B) Demonstration of the self-healing at room temperature. (C) Dependence of moduli on strain amplitude sweep (γ = 0.1–400%) at a fixed frequency of 1 rad/s. (D) Step-strain test at a fixed frequency of 1 rad/s (1% or 400% of strain). (E) Viscosity measurement at 1% of strain. (F) Printed cone and hollow cylinder 3D patterns. All these data were obtained using the hydrogel with the ration of PDMA-stat-PAPBA (wt %) : PGMA (wt %) : rGO@PDA (wt %) : PBA/diol (molar ratio) as 5.00 : 2.50 : 0.50 : 1/2. Reprinted with permission from ref. Copyright 2019 American Chemical Society.
Figure 21.
Figure 21.
(A) Schematic synthesis of the ACC/PAA supramolecular hydrogel. (B) ACC/PAA hydrogel is stable in water. (C) ACC/PAA hydrogel is plastic, which can be made in different shapes. (D) ACC/PAA hydrogel is stretchable. (E) Self-adhesion of ACC/PAA hydrogel. Dye molecules (rhodamine B and methylene blue) were introduced to produce the colors. (F) SEM image of the freeze-dried ACC/PAA hydrogel. (G) TEM images of ACC/PAA dry gel. The insets are the corresponding electron diffraction pattern and an enlarged view of the area highlighted by the red square illustrating the presence of very small ACC nanoparticles (highlighted by green circles), (H-K) Rheological behavior of the ACC/PAA hydrogel. (H) Frequency dependencies of the storage (G’) and loss (G’’) moduli. (I) Viscosity as a function of shear rate. (J) Thixotropic loop measurement. (K) Temperature dependencies of the storage (G’) and loss (G’’) moduli. Reprinted with permission from ref. Copyright 2016 WILEY-VCH. (L) The ATR–FTIR spectra of all mineral plastics indicate the complexation between carboxylates and respective metal ions (around 1530 cm−1) and the deprotonation degree of PAA (around 1700 cm−1). (M) Separated MnCO3/PAA hydrogels in the swollen state. The dark red color results from the addition of Toluylene Red, and (N and O) upon connection, the gels heal themselves within minutes. Reprinted with permission from ref. Copyright 2018 The Royal Society of Chemistry.
Figure 22.
Figure 22.
(A) Synthesis of thermo-responsive and shear thinning bioinks from nSi and κCA. Schematic showing the dual cross-linking process of thermoreversible gelation and ionic gelation of the κCA network. Nanosilicate-stabilized cross-linked network due to physical interactions with κCA and ions to improve the mechanical stability of 3D printed anatomical-size structures. κCA undergoes thermo-reversible gelation upon heating and cooling which results in the formation of double-helical structures that can then be ionically cross-linked with the introduction of K+ ions to form a stable network. (B) Shear rate sweeps revealing the shear-thinning nature of κCA and κCA–nanosilicate bioinks. (C) Time sweep at 37°C demonstrating percent recovery of bioink’s storage modulus with the introduction of nSi. Reprinted with permission from ref. Copyright 2017 American Chemical Society. (D) The shear stress sweeps measure viscosity changes with increasing shear stress, allowing visual comparison of the yield regions of each bioink (NICE yield region shaded on graph). Shear rate sweeps illustrate the shear thinning characteristics of pre-cross-linked gels. Reprinted with permission from ref. Copyright 2018 American Chemical Society.
Figure 23.
Figure 23.
(A) Schematic representation of the design strategy for the development of multifunctional nanocomposite hydrogels. DNA–nSi injectable hydrogels are formed via a two-step gelation method. The first step consists of an intermediate weak gel (pregel) formation by heating and subsequent cooling of double-stranded DNA. The denaturation of double-stranded DNA followed by rehybridization in a random fashion facilitates the development of interconnections between adjacent DNA strands (type A network points) via complementary base pairing. Introduction of nSi in the second step of the gelation process increases the number of network points (type B) via electrostatic interaction with the DNA backbone, resulting in a shear-thinning injectable hydrogel. (B) Viscosity vs shear rate plots illustrate an increase in the viscosity due to the presence of nSi. All the formulations display the typical shearthinning behavior with a reduction in the viscosity as the shear rate increases. (C) Image showing the injection of the blue colored hydrogel through a 22G needle. (D) Frequency sweep experiments performed in the range of 0.01 to10 Hz indicate an increase in storage modulus as the concentration of nSi was increased. (E) Recovery data obtained by monitoring the storage modulus of the nanocomposite hydrogels while subjecting them to alternating high (100%) and low (1%) strain conditions. Both 0% nSi (i.e., DNA gel without nSi) and 0.5% nSi (i.e., DNA gel with 0.5% nSi) exhibited more than 95% recovery. Reprinted with permission from ref. Copyright 2018 American Chemical Society.
Figure 24.
Figure 24.
(A) Laponite was combined with PEG-D to prepare the adhesive hydrogel. (B) the hydrogel consists of a reversible interaction formed between dopamine and Laponite. (C) The hydrogel is remolded to different shapes (F; scale bars: 10 mm). (D) Normalized G’ values of D8-15/Lapo-5 (incubated for 1 day) subjected to repeated cycles of 1 and 1000% shear strain with 10 s resting time in between. Reprinted with permission from ref. Copyright 2017 WILEY-VCH.
Figure 25.
Figure 25.
(A) Structure of gold NPs and a list of co-monomers used for polymerization of hydrogels (NIPAM : N-isopropylacrylamide and BACA : N,N-bis(acryloyl)cystamine (BACA)). (B) Formation of GNP hydrogel with modified gold NPs as large cross-linker in the in situ free-radical polymerization. (C) Mechanism for dynamic and reversible RS-Au bonding with NIR laser irradiation (808 nm). (D) Optical image of the hydrogel injected using a syringe with a 20-gauge needle. (E) The self-healing procedure between two separated GNP-15 hydrogel pieces (with a gold NP concentration of 750 ppm) under an NIR laser. (F) The self-healing process between GNP-15 and GNP-0 hydrogel pieces under an NIR laser. (G) The self-healing process between GNP-0 hydrogel pieces with the aid of gold NPs under an NIR laser. Reprinted with permission from ref. Copyright 2017 Cell Press.
Figure 26.
Figure 26.
(A) Schematic for the preparation of AgNP hybrid supramolecular hydrogels. (B) Dynamic frequency sweep and (C) Shear-thinning behaviors of the Gel-0 (formed at pH 4) and AGel-1 (formed at pH 4). (D) Dynamic step-strain rheological test results of the AgNP hybrid AGel-2 (formed at pH 7). Reprinted with permission from ref. Copyright 2018 The Royal Society of Chemistry.

References

    1. Atala A; Kasper FK; Mikos AG Engineering Complex Tissues. Sci. Trans. Med. 2012, 4, 160rv112. - PubMed
    1. Arenas-Herrera JE; Ko IK; Atala A; Yoo JJ Decellularization for Whole Organ Bioengineering. Biomed. Mater 2013, 8, 014106. - PubMed
    1. Berebichez-Fridman R; Montero-Olvera PR Sources and Clinical Applications of Mesenchymal Stem Cells: State-of-the-Art Review. Sultan Qaboos Univ. Med. J 2018, 18 002. - PMC - PubMed
    1. Sachs PC; Mollica PA; Bruno RD Tissue Specific Microenvironments: A Key Tool for Tissue Engineering and Regenerative Medicine. J. Biol. Eng 2017, 11 34. - PMC - PubMed
    1. Malda J; Visser J; Melchels FP; Jüngst T; Hennink WE; Dhert WJA; Groll J; Hutmacher DW Engineering Hydrogels for Biofabrication. Adv. Mater 2013, 25, 5011–5028. - PubMed

Publication types