

Structural analysis of resting mouse platelets by 3D-EM reveals an unexpected variation in α-granule shape
- PMID: 32815431
- PMCID: PMC7895864
- DOI: 10.1080/09537104.2020.1799970
Structural analysis of resting mouse platelets by 3D-EM reveals an unexpected variation in α-granule shape
Abstract
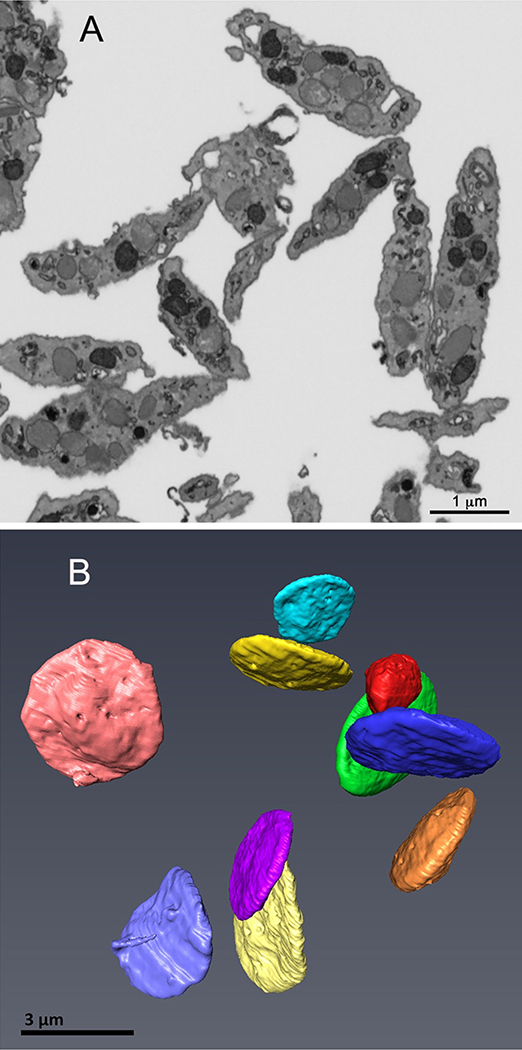
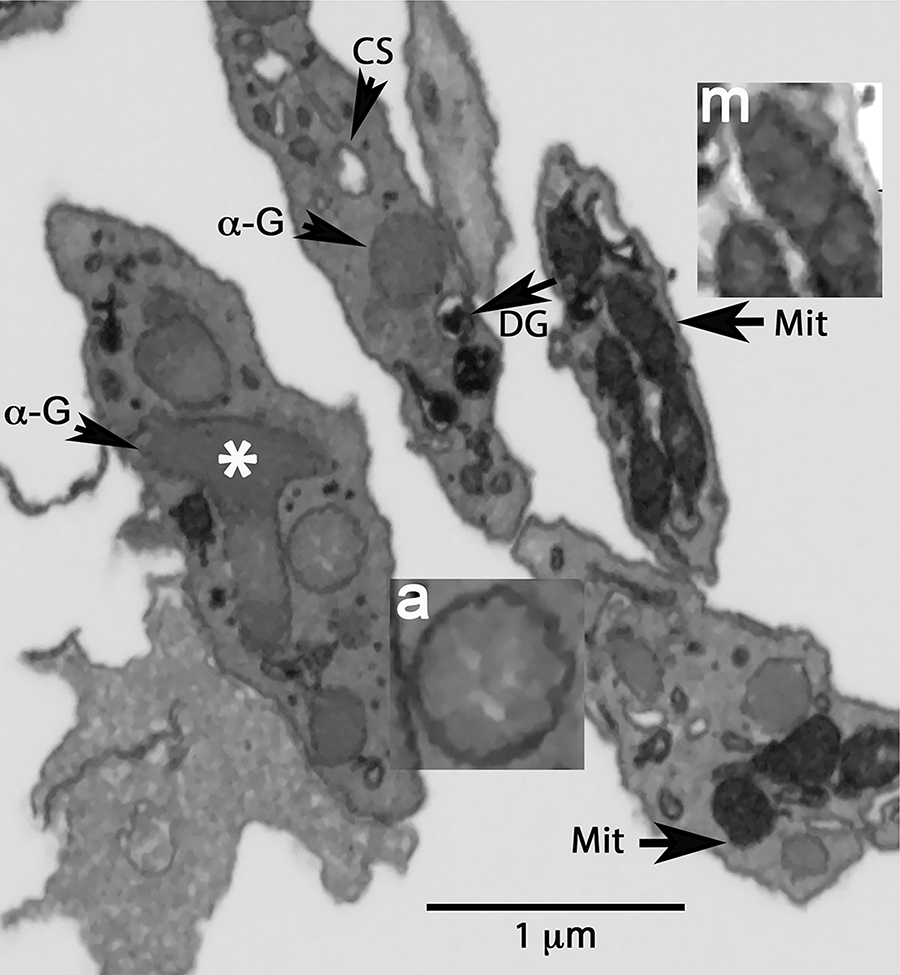
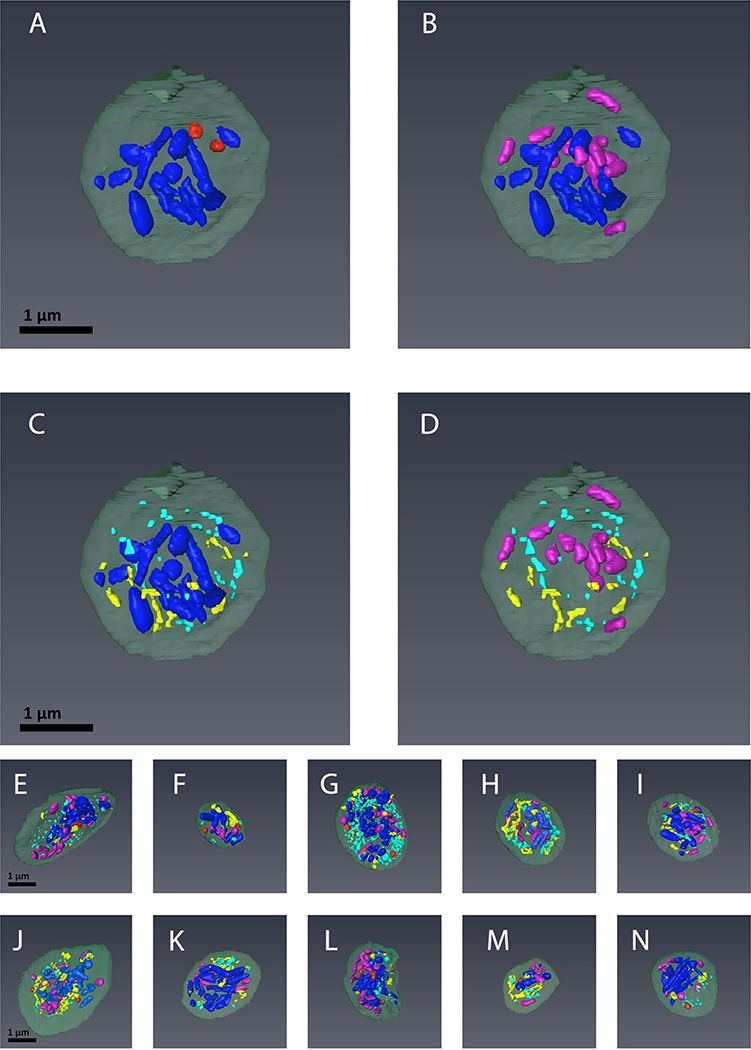
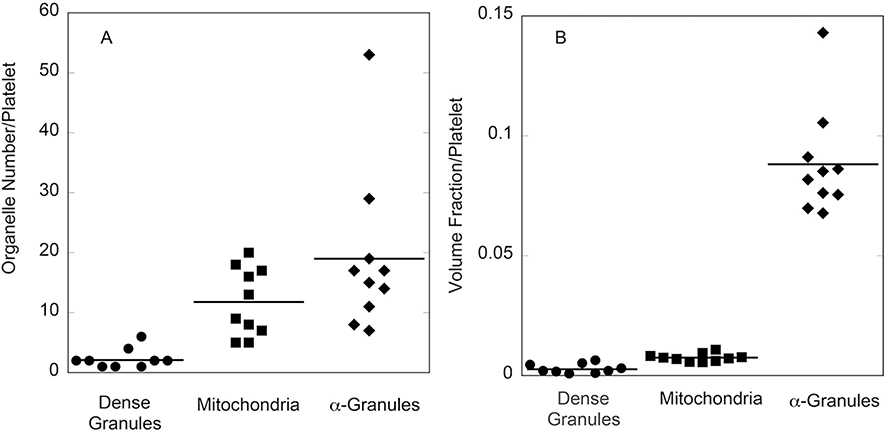
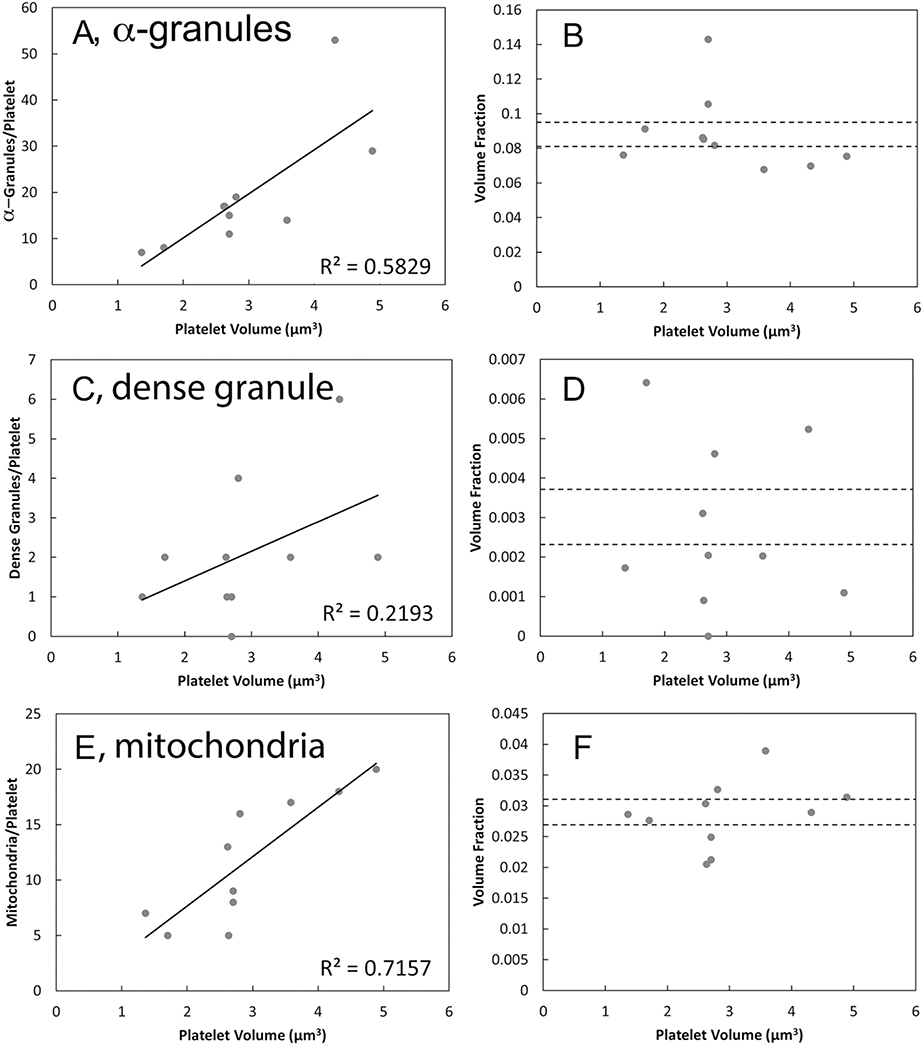
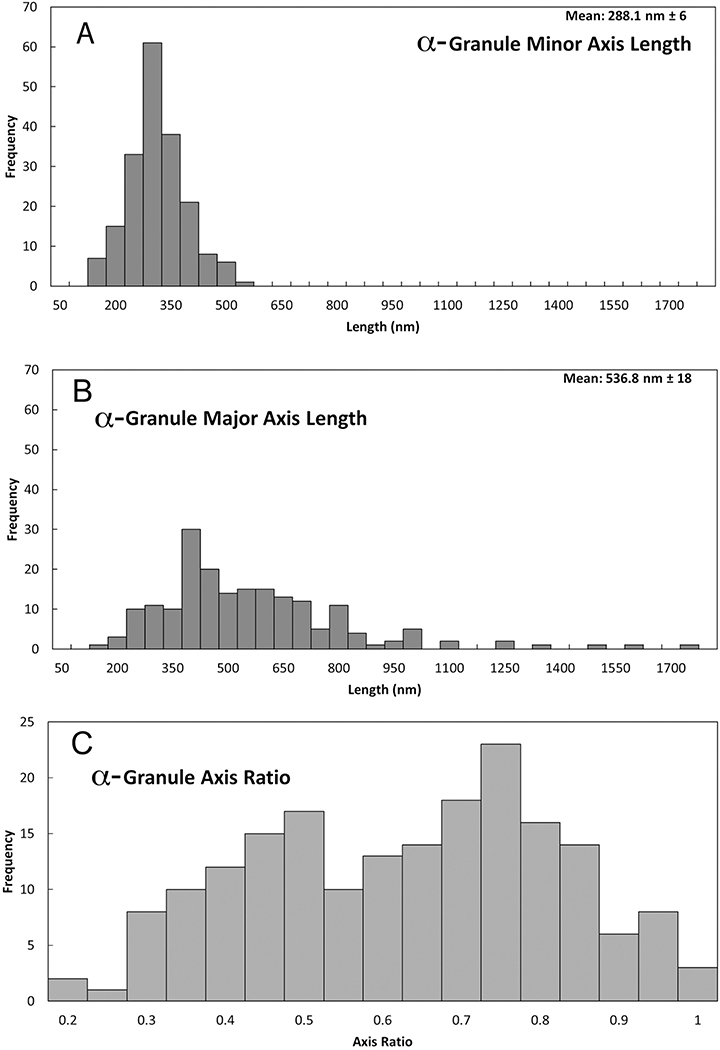
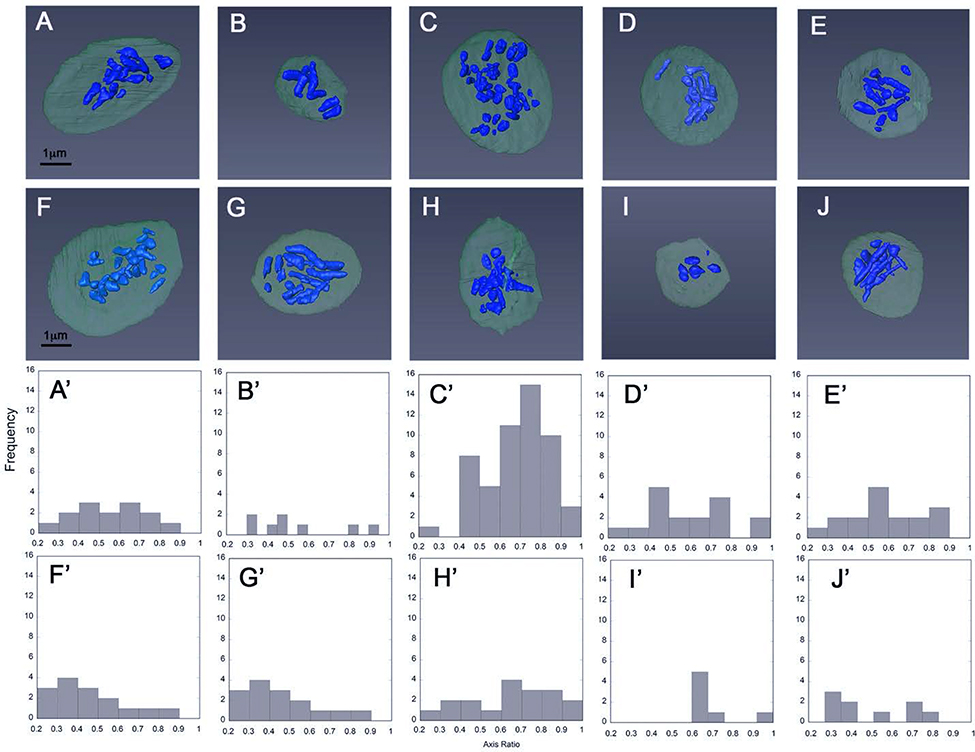
Mice and mouse platelets are major experimental models for hemostasis and thrombosis; however, important physiological data from this model has received little to no quantitative, 3D ultrastructural analysis. We used state-of-the-art, serial block imaging scanning electron microscopy (SBF-SEM, nominal Z-step size was 35 nm) to image resting platelets from C57BL/6 mice. α-Granules were identified morphologically and rendered in 3D space. The quantitative analysis revealed that mouse α-granules typically had a variable, elongated, rod shape, different from the round/ovoid shape of human α-granules. This variation in length was confirmed qualitatively by higher-resolution, focused ion beam (FIB) SEM at a nominal 5 nm Z-step size. The unexpected α-granule shape raises novel questions regarding α-granule biogenesis and dynamics. Does the variation arise at the level of the megakaryocyte and α-granule biogenesis or from differences in α-granule dynamics and organelle fusion/fission events within circulating platelets? Further quantitative analysis revealed that the two major organelles in circulating platelets, α-granules and mitochondria, displayed a stronger linear relationship between organelle number/volume and platelet size, i.e., a scaling in number and volume to platelet size, than found in human platelets suggestive of a tighter mechanistic regulation of their inclusion during platelet biogenesis. In conclusion, the overall spatial arrangement of organelles within mouse platelets was similar to that of resting human platelets, with mouse α-granules clustered closely together with little space for interdigitation of other organelles.
Keywords: 3D SBF-SEM; electron microscopy; mouse; organelles; platelets; α-granules.
Conflict of interest statement
CONFLICT OF INTEREST DISCLOSURE
The authors have no conflict of interest to declare.
Figures
Similar articles
-
3D ultrastructural analysis of α-granule, dense granule, mitochondria, and canalicular system arrangement in resting human platelets.Res Pract Thromb Haemost. 2019 Oct 25;4(1):72-85. doi: 10.1002/rth2.12260. eCollection 2020 Jan. Res Pract Thromb Haemost. 2019. PMID: 31989087 Free PMC article.
-
STEM tomography reveals that the canalicular system and α-granules remain separate compartments during early secretion stages in blood platelets.J Thromb Haemost. 2016 Mar;14(3):572-84. doi: 10.1111/jth.13225. Epub 2016 Feb 4. J Thromb Haemost. 2016. PMID: 26663480 Free PMC article.
-
Golgi proteins in circulating human platelets are distributed across non-stacked, scattered structures.Platelets. 2017 Jun;28(4):400-408. doi: 10.1080/09537104.2016.1235685. Epub 2016 Oct 18. Platelets. 2017. PMID: 27753523 Free PMC article.
-
α-granule biogenesis: from disease to discovery.Platelets. 2017 Mar;28(2):147-154. doi: 10.1080/09537104.2017.1280599. Epub 2017 Feb 22. Platelets. 2017. PMID: 28277061 Review.
-
Molecular basis of platelet granule defects.J Thromb Haemost. 2025 Feb;23(2):381-393. doi: 10.1016/j.jtha.2024.11.016. Epub 2024 Nov 29. J Thromb Haemost. 2025. PMID: 39617187 Review.
Cited by
-
Densely Populated Cell and Organelles Segmentation with U-Net Ensembles.bioRxiv [Preprint]. 2025 Jan 7:2024.11.19.623228. doi: 10.1101/2024.11.19.623228. bioRxiv. 2025. PMID: 39605330 Free PMC article. Preprint.
-
A scoping study of the whole-cell imaging literature: a foundational corpus, potential for mesoscale data synthesis, and implications for standardization of an emerging field.bioRxiv [Preprint]. 2025 Apr 5:2025.02.03.636363. doi: 10.1101/2025.02.03.636363. bioRxiv. 2025. PMID: 39975100 Free PMC article. Preprint.
-
High-Pressure Freezing Followed by Freeze Substitution: An Optimal Electron Microscope Technique to Study Golgi Apparatus Organization and Membrane Trafficking.Methods Mol Biol. 2023;2557:211-223. doi: 10.1007/978-1-0716-2639-9_13. Methods Mol Biol. 2023. PMID: 36512217 Free PMC article.
-
Platelets and (Lymph)angiogenesis.Cold Spring Harb Perspect Med. 2023 Jan 3;13(1):a041174. doi: 10.1101/cshperspect.a041174. Cold Spring Harb Perspect Med. 2023. PMID: 35534208 Free PMC article. Review.
-
Using Cryo-ET to distinguish platelets during pre-acute myeloid leukemia from steady state hematopoiesis.Commun Biol. 2022 Jan 20;5(1):72. doi: 10.1038/s42003-022-03009-4. Commun Biol. 2022. PMID: 35058565 Free PMC article.
References
-
- White JG. Electron microscopic studies of platelet secretion. Prog Hemost Thromb 1974;2:49–98. - PubMed
-
- White JG. Current concepts of platelet structure. Am J Clin Pathol 1979;71:363–378. - PubMed
-
- King SM, Reed GL. Development of platelet secretory granules. Semin Cell Dev Biol 2002;13:293–302 - PubMed
MeSH terms
Grants and funding
LinkOut - more resources
Full Text Sources