. 2020 Aug 20:9:e60408.
doi: 10.7554/eLife.60408.

3D virtual pathohistology of lung tissue from Covid-19 patients based on phase contrast X-ray tomography

Affiliations

3D virtual pathohistology of lung tissue from Covid-19 patients based on phase contrast X-ray tomography

Marina Eckermann et al. Elife. .

Abstract

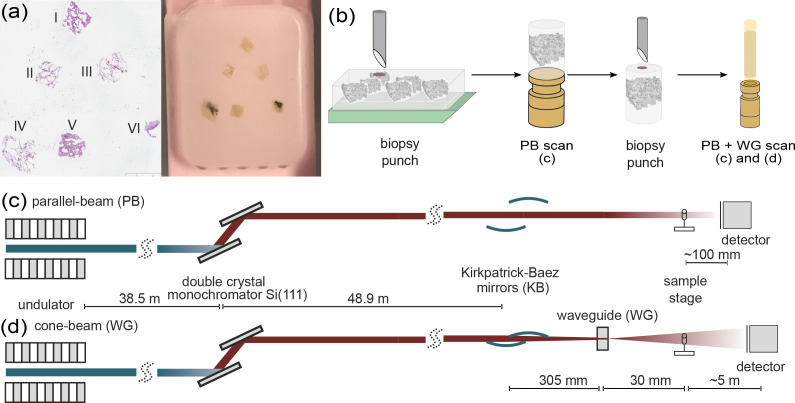
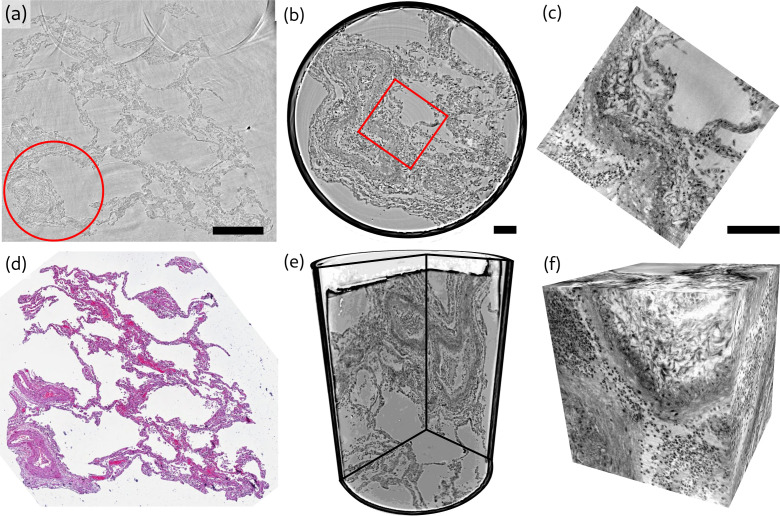
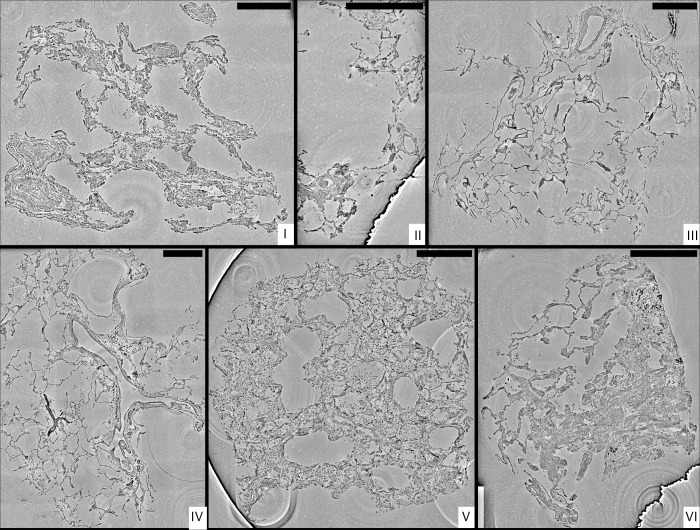
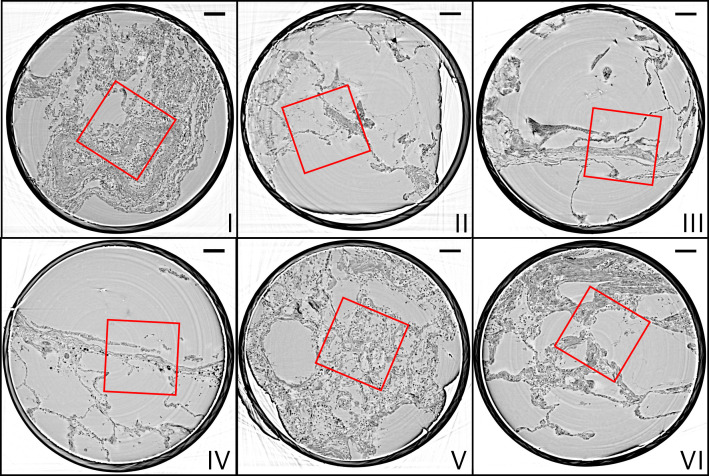
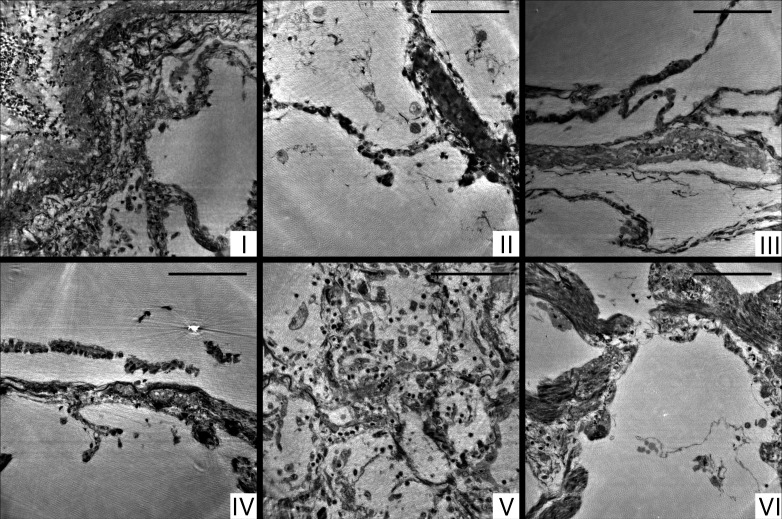
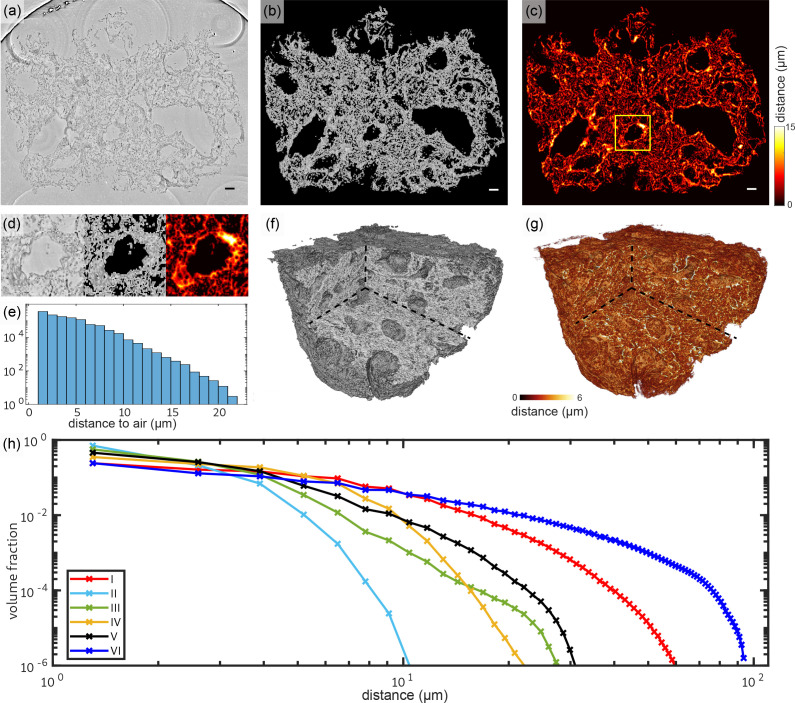
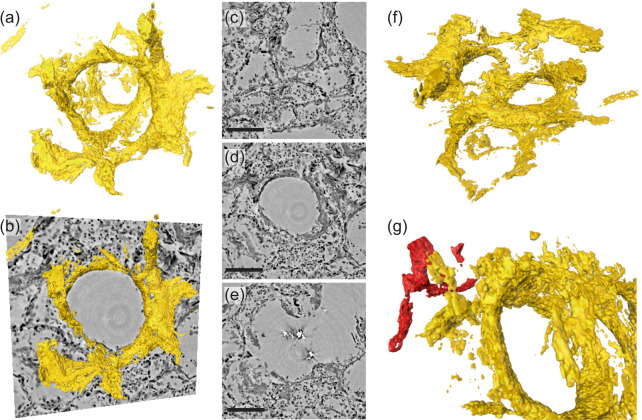
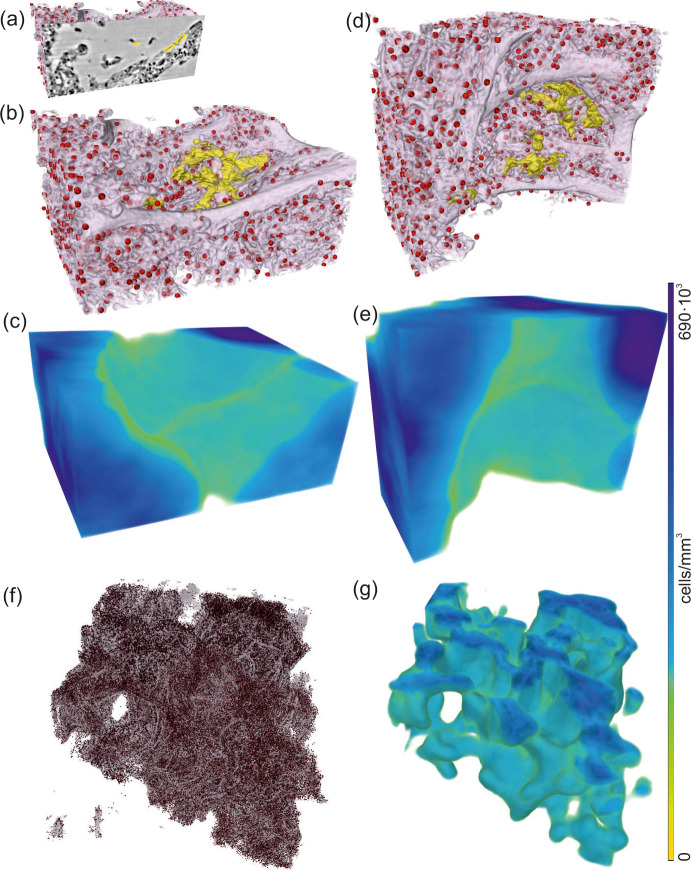
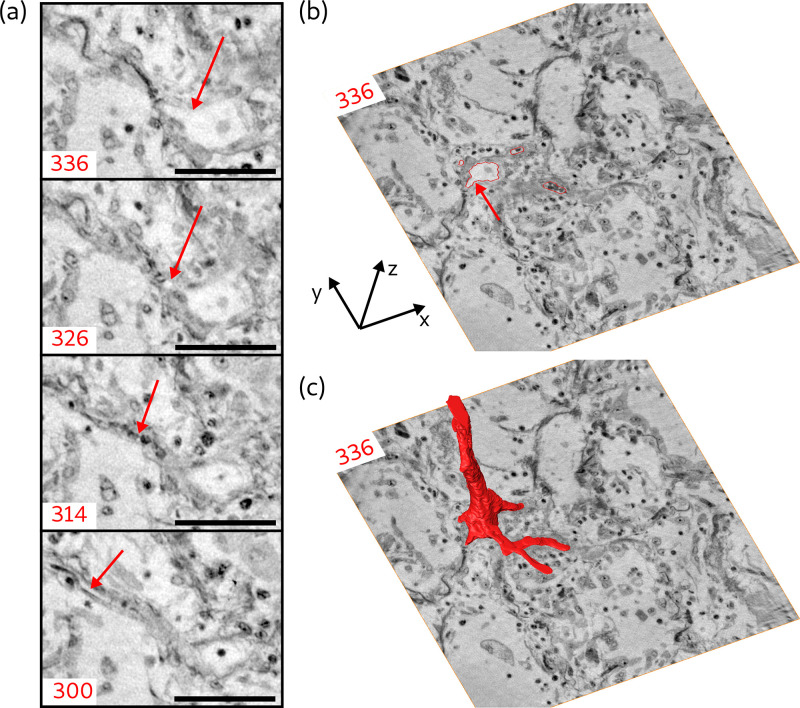
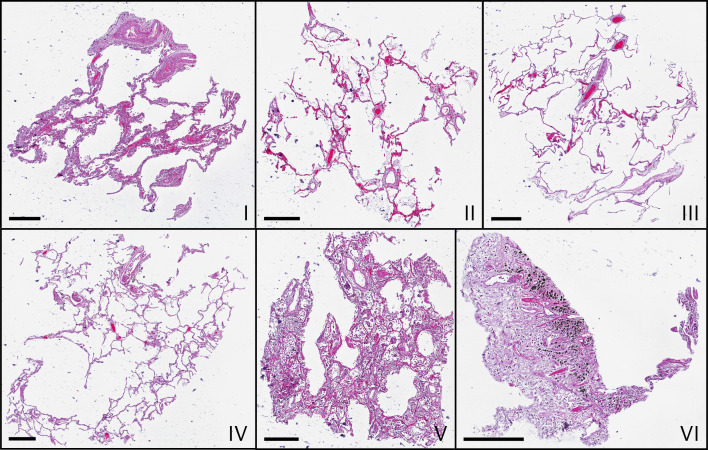
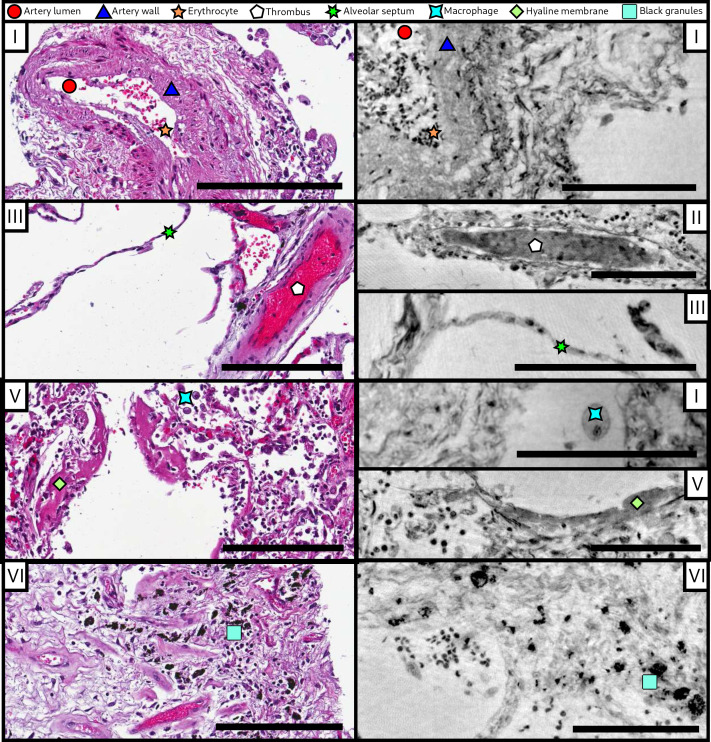
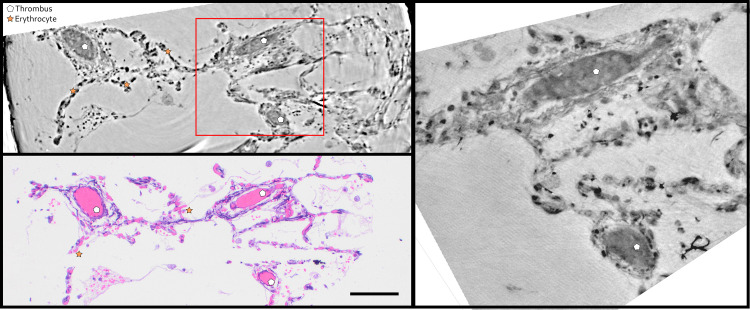
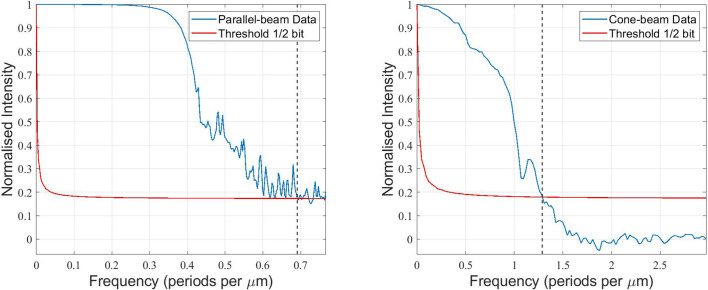
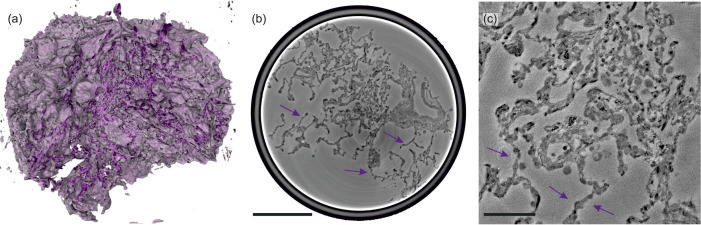
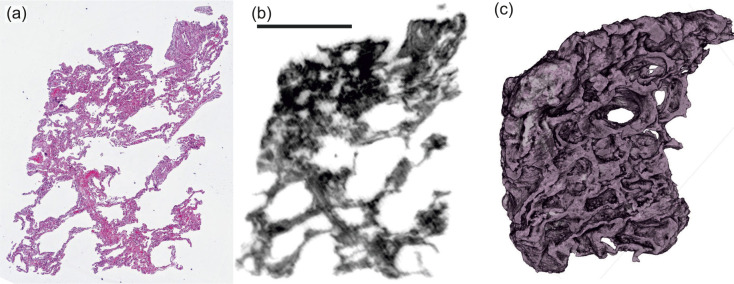
We present a three-dimensional (3D) approach for virtual histology and histopathology based on multi-scale phase contrast x-ray tomography, and use this to investigate the parenchymal architecture of unstained lung tissue from patients who succumbed to Covid-19. Based on this first proof-of-concept study, we propose multi-scale phase contrast x-ray tomography as a tool to unravel the pathophysiology of Covid-19, extending conventional histology by a third dimension and allowing for full quantification of tissue remodeling. By combining parallel and cone beam geometry, autopsy samples with a maximum cross section of 8 mm are scanned and reconstructed at a resolution and image quality, which allows for the segmentation of individual cells. Using the zoom capability of the cone beam geometry, regions-of-interest are reconstructed with a minimum voxel size of 167 nm. We exemplify the capability of this approach by 3D visualization of diffuse alveolar damage (DAD) with its prominent hyaline membrane formation, by mapping the 3D distribution and density of lymphocytes infiltrating the tissue, and by providing histograms of characteristic distances from tissue interior to the closest air compartment.

Keywords: 3d histology; Covid-19; human; immunology; inflammation; lung tissue; medicine; phase contrast; tomography; x-ray.


Conflict of interest statement

ME, JF, MR, MO, MS, FW, AT, MK, DJ, TS No competing interests declared

Figures

Figure 1.
Figure 1.. Multi-scale x-ray tomography setup.
(a) HE stain of a tissue micro-array paraffin block with samples of all six patients who succumbed to Covid-19. (b) Schematic representation of the sample preparation and mounting. In a first step biopsy punches containing the entire individual lung tissues are transferred onto a holder for the parallel-beam local tomography acquisition, followed by a further reduction in size to a 1 mm biopsy punch, for cone-beam tomographic recordings. (c) Configuration for parallel-beam tomography. (d) Configuration for cone-beam holo-tomography.
Figure 2.
Figure 2.. Overview of reconstruction volumes, exemplified for a punch biopsy of pulmonary autopsy sample I.
(a) Virtual section through the stitched reconstruction volume with indicated position for the 1 mm biopsy punch. (b) Virtual section through the reconstruction of the 1 mm biopsy punch volume with indicated position for the cone-beam dataset. (c) Virtual section through the cone beam dataset. (d) Image of an HE-stained histological section, which is in close proximity to the virtual slice in (a). (e) 3D views of the biopsy punch. (f) 3D views of the cone-beam datasets. Scale bars: (a) 500μm and (b,c) 100μm. The entire reconstruction volume is visualized in Video 1.
Figure 3.
Figure 3.. Stitched parallel-beam reconstructions for full pulmonary samples (I–VI).
Representative virtual sections through the reconstruction volumes of full biopsies (I–VI), respectively. Scale bars: 500μm.
Figure 4.
Figure 4.. Parallel-beam reconstructions for 1 mm biopsy punches (I–VI).
Representative virtual sections through the reconstruction volumes of the 1 mm punches into the volumes of the full biopsies (I–VI), respectively. The fact that the punches are isolated results in higher image quality, since the errors associated with local tomography are avoided. Scale bars: 100μm.
Figure 5.
Figure 5.. Cone-beam reconstructions for biopsy punches (I–VI), shown for approximately the same slices as in Figure 4 for the parallel beam reconstruction.
Virtual sections through the reconstruction volumes of the cone-beam recordings corresponding to sections in Figure 4, obtained by the parallel beam configuration, for biopsies (I–VI) , respectively. Scale bars: 100μm.
Figure 6.
Figure 6.. Tissue compactness and distance metrics: The 3D reconstructions of the lung tissue were analyzed in terms of specific surface and characteristic lengths.
The workflow is sketched for sample V in the top part (a–g). In a first step, the tissue was segmented using Ilastik. A slice of the reconstructed electron density is shown in (a). Based on the segmentation, the areas of air which are directly connected and potentially filled with oxygen (or blood) are masked out (b). (c) For each of the remaining tissue voxels the shortest possible distance to air was calculated. Especially around vessels and larger alveoli, the distances are larger. (d) Zoom into an area around a vessel. Further analysis is based on the distance distribution shown in (e). (f) Volume rendering of the reconstructed electron density, with (g) showing the corresponding 3D distance map. (h) Based on the tissue segmentation of all samples, the distance from the tissue interior to the closest air compartment was calculated. In order to compare all samples, the count of voxels was normalized by the total volume of the respective sample. The specific surface area SV (represented by the first value of each curve), the characteristic length Lc and the mean distance dO2¯ for each sample was calculated based on this data. Double logarithmic scale, bin width of the distribution of distances: 1 vx. Scale bars: (a–c) 100μm.
Figure 7.
Figure 7.. Rendering of hyaline membrane attached to alveolar walls (patient V, parallel beam-scan of a 1 mm punch).
The rendered subvolume was restricted to 1.15×1.10×0.56 mm3, to contain a single alveole foremost. (a) Volume rendering of the segmented hyaline membrane in same spatial orientation as (c)-(e), which show virtual slices through the (c) top, (d) center and (e) bottom of the alveole. For a better spatial classification, (b) gives a combination of the volume in (a) and the slice in (d). (f) Volume rendering of the entire subvolume including neighboring alveolae. (g) Zoom-in onto a major blood vessel (red) which is directly connected with the hyaline membrane. Scale bars: (c–e) 300μm.
Figure 8.
Figure 8.. Rendering of alveolar wall with hyaline membrane and quantification of lymphocyte infiltration (unstained tissue, patient I, parallel beam scan of a 1 mm punch).
The illustrations in (a–e) show a subvolume of 0.60×0.48×0.26 mm3, (f and g) this concept applied to the full tissue block of 2.57×2.99×0.98 mm3. (a) Yellow contours mark the locations of hyaline membrane in an exemplary slice. In same spatial orientation, (b, d and f) volume rendering of soft tissue (light pink), infiltrated by hyaline membrane (yellow) and lymphocytes (red) and (c, e and g) their local cell density among the lung tissue, including air compartments.
Figure 9.
Figure 9.. Segmentation of the blood vessel network, exemplified for biopsy (V).
(a) Series of slices in z-direction illustrate the separation of a capillary (5μm diameter) from a blood vessel. Red arrow marks the separating capillary. In slice 314, the capillary is entirely filled with erythrocytes. (b) Red lines in the entire virtual slice (336) represent the contours of a manual segmentation of the blood vessel network. Three capillaries already separated from the main vessel, while the fourth starts to emerge, indicated by the red arrow. (c) Segmentation illustrating the 3D structure of the blood vessel network. Scale bars: 50μm.
Appendix 1—figure 1.
Appendix 1—figure 1.. Microscopic images of HE-stained histological sections of all samples (I–VI).
Histological slices show comparable morphologies to the virtual slices in Figure 3, which represent different z-position. Scale bars: 400μm.
Appendix 1—figure 2.
Appendix 1—figure 2.. Comparison of morphological features between conventional HE histology and virtual histology.
Artery lumen, artery wall, erythrocytes, thrombus, alveolar septum, macrophage, hyaline membrane and anthracotic pigments (i.e. the black granules) are presented on exemplary slices of different samples (I–VI) for conventional (left) and virtual histology (right). Scale bars: left 200μm, right 100μm.
Appendix 1—figure 3.
Appendix 1—figure 3.. Direct comparison of virtual and HE histology for an identical slice/section.
(top left) Region of interest of the parallel beam tomogram (Sample II). (bottom left) Corresponding HE stained histology slice. Thrombi and erythrocytes can be identified in both imaging modalities. The red square marks the position of the zoom tomogram, for which the corresponding slice is shown on the right. Scale bars: 50μm.
Appendix 2—figure 1.
Appendix 2—figure 1.. Quantification of the 3D-resolution for the example of sample V.
FSC analysis was carried out for two independent reconstructions, each from half the projections of the scan.
Appendix 3—figure 1.
Appendix 3—figure 1.. Illustrations of control lung tissue (hydrated).
(a) Volume rendering of the tissue block (0.97×1.00×0.73 mm3) and (b) slice through the volume, examined in PB-configuration. (c) Slice from the cone-beam scan, arrows indicating the structure of a healthy septum. Particularly, macrophages and erythrocytes emerge. Scale bars: (b) 100μm and (c) 300μm.
Appendix 3—figure 2.
Appendix 3—figure 2.. Screening with a laboratory phase-contrast μCT-setup.
(UA-stained tissue block, patient I). (a) Histological and (b) correlative virtual slice from laboratory phase-contrast tomography. (c) Volume rendering of the entire tissue block from a similar perspective. Scale bar: 1 mm.

Similar articles

Cited by

References

    1. Ackermann M, Verleden SE, Kuehnel M, Haverich A, Welte T, Laenger F, Vanstapel A, Werlein C, Stark H, Tzankov A, Li WW, Li VW, Mentzer SJ, Jonigk D. Pulmonary vascular endothelialitis, thrombosis, and angiogenesis in Covid-19. New England Journal of Medicine. 2020;383:120–128. doi: 10.1056/NEJMoa2015432. - DOI - PMC - PubMed
    1. Bartels M, Hernandez VH, Krenkel M, Moser T, Salditt T. Phase contrast tomography of the mouse cochlea at Microfocus x-ray sources. Applied Physics Letters. 2013;103:083703. doi: 10.1063/1.4818737. - DOI
    1. Berg S, Kutra D, Kroeger T, Straehle CN, Kausler BX, Haubold C, Schiegg M, Ales J, Beier T, Rudy M, Eren K, Cervantes JI, Xu B, Beuttenmueller F, Wolny A, Zhang C, Koethe U, Hamprecht FA, Kreshuk A. Ilastik: interactive machine learning for (bio)image analysis. Nature Methods. 2019;16:1226–1232. doi: 10.1038/s41592-019-0582-9. - DOI - PubMed
    1. Busse M, Müller M, Kimm MA, Ferstl S, Allner S, Achterhold K, Herzen J, Pfeiffer F. Three-dimensional virtual histology enabled through cytoplasm-specific X-ray stain for microscopic and nanoscopic computed tomography. PNAS. 2018;115:2293–2298. doi: 10.1073/pnas.1720862115. - DOI - PMC - PubMed
    1. Chung M, Bernheim A, Mei X, Zhang N, Huang M, Zeng X, Cui J, Xu W, Yang Y, Fayad ZA, Jacobi A, Li K, Li S, Shan H. CT imaging features of 2019 novel coronavirus (2019-nCoV) Radiology. 2020;295:202–207. doi: 10.1148/radiol.2020200230. - DOI - PMC - PubMed

Publication types

MeSH terms