Review
. 2021 Mar;27(2):188-194.
doi: 10.5152/dir.2020.20304.

The novel coronavirus pneumonia (COVID-19): a pictorial review of chest CT features

Affiliations
Review

The novel coronavirus pneumonia (COVID-19): a pictorial review of chest CT features

Selen Bayraktaroğlu et al. Diagn Interv Radiol. 2021 Mar.

Abstract

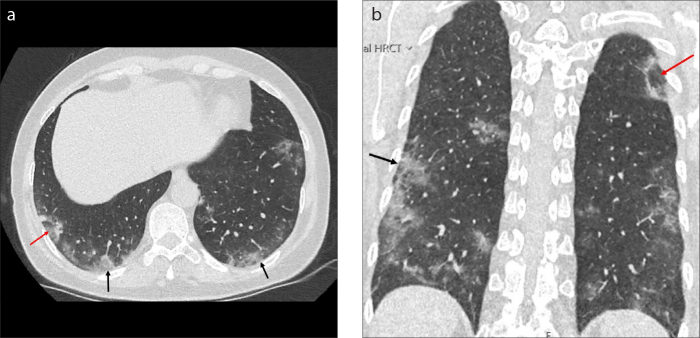
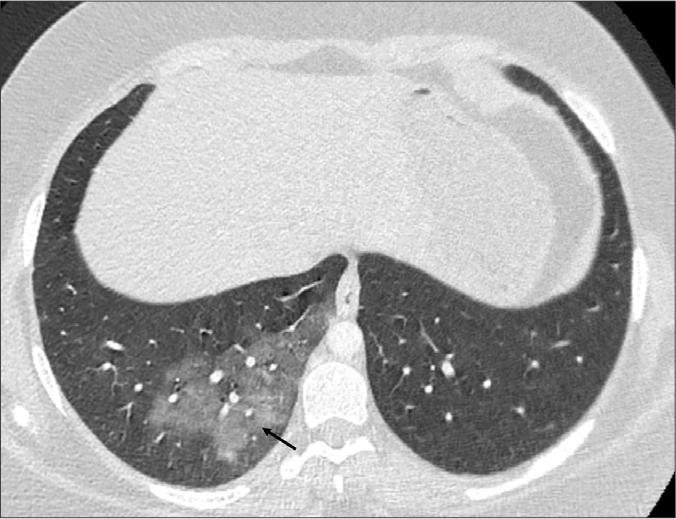
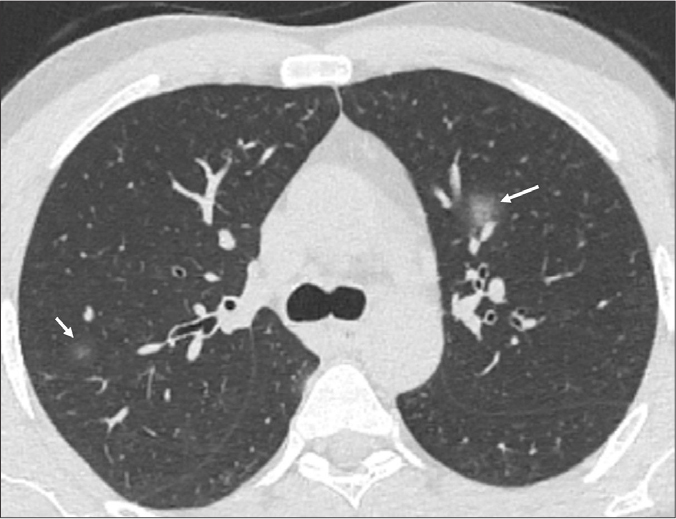
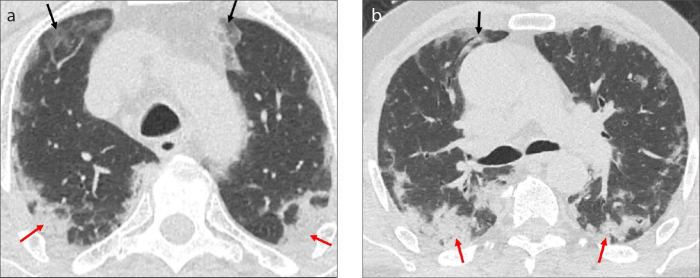
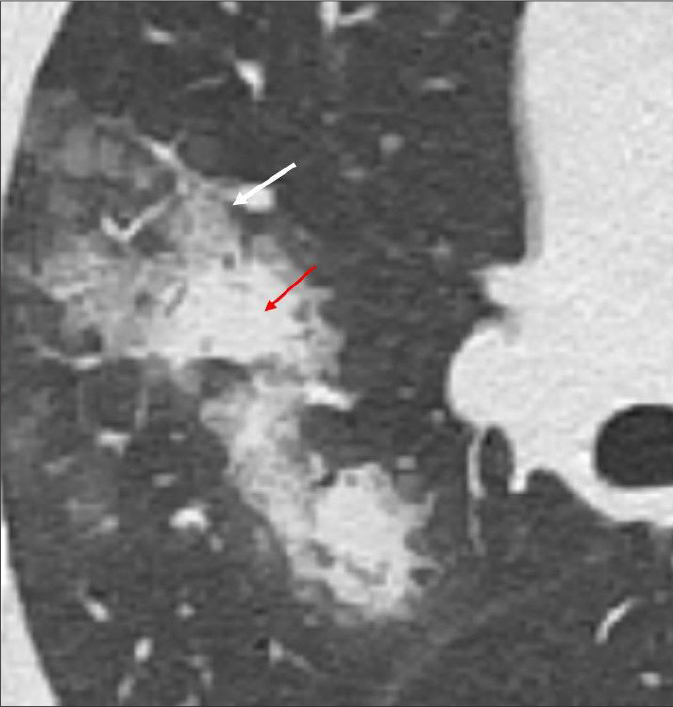
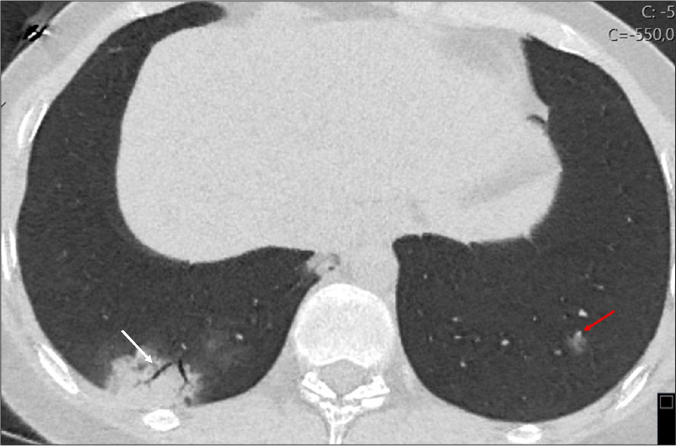
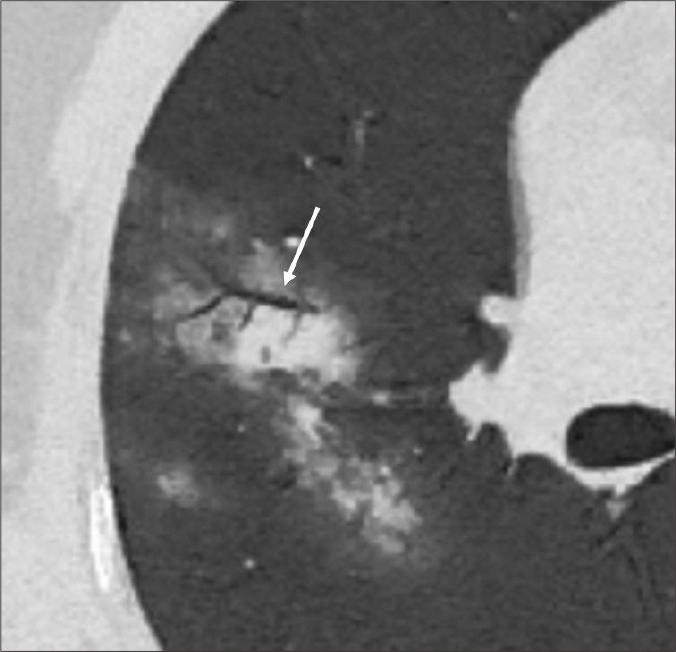
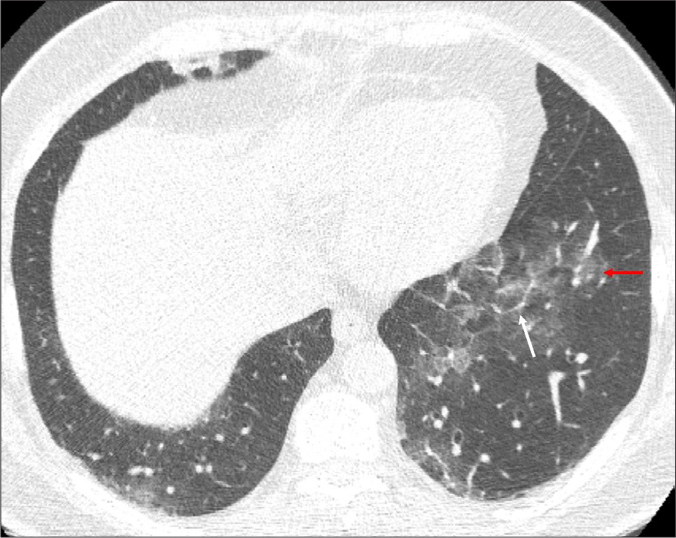
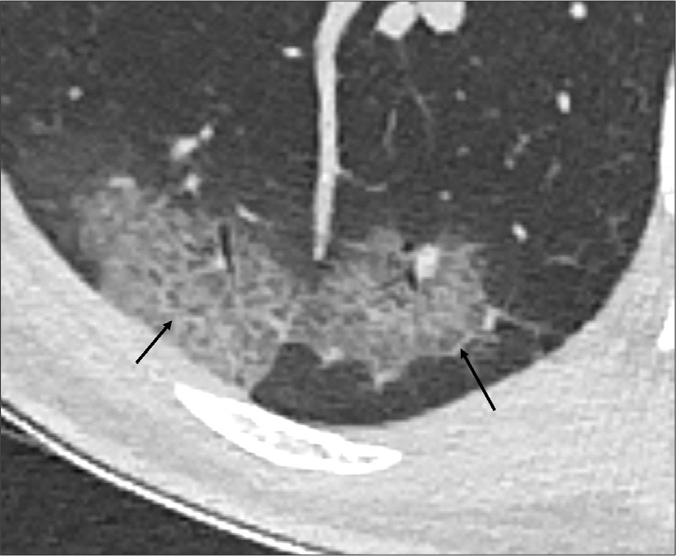
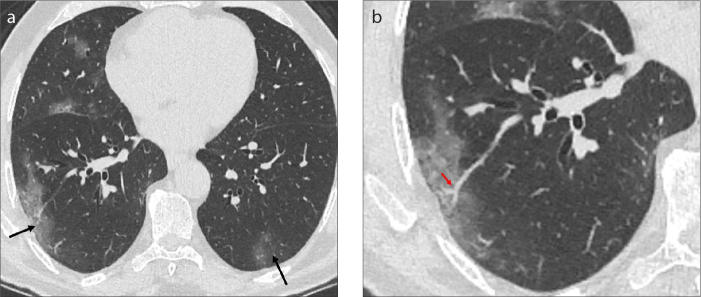
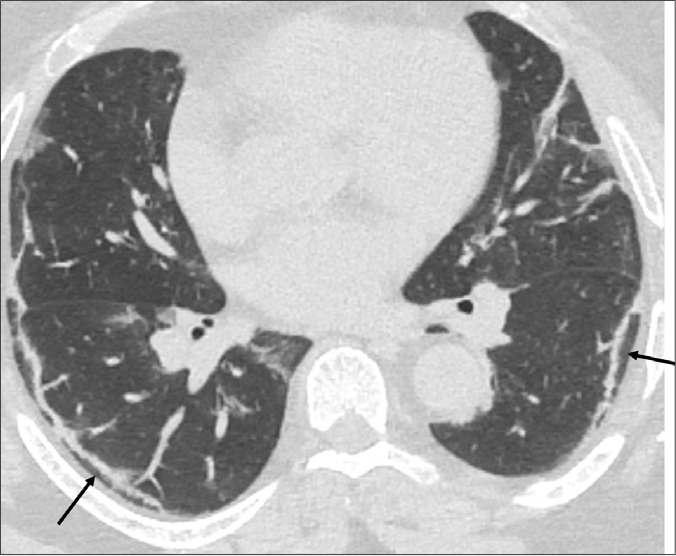
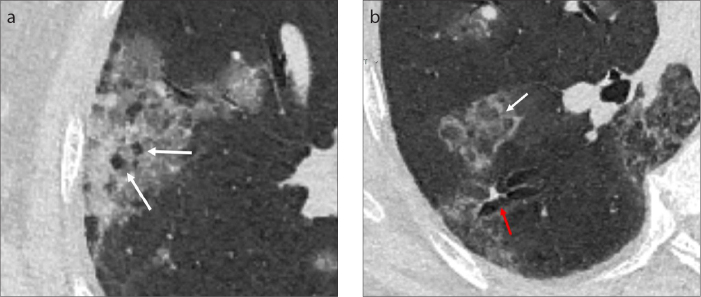
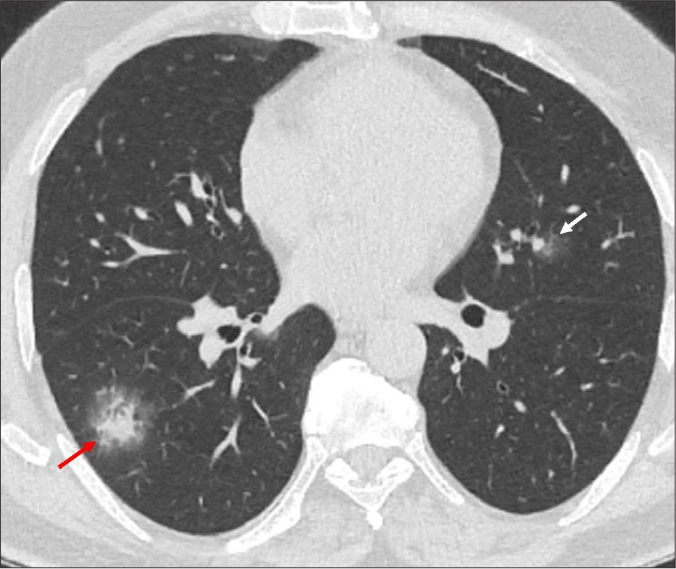
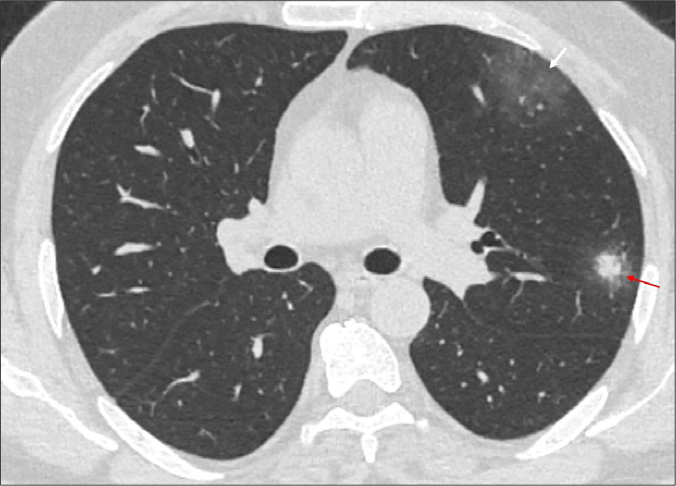
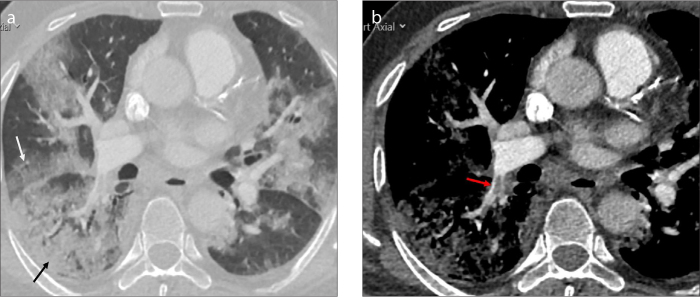
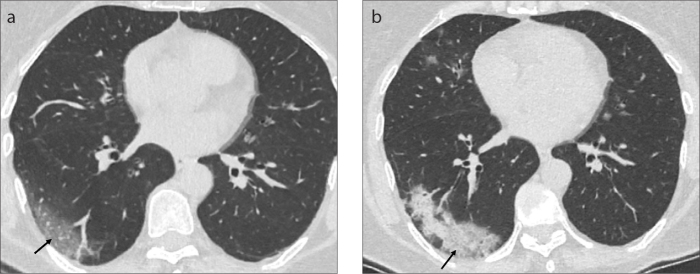
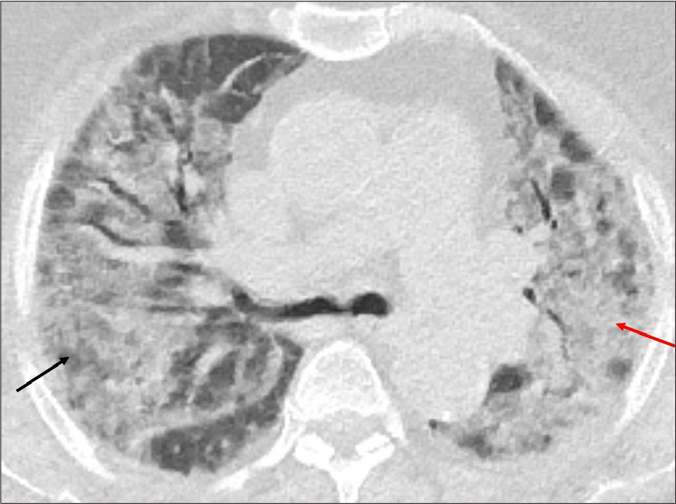
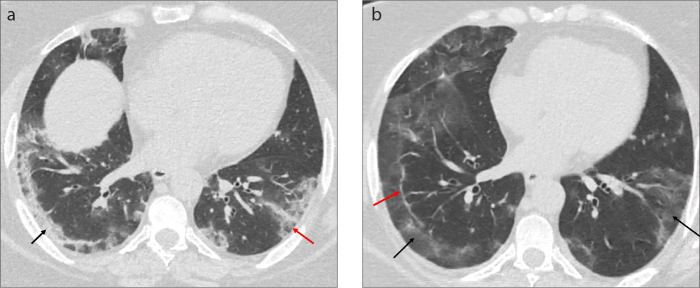
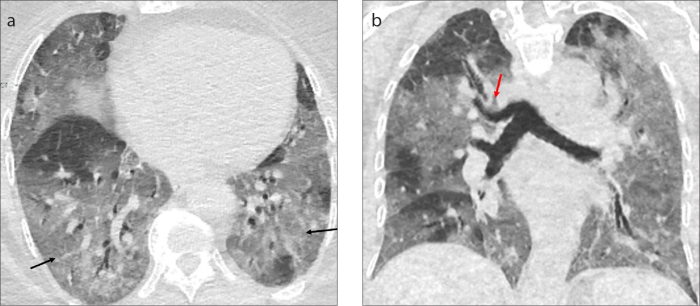
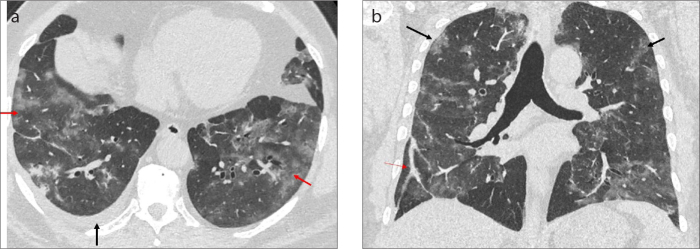
Coronavirus disease 2019 (COVID-19), caused by severe acute respiratory syndrome coronavirus 2 (SARS-CoV-2), was first reported in Wuhan, China. The infection rapidly spread to more than 200 countries around the world. The clinical presentation of the disease may vary from mild illness to severe pneumonia such as acute respiratory distress syndrome (ARDS). The chest computed tomography (CT) has an important complementary role in diagnosis of the disease. The predominant CT findings of the disease are ground glass opacities and consolidations located in subpleural areas of lower lobes. Widespread ground-glass opacities, consolidation, air bronchograms, central involvement of lung parenchyma, mediastinal lymphadenopathy are more common in patients with the severe form of the disease. CT imaging also guides in differentiation of alternative diagnosis or in assessment of associated pulmonary embolism during the course of the disease. In this pictorial review we aim to review the CT features of COVID-19 pneumonia and mention the changes throughout the disease process.


Conflict of interest statement

Conflict of interest disclosure

The authors declared no conflicts of interest.

Figures

Figure 1. a, b
Figure 1. a, b
Axial (a) and coronal (b) CT images of a 55-year-old female patient with progressive dyspnea and fever shows the peripheral distribution of ground glass opacities (GGOs, black arrows) more prominent at lower lobes. CT scans shows GGO surrounded by a rim of consolidation (the reversed halo sign) at right lower and left upper lobes (red arrows).
Figure 2
Figure 2
Contrast-enhanced axial CT image of an 18-year-old COVID-19 patient with complaints of headache, cough, and hemoptysis. The CT image shows a large peripheral GGO in the right lower lobe (black arrow).
Figure 3
Figure 3
Unenhanced axial CT image of a 40-year-old male COVID-19 patient presenting with fever and cough shows focal areas of GGOs in the form of round nodules in both upper lobes (white arrows).
Figure 4. a, b
Figure 4. a, b
Axial CT images of a 66-year-old male COVID-19 pneumonia patient presenting with fever, cough and dyspnea shows consolidation (red arrows) and GGOs (black arrows) in peripheral areas of both lungs.
Figure 5
Figure 5
Axial CT image of a 24-year-old male COVID-19 pneumonia patient shows both crazy-paving pattern (white arrow) and consolidation (red arrow) in right upper lobe.
Figure 6
Figure 6
A 21-year-old female COVID-19 pneumonia patient, presenting with cough and dyspnea. Axial minimum intensity projection (MinIP) CT image shows the peripheral consolidation in air bronchogram right lower lobe (white arrow) and focal GGO in left lower lobe (red arrow).
Figure 7
Figure 7
A 24-year-old male patient with COVID-19 pneumonia presenting with fever, headache, and diarrhea. Axial MinIP CT image shows the air filled bronchi within consolidation and GGO (air bronchogram) (white arrow).
Figure 8
Figure 8
Axial CT image of a 53-year-old male COVID-19 patient presenting with complaints of diarrhea and back pain shows GGO (red arrow) and interlobular septal thickening (white arrow) in left lower lobe.
Figure 9
Figure 9
Axial CT image of a 62-year-old male COVID-19 pneumonia patient shows GGO with thickened intralobular and interlobular septum (crazy paving appearance) (black arrows).
Figure 10. a, b
Figure 10. a, b
CT images of a 71-year-old male COVID-19 patient. Image (a) shows peripheral location of GGOs in both lower lobes (black arrow). Image (b) shows vascular enlargement seen in right lower lobe within a GGO (red arrow).
Figure 11
Figure 11
Axial CT image of 57-year-old male COVID-19 pneumonia patient presenting with cough and fever shows subpleural line extending parallel to pleura in both lower lobes (black arrows).
Figure 12. a, b
Figure 12. a, b
Axial MinIP CT images of a 40-year-old male patient with COVID pneumonia. Image (a) shows the vacuole-like focal air bubble within areas of GGO (vacuolar sign) in the right upper lobe (white arrows). Image (b) shows reticular pattern superimposed on the background of GGO at the right lower lobe (white arrows). Bronchial dilatation is seen within the GGO (red arrow).
Figure 13
Figure 13
Axial chest CT image of a 48-year-old male COVID-19 pneumonia patient with fever and dyspnea, shows a focal area of GGO in left superior lingular segment (white arrow) and solid nodular infiltration surrounded by GGO (the halo sign) in the right lower lobe (red arrow).
Figure 14
Figure 14
Axial CT image of a 48-year-old male COVID-19 pneumonia patient presenting with fever and cough shows solid nodular opacity surrounded by GGO (red arrow) in the left upper lobe anterior to major fissure and a focal area of GGO at subpleural area in the left upper lobe (white arrow).
Figure 15. a, b
Figure 15. a, b
Contrast-enhanced CT image (a) of a 69-year-old male patient with intensive care unit admission due to severe COVID-19 pneumonia, shows bilateral diffuse GGOs (white arrow) and consolidation (black arrow). Image (b) shows pulmonary embolism at right lower lobe pulmonary artery (red arrow) on mediastinal window settings.
Figure 16. a, b
Figure 16. a, b
Axial CT image (a) of a 60-year-old female COVID-19 pneumonia patient presenting with fatigue and sore throat shows peripheral GGO in subpleural area of the right lower lobe at the early stage of the disease (black arrow). The follow-up CT scan (b) is acquired 10 days after the onset of the first symptom due to clinical progression. The axial CT image, shows the evolution of GGO to consolidation pattern in the right lower lobe indicating progressive stage (black arrow).
Figure 17
Figure 17
A 78-year-old female patient with history of diabetes and chronic renal failure admitted to hospital with complaints of dyspnea and fever. The patient was diagnosed as COVID-19 pneumonia and admitted to intensive care unit due to progressive dyspnea. The axial CT image shows diffuse bilateral upper lobe involvement with GGOs (black arrow) and consolidation (red arrow). The imaging findings are consistent with severe stage of the disease.
Figure 18. a, b
Figure 18. a, b
Tha axial CT image (a) of a 47-year-old female COVID-19 pneumonia patient with cough and fever shows peripheral consolidation (black arrow) and ground glass opacities (red arrow) in both lower lobes. Follow-up CT scan (b) acquired 1 week later shows the replacement of consolidation areas with GGOs (black arrows) and the subpleural line in right lower lobe (red arrow) indicating the absorption stage.
Figure 19. a, b
Figure 19. a, b
CT images of a 79-year-old male patient with severe COVID-19 pneumonia findings. Axial CT image (a) shows the diffuse distribution of GGOs in lower lobes (black arrows). Coronal CT image (b) shows extensive GGOs in both lung fields (black arrows). Tracheal bronchus is also seen as an incidental finding (red arrow).
Figure 20. a, b
Figure 20. a, b
Axial CT image (a) of a 60-year-old male COVID-19 pneumonia patient presenting with dyspnea shows right pleural effusion (black arrow) and GGOs in bilateral lower lobes (red arrows). Coronal CT image (b) shows the extension of GGOs to upper lobes (black arrows) and subpleural line (red arrow) at the right lower lobe.

References

    1. World Health Organization. Coronavirus disease 2019 (COVID-19) situation report-51. World Health Organization; Geneva: 2020. Available at: https://www.who.int/docs/default-source/coronaviruse/situa-tionreports/2....
    1. World Health Organization. Coronavirus disease 2019 (COVID-19) situation report-94. World Health Organization; Geneva: 2020. Available at: https://www.who.int/docs/default-source/coronaviruse/situation-reports/2....
    1. Shi H, Han X, Jiang N, et al. Radiological findings from 81 patients with COVID-19 pneumonia in Wuhan, China: a descriptive study. Lancet Infect Dis. 2020;20:425–434. doi: 10.1016/S1473-3099(20)30086-4. - DOI - PMC - PubMed
    1. Zhao W, Zhong Z, Xie X, Yu Q, Liu J. Relation between chest CT findings and clinical conditions of coronavirus disease (COVID-19) pneumonia: a multicenter study. AJR Am J Roentgenol. 2020;214:1072–1077. doi: 10.2214/AJR.20.22976. - DOI - PubMed
    1. Bernheim A, Mei X, Huang M, et al. Chest CT findings in coronavirus disease-19 (COVID-19): relationship to duration of infection. Radiology. 2020;295:200463. doi: 10.1148/radiol.2020200463. - DOI - PMC - PubMed