. 2020 Aug 20;13(1):58.
doi: 10.1186/s12284-020-00417-0.

Natural Diversity in Stomatal Features of Cultivated and Wild Oryza Species

Affiliations

Natural Diversity in Stomatal Features of Cultivated and Wild Oryza Species

Jolly Chatterjee et al. Rice (N Y). .

Abstract

Background: Stomata in rice control a number of physiological processes by regulating gas and water exchange between the atmosphere and plant tissues. The impact of the structural diversity of these micropores on its conductance level is an important area to explore before introducing stomatal traits into any breeding program in order to increase photosynthesis and crop yield. Therefore, an intensive measurement of structural components of stomatal complex (SC) of twenty three Oryza species spanning the primary, secondary and tertiary gene pools of rice has been conducted.

Results: Extensive diversity was found in stomatal number and size in different Oryza species and Oryza complexes. Interestingly, the dynamics of stomatal traits in Oryza family varies differently within different Oryza genetic complexes. Example, the Sativa complex exhibits the greatest diversity in stomatal number, while the Officinalis complex is more diverse for its stomatal size. Combining the structural information with the Oryza phylogeny revealed that speciation has tended towards increasing stomatal density rather than stomatal size in rice family. Thus, the most recent species (i.e. the domesticated rice) eventually has developed smaller yet numerous stomata. Along with this, speciation has also resulted in a steady increase in stomatal conductance (anatomical, gmax) in different Oryza species. These two results unambiguously prove that increasing stomatal number (which results in stomatal size reduction) has increased the stomatal conductance in rice. Correlations of structural traits with the anatomical conductance, leaf carbon isotope discrimination (∆13C) and major leaf morphological and anatomical traits provide strong supports to untangle the ever mysterious dependencies of these traits in rice. The result displayed an expected negative correlation in the number and size of stomata; and positive correlations among the stomatal length, width and area with guard cell length, width on both abaxial and adaxial leaf surfaces. In addition, gmax is found to be positively correlated with stomatal number and guard cell length. The ∆13C values of rice species showed a positive correlation with stomatal number, which suggest an increased water loss with increased stomatal number. Interestingly, in contrast, the ∆13C consistently shows a negative relationship with stomatal and guard cell size, which suggests that the water loss is less when the stomata are larger. Therefore, we hypothesize that increasing stomatal size, instead of numbers, is a better approach for breeding programs in order to minimize the water loss through stomata in rice.

Conclusion: Current paper generates useful data on stomatal profile of wild rice that is hitherto unknown for the rice science community. It has been proved here that the speciation has resulted in an increased stomatal number accompanied by size reduction during Oryza's evolutionary course; this has resulted in an increased gmax but reduced water use efficiency. Although may not be the sole driver of water use efficiency in rice, our data suggests that stomata are a potential target for modifying the currently low water use efficiency in domesticated rice. It is proposed that Oryza barthii can be used in traditional breeding programs in enhancing the stomatal size of elite rice cultivars.

Keywords: Maximum stomatal conductance (anatomical); Oryza; Stomatal diversity; Wild rice; gmax.


Conflict of interest statement

The authors declare that they have no competing interests.

Figures

Fig. 1
Fig. 1
Schematic representation of a pair of rice stomatal complex (SC), accompanied with guard cells (GC), subsidiary calls (SB); and epidermal cells (EP). The diamond shaped SC is structured by two long guard cells, two adjacent subsidiary cells. These are separated by files of epidermal cells. The diagram shows the length (L, the longer diameter of the stomata) and the width (W, the shorter diameter of the stomata) of SC and closed GC pair. GCL and GCW are used to calculate the stomatal pore length (ρ) and depth (l). π is the mathematical constant which is 3.14. Pore length, pore depth and amax is calculated according to equation of Franks and Farquhar , . Counting of stomata and physical measurements of all the dimensions and area of SC and GC were performed using Image J image processing software. The long axis of the stoma lies parallel to the leaf lateral axis
Fig. 2
Fig. 2
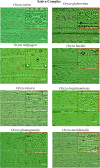
Stomatal diversity in Oryza “Sativa Complex”. Files of stomata are arranged in parallel on the surface along the length of the leaf. Some of the stomatal complexes are shown by red arrows. Scale bar is 50.0 μm. The images are captured from the abaxial epidermal layers after scraping of leaf tissues, under 40x magnification with 10x eyepiece of a BX51 light microscope (Olympus). The oval shapes are the marks of trichomes on the leaf. Difference in number and size in stomata is very prominent in the species. Note the larger stomata of O. glaberrima, O. barthii and smaller stomata of O. nivara and O. meridionalis as compared to Oryza sativa. Red lined boxes are the zoomed part of the leaves showing stomatal features
Fig. 3
Fig. 3
Stomatal diversity in Oryza “Officinalis Complex”. The images are captured from the abaxial epidermal layers after scraping of leaf tissues, captured under 40x magnification with 10x eyepiece using BX51 (Olympus). The oval shapes are the marks of trichomes on the leaf. The Officinalis complex varies more in terms of the size of stomata than the number of stomata. Some of the stomata are marked by red arrows. Scale bar is 50.00 μm. Red lined boxes are the zoomed part of the leaves showing stomatal features
Fig. 4
Fig. 4
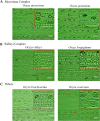
Stomatal diversity in M-R-O, i.e., Meyeriana (a), Ridleyi (b) and Other (c) complexes. Stomata are much smaller in O. meyeriana, O. granulata and O. brachyantha; and significantly larger in O. ridleyi, O. longiglumis and O. coarctata as compared to O. sativa (Fig. 2). Some of the stomata are marked by red arrows. Scale bar is 50.00 μm. Red lined boxes are the zoomed part of the leaves showing stomatal features
Fig. 5
Fig. 5
Box plots show number and structural diversity of stomatal complex in Oryza; Sativa, Officinalis and M-R-O (Meyeriana, Ridleyi and Others) complexes. A detailed value for each species, and range of diversity for each complex are given in Table S1 and in Table S2. Boxes shows 25th to 75th percentile, horizontal line represents the median and whiskers indicate the minimum and maximum values. Different letters represent significant difference in different complexes for the concerned trait (at P < 0.05). The values on the adaxial leaf side are of excluding O. coarctata. Sativa complex contains eight, Officinalis complex contains nine, and Meyeriana, Ridleyi and Others (M-R-O) together contains six Oryza species. Stomatal number is counted from 15 random images taken from the middle portion of the leaf from 3 leaves per species. SCL, SCW, SCA are measured from 25 random stomatal images for each species
Fig. 6
Fig. 6
Box plots represent the diversity in guard cell size in Oryza; Sativa, Officinalis and M-R-O (Meyeriana, Ridleyi and Others) complexes. A detailed value scored for each species, and range of diversity for each complex is given in Table S3 and in Table S4. GCL, GCW were measured from 25 random stomatal images for each species. Boxes shows 25th to 75th percentile, horizontal line represents the median and whiskers indicate the minimum and maximum values. Different letters represent significant difference in different complexes for the trait (at P < 0.05). The values on the adaxial leaf side are of excluding O. coarctata. Sativa complex contains eight, Officinalis complex contains nine, and M-R-O contains six Oryza species
Fig. 7
Fig. 7
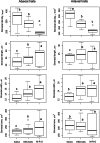
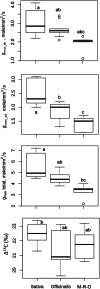
Box plots represent the diversity of stomatal maximum anatomical conductance to water vapor through abaxial and adaxial leaf surface, total conductance and carbon isotopic discrimination property of different Oryza complexes; Sativa, Officinalis and M-R-O (Meyeriana, Ridleyi and Others). The values of these traits for each species, and range of diversity for each complex is given in Table S5 and in Table S6. Boxes shows 25th to 75th percentile, horizontal line represents the median and whiskers indicate the minimum and maximum values. Different letters represent significant difference in gmax_ab (at P < 0.05), gmax_ad (at P < 0.001) and gmax_total (at P < 0.01). The values on the adaxial leaf side are of excluding O. coarctata. Sativa complex contains eight, Officinalis complex contains Nine, and M-R-O contains six Oryza species. Δ13C values are obtained from 3 replications for each species. Δ13C values differ significantly (at P < 0.05) among Oryza complexes
Fig. 8
Fig. 8
Pearson product-moment correlation values matrix of stomatal and leaf traits. Upper diagonal represents the non- corrected r values, whereas the lower diagonal represents the phylogenetically corrected r values. Cells are colour coded in shades of blue to red for negative and positive correlations respectively. Significant (P < 0.05) correlation r values are mentioned in “bold”. Post-correction new significant r values are bordered with black line. 1st green lined box (from the top) shows interactions among structural components of stomatal complex, 2nd green lined box shows the interactions of GC and accessory cells to SC. 3rd green lined box shows the interactions of vein and leaf related traits to SC and GC, 4th green lined box shows interactions of stomatal functional traits to SC, GC and others
Fig. 9
Fig. 9
Number of positive (a) and negative (b) correlations between stomatal structural traits. Significant correlation values (r) are marked with * (at P < 0.05). n = 22
Fig. 10
Fig. 10
Positive interactions of stomatal density and stomatal distance with gmax (a), and interactions of stomatal density, stomatal area and GC width with ΔC13 (b). Significant correlation values (r) are marked with * (at P < 0.05). n = 22

References

    1. Bergmann DC, Sack FD. Stomatal development. Annu Rev Plant Biol. 2007;58:163–181. - PubMed
    1. Brodribb T, Jordan GJ, Carpenter RJ. Unified changes in cell size permit coordinated leaf evolution. New Phytol. 2013;199:559–570. - PubMed
    1. Caine RS, Yin X, Sloan J, Harrison EL, Mohammed U, Fulton T, Biswal AK, Dionora J, Chater CC, Coe RA, Bandyopadhyay A, Murchie EH, Swarup R, Quick WP, Gray JE. Rice with reduced stomatal density conserves water and has improved drought tolerance under future climate conditions. New Phytol. 2018;221:371–384. - PMC - PubMed
    1. Chatterjee J, Dionora J, Elmido-Mabilangan A, Wanchana S, Thakur V, Bandyopadhyay A, et al. The evolutionary basis of naturally diverse Rice leaves anatomy. PLoS One. 2016;11(10):e0164532. - PMC - PubMed
    1. Chen WF, Xu ZJ, Zhang LB, Yang SR. Comparative studies on stomatal density and its relations to gas diffusion resistance and net photosynthetic rate in rice leaf. Chinese J Rice Sci. 1990;4:63–168.