. 2020 Oct;111(10):3527-3539.
doi: 10.1111/cas.14624. Epub 2020 Sep 1.

Immunogenic chemotherapy in two mouse colon cancer models

Affiliations

Immunogenic chemotherapy in two mouse colon cancer models

Takahito Taniura et al. Cancer Sci. 2020 Oct.

Abstract

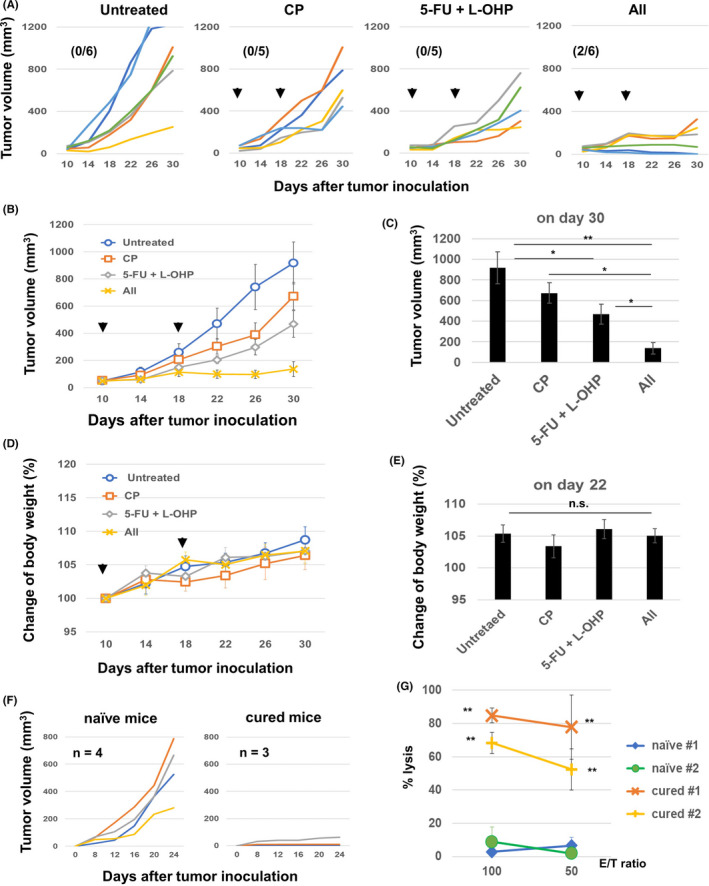
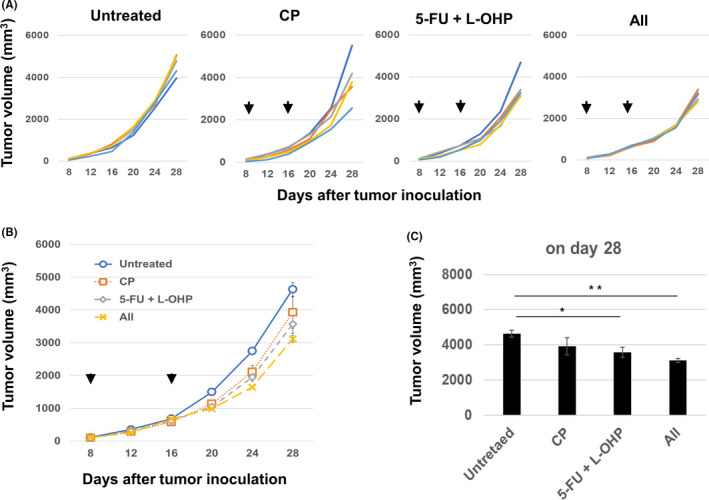
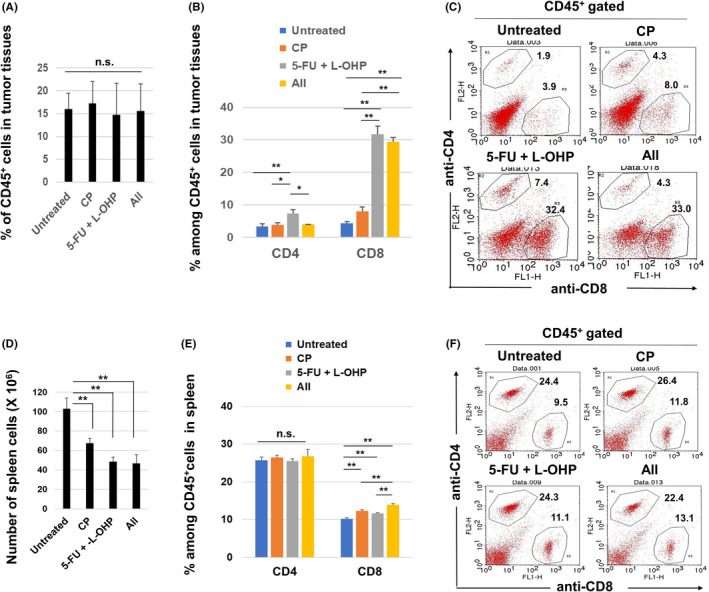
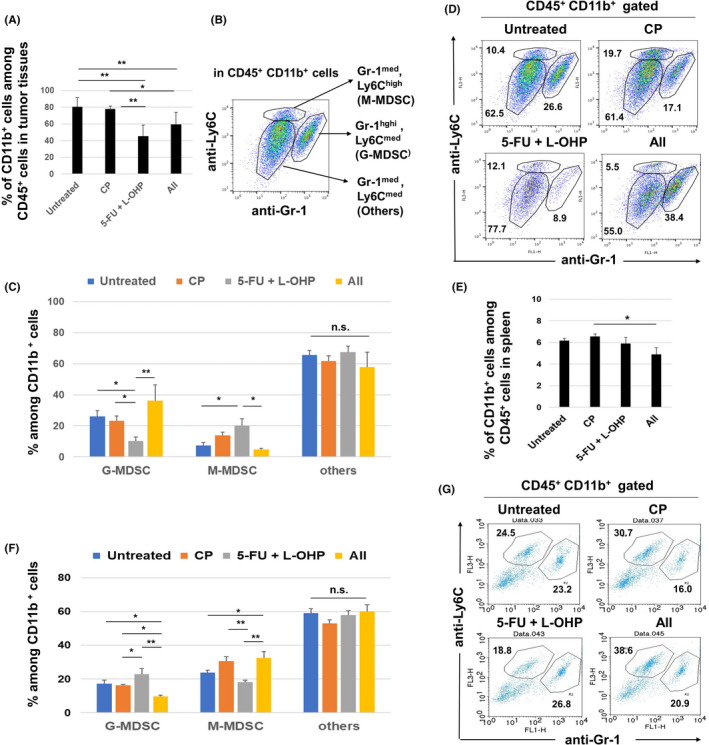
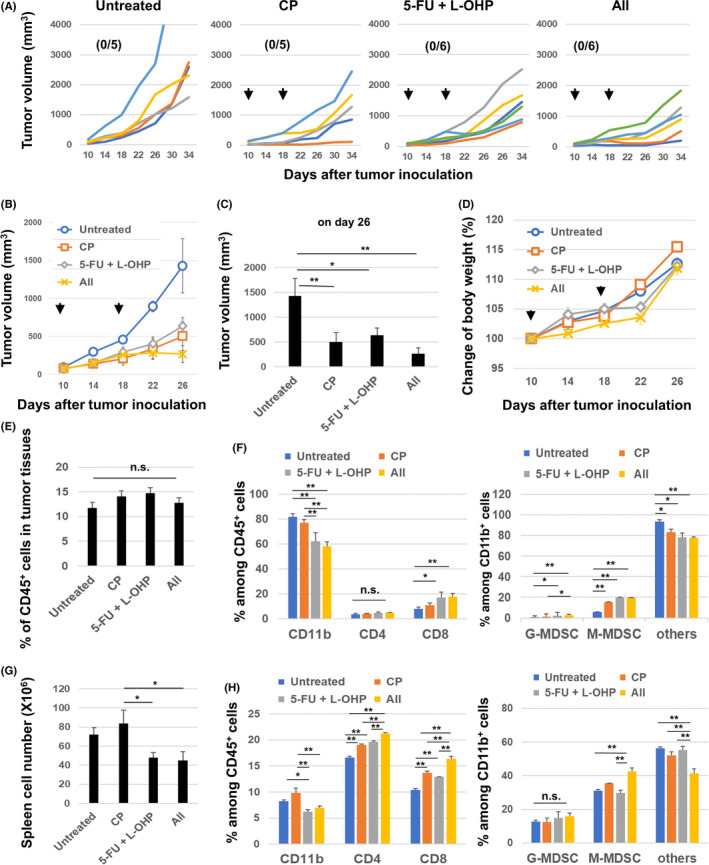
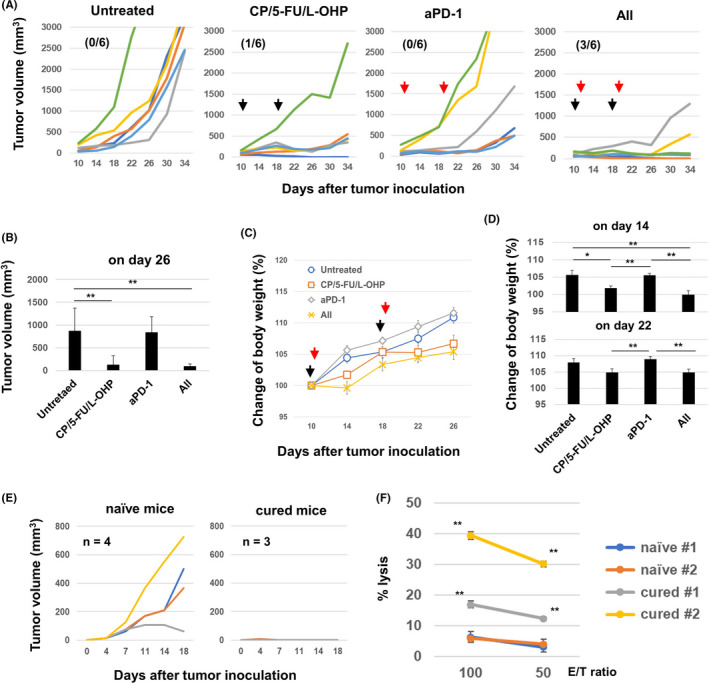
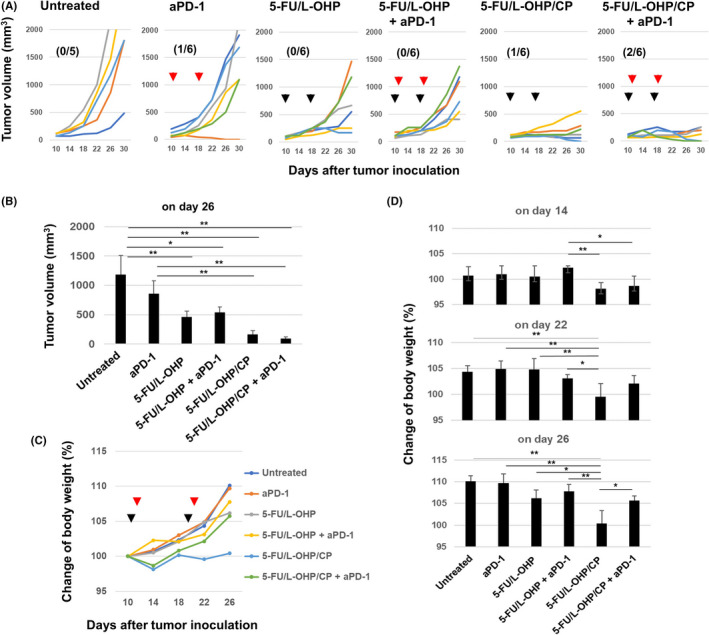
Aside from the induction of cell death, some anticancer chemotherapeutic drugs can modulate antitumor immune responses. In this study, we examined the anticancer effects of 5-fluorouracil (5-FU) and oxaliplatin (L-OHP), which are standard chemotherapeutic drugs for colon cancer, combined with cyclophosphamide (CP) in two mouse colon cancer models (CT26 and MC38 colon adenocarcinoma models). In the CT26 model, two injections of 5-FU/L-OHP and CP significantly suppressed the growth of subcutaneously established CT26 tumors compared with either 5-FU/L-OHP or CP, without a significant loss of body weight. The anticancer effect was weakened in nude mice. Cured mice acquired protective immunity against CT26, and CT26-specific cytotoxic T cells (CTLs) were induced from their spleen cells. Analysis of tumor-infiltrating immune cells revealed that 5-FU/L-OHP treatment with or without CP increased the proportion of CD8+ T cells at tumor sites. The 5-FU/L-OHP treatment decreased the proportion of granulocytic myeloid-derived suppressor cells (MDSCs) and increased monocytic MDSCs in tumor sites, whereas the addition of CP treatment reversed these changes. In the MC38 model, although significant anticancer effects of the triple combination therapy were seen, additional treatment with anti-PD-1 antibody increased the number of cured mice. These mice exhibited protective immunity against MC38, and MC38-specific CTLs were generated from their spleen cells. Together, these results indicate that the antitumor effects of the combination of 5-FU/L-OHP and CP mainly depend on host T cells; moreover, the therapeutic efficacy can be effectively boosted by immune checkpoint blockade.

Keywords: anti-PD-1 antibody; chemotherapy; colon cancer; cytotoxic T lymphocytes; immunotherapy.


Conflict of interest statement

The authors have no conflict of interest.

Figures

Figure 1
Figure 1
In vivo antitumor effects of the combination of chemotherapeutic drugs. A and B, BALB/c mice were injected subcutaneously (s.c.) with 5.0 × 105 CT26 cells into the right flank. On days 10 and 18, these mice were injected intraperitoneally with CP (50 mg/kg) and/or 5‐FU (50 mg/kg) and L‐OHP (6 mg/kg). The tumor volume was calculated as follows: (length × width2)/2. The arrows indicate the drug injection times. The data are presented as means ± SEM. The number in parentheses represents the ratio of cured mice to total mice. C, Tumor volume on day 30. *P < 0.05, **P < 0.01 (ANOVA). D and E, Similarly, the body weight was measured, and the tumor size data on day 22 are shown as means ± SEM. F, The cured BALB/c mice were inoculated s.c. with 5.0 × 105 CT26 cells 3 months after the last therapy (n = 3). Naïve mice were also inoculated with CT26 cells (n = 4). G, The spleen cells from cured and naïve mice were harvested and cultured with the AH1 peptide in the presence of IL‐2 (20 U/mL) for 4 days. The cytotoxicity of the cultured cells against CT26 cells was examined using a 5‐h 51Cr‐release assay. CP, cyclophosphamide; 5‐FU, 5‐fluorouracil; L‐OHP, oxaliplatin; n.s, not significant
Figure 2
Figure 2
Antitumor effects of triple combination chemotherapy in nude mice. A, BALB/c nu/nu mice were injected subcutaneously with 5.0 × 105 CT26 cells. On days 8 and 16, the mice were injected intraperitoneally with CP (50 mg/kg) and/or 5‐FU (50 mg/kg) and L‐OHP (6 mg/kg). The arrows indicate the drug injection times. The tumor volume was calculated as follows: (length × width2)/2. B, Means ± SEM of five mice. C, Tumor size data on day 28 as means ± SEM. * P < 0.05, ** P < 0.01 (ANOVA). CP, cyclophosphamide; 5‐FU, 5‐fluorouracil; L‐OHP, oxaliplatin
Figure 3
Figure 3
Flow cytometric analysis of T cells in CT26‐bearing mice. A, At 22 days after CT26 inoculation (4 days after the second treatment), tumor tissues were harvested, and tumor‐infiltrating CD45+ immune cells were examined. B, Percentages of CD4+ and CD8+ cells in tumor tissues. The mean ± SEM data of five mice are shown. C, Representative results; numbers are percentages. D, Similarly, spleens were harvested and their cell numbers were counted. E, Percentages of CD4+ and CD8+ cells of spleen cells. The means ± SEM of four mice are shown. F, Representative results; numbers are percentages. * P < 0.05, ** P < 0.01 (ANOVA). CP, cyclophosphamide; 5‐FU, 5‐fluorouracil; L‐OHP, oxaliplatin; n.s., not significant
Figure 4
Figure 4
Flow cytometric analysis of MDSCs in CT26‐bearing mice. At 22 days after tumor inoculation (4 days after the second treatment), tumor tissues were harvested and analyzed by flow cytometry. A, Proportion of CD11b+ cells. B, The staining strategy used to discriminate MDSC subsets. C, Percentages of M‐MDSCs, G‐MDSCs, and “others.” The mean ± SEM data of five mice are shown. D, Representative results; numbers are percentages. E, Similarly, the proportion of CD11b+ cells in spleen is shown. F, Percentages of M‐MDSCs, G‐MDSCs, and “others.”. The means ± SEM of four mice are shown. G, Representative results; numbers are percentages. * P < 0.05, ** P < 0.01 (ANOVA). CP, cyclophosphamide; 5‐FU, 5‐fluorouracil; L‐OHP, oxaliplatin; MDSC, myeloid‐derived suppressor cell; n.s., not significant
Figure 5
Figure 5
In vivo antitumor effects of the combination of chemotherapeutic drugs in the MC38 model. C57BL/6 mice were injected subcutaneously with 5.0 × 105 MC38 cells into the right flank. On days 10 and 18, the mice were injected intraperitoneally with CP (50 mg/kg) and/or 5‐FU (50 mg/kg) and L‐OHP (6 mg/kg). The tumor volume was calculated as follows: (length × width2)/2. The arrows indicate the drug injection times. The number in parentheses is the cured mice to total mice ratio. B, The data are presented as means ± SEM. C, Tumor volume data on day 26. D, Similarly, the body weight was measured every 4 days. E, At 22 days after MC38 inoculation (4 days after the second treatment), tumor tissues were harvested and tumor‐infiltrating CD45+ immune cells were examined. F, Percentages of CD11b+, CD4+, CD8+ cells, G‐MDSCs, and M‐MDSCs in tumor tissues. The means ± SEM of four mice are shown. G, Similarly, spleens were harvested, and their cell number was counted. H, Percentages of CD11b+, CD4+, CD8+ cells, G‐MDSCs, and M‐MDSCs in spleens. The means ± SEM of four mice are shown. * P < 0.05, ** P < 0.01 (ANOVA). CP: cyclophosphamide; 5‐FU: 5‐fluorouracil; L‐OHP: oxaliplatin; n.s., not significant
Figure 6
Figure 6
In vivo antitumor effects of the combination of chemotherapeutic drugs and anti‐PD‐1 antibody therapy. A, C57BL/6 mice were injected subcutaneously (s.c.) with 5.0 × 105 MC38 cells into the right flank. On days 10 and 18, the mice were injected intraperitoneally (i.p.) with CP (50 mg/kg), 5‐FU (50 mg/kg), and L‐OHP (6 mg/kg). On days 11 and 19, anti‐PD‐1 antibody (200 μg/mouse) was injected i.p. The tumor volume was calculated as follows: (length × width2)/2. The black and red arrows indicate the injection times of chemotherapeutic drugs and antibody, respectively. The number in parentheses represents the ratio of cured mice to total mice. B, Tumor volume data on day 26. The data are presented as means ± SEM. **P < 0.01 (ANOVA). C, D, Similarly, the body weight was measured every 4 days, and the body weight data on days 14 and 22 are shown as means ± SEM. E, The cured C57BL/6 mice were inoculated s.c. with 2.5 × 105 MC38 cells (n = 3). Naïve mice were also inoculated s.c. with 2.5 × 105 MC38 cells (n = 4). F, The spleen cells from cured and naïve mice were harvested and cultured with the p15E peptide in the presence of IL‐2 (20 U/mL) for 4 days. The cytotoxicity of the cultured cells against MC38 cells was examined using a 5‐h 51Cr‐release assay. CP, cyclophosphamide; 5‐FU, 5‐fluorouracil; L‐OHP, oxaliplatin
Figure 7
Figure 7
In vivo antitumor effects of double or triple combination of chemotherapeutic drugs with anti‐PD‐1 antibody therapy. A, C57BL/6 mice were injected subcutaneously (s.c.) with 5.0 × 105 MC38 cells into the right flank. On days 10 and 18, the mice were injected intraperitoneally (i.p.) with CP (50 mg/kg) or 5‐FU (50 mg/kg) and L‐OHP (6 mg/kg). On days 11 and 19, anti‐PD‐1 antibody (200 μg/mouse) was injected i.p. The tumor volume was calculated as follows: (length × width2)/2. The black and red arrows indicate the injection times of chemotherapeutic drugs and antibody, respectively. The number in parentheses represents the ratio of cured mice to total mice. B, Tumor volume data on day 26. The data are presented as means ± SEM. C, D, The body weight data on days 14, 22, and 26 are shown as means ± SEM. * P < 0.05, ** P < 0.01 (ANOVA). CP, cyclophosphamide; 5‐FU, 5‐fluorouracil; L‐OHP, oxaliplatin

References

    1. Ohigashi Y, Sho M, Yamada Y, et al. Clinical significance of programmed death‐1 ligand‐1 and programmed death‐1 ligand‐2 expression in human esophageal cancer. Clinical Cancer Res. 2005;11:2947‐2953. - PubMed
    1. Muro K, Chung HC, Shankaran V, et al. Pembrolizumab for patients with PD‐L1‐positive advanced gastric cancer (KEYNOTE‐012): a multicentre, open‐label, phase 1b trial. Lancet Oncol. 2016;17:717‐726. - PubMed
    1. Morgan RA, Yang JC, Kitano M, et al. Case report of a serious adverse event following the administration of T cells transduced with a chimeric antigen receptor recognizing ERBB2. Mol Ther. 2010;18:843‐851. - PMC - PubMed
    1. Parkhurst MR, Yang JC, Langan RC, et al. T cells targeting carcinoembryonic antigen can mediate regression of metastatic colorectal cancer but induce severe transient colitis. Mol Ther. 2011;19:620‐626. - PMC - PubMed
    1. Ott PA, Hodi FS, Robert C. CTLA‐4 and PD‐1/PD‐L1 blockade: new immunotherapeutic modalities with durable clinical benefit in melanoma patients. Clin Cancer Res. 2013;19:5300‐5309. - PubMed

MeSH terms