

Exploring the virulence gene interactome with CRISPR/dCas9 in the human malaria parasite
- PMID: 32816370
- PMCID: PMC7440042
- DOI: 10.15252/msb.20209569
Exploring the virulence gene interactome with CRISPR/dCas9 in the human malaria parasite
Abstract
Mutually exclusive expression of the var multigene family is key to immune evasion and pathogenesis in Plasmodium falciparum, but few factors have been shown to play a direct role. We adapted a CRISPR-based proteomics approach to identify novel factors associated with var genes in their natural chromatin context. Catalytically inactive Cas9 ("dCas9") was targeted to var gene regulatory elements, immunoprecipitated, and analyzed with mass spectrometry. Known and novel factors were enriched including structural proteins, DNA helicases, and chromatin remodelers. Functional characterization of PfISWI, an evolutionarily divergent putative chromatin remodeler enriched at the var gene promoter, revealed a role in transcriptional activation. Proteomics of PfISWI identified several proteins enriched at the var gene promoter such as acetyl-CoA synthetase, a putative MORC protein, and an ApiAP2 transcription factor. These findings validate the CRISPR/dCas9 proteomics method and define a new var gene-associated chromatin complex. This study establishes a tool for targeted chromatin purification of unaltered genomic loci and identifies novel chromatin-associated factors potentially involved in transcriptional control and/or chromatin organization of virulence genes in the human malaria parasite.
Keywords: CRISPR; Plasmodium falciparum; chromatin; epigenetics; var genes.
© 2020 The Authors. Published under the terms of the CC BY 4.0 license.
Conflict of interest statement
The funders had no role in the study design, data collection and interpretation, or the decision to submit the work for publication. The authors declare that they have no conflict of interest.
Figures
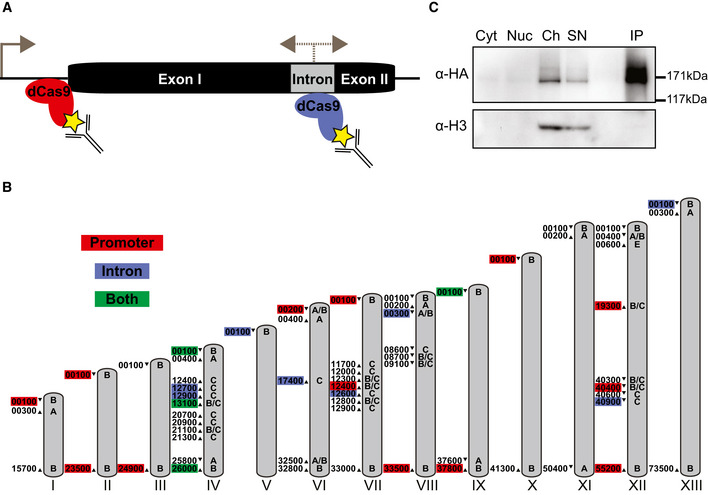
Schematic of a representative var gene with two exons flanking an intron. Transcription originates from the promoter (sense) and intron (sense and antisense). Specific sgRNAs direct dCas9 to either the promoter region (red) or intron (blue). Antibodies were used to isolate the dCas9 and bound genomic regions via a 3xHA tag (yellow star).
Schematic of var genes throughout the Plasmodium falciparum genome targeted with intron‐ (blue), promoter‐ (red), or both intron and promoter‐targeted (green) dCas9. Chromosomes are represented with gray bars, and chromosome numbers are indicated in roman numerals. var gene ups type is indicated on the chromosome, and var gene ID (excluding the preceding chromosome number) is listed to the left of its position on the chromosome. Direction of var gene transcription is indicated with an arrowhead.
Western blot analysis of a dCas9 immunoprecipitation experiment in the promoter‐targeted strain at ring stage. Levels of dCas9 and histone H3 in the cytoplasmic (Cyt), nuclear (excluding chromatin, Nuc), and chromatin (Ch) fractions are revealed with anti‐HA and anti‐H3 antibodies, respectively. dCas9 is enriched in the immunoprecipitated fraction (IP) compared to the unbound supernatant (SN) and input (i.e., chromatin fraction) of the IP. Molecular weights are shown to the right.

- A–C
Alignments of the var gene promoter (A) and intron (C) non‐coding strand sequences, with sgRNA sequences highlighted in red. The presumed off‐target sequence for the var promoter‐targeted dCas9 is shown in (B). Mismatches are highlighted in gray. Corresponding data for the promoter or intron sgRNAs can be found in [Link], [Link], respectively.
- D
Western blot analysis of cell fractions from ring stage parasites of the non‐targeted dCas9 control strain. Levels of dCas9‐3HA and histone H3 in the cytoplasmic (Cyt), nuclear (excluding chromatin, Nuc), and chromatin (Ch) fractions are revealed with anti‐HA and anti‐H3 antibodies, respectively. Molecular weights are shown to the right.
Circos plots of ChIP‐seq data showing genome‐wide enrichment of dCas9 in ring stage parasites. The 14 chromosomes are represented circularly by the outer gray bars, with chromosome number indicated in roman numerals and chromosome distances indicated in Arabic numerals (Mbp). Enrichment for intron‐ or promoter‐targeted dCas9 (normalized to non‐targeted dCas9) is shown as average reads per million (RPM) over bins of 1,000 nt. The maximum y‐axis value is 3,000 RPM for the promoter‐targeted dCas9 (rings represent increments of 500) and 400 RPM for the intron‐targeted dCas9 (rings represent increments of 66.7). var genes are represented by red bars. An asterisk indicates an unintended binding event. One replicate was performed for each strain. Peak quantification for promoter‐ and intron‐targeted dCas9 ChIP‐seq can be found in [Link], [Link], respectively.
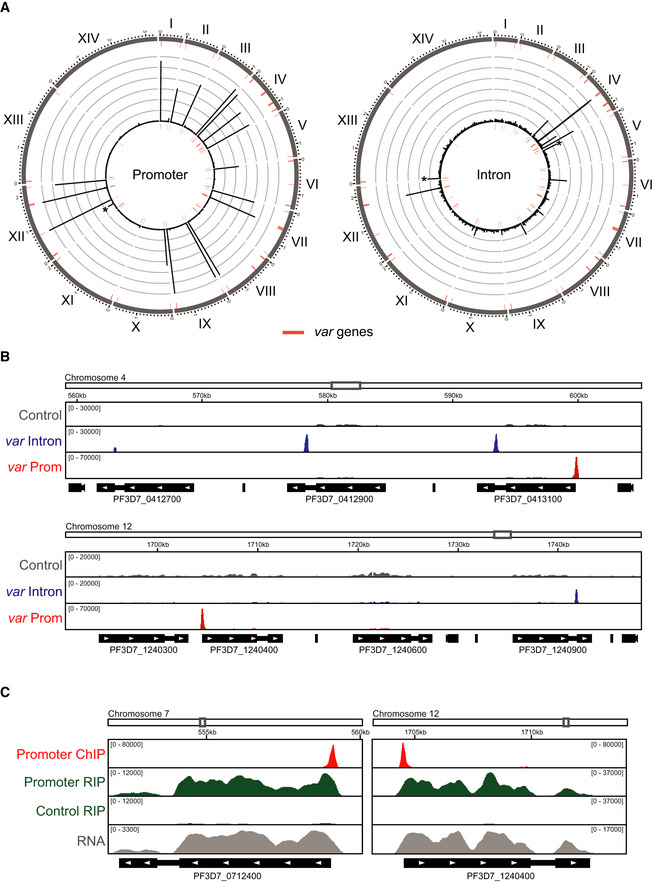
ChIP‐seq data show enrichment of dCas9 in strains at ring stage expressing non‐targeted “Control” (gray), var intron‐targeted (blue), or var promoter‐targeted (red) sgRNAs. Genome location is indicated at the top of each panel. The x‐axis is DNA sequence, with genes represented by black boxes indented to delineate introns and labeled with white arrowheads to indicate transcription direction. The y‐axis is input‐subtracted ChIP enrichment. q‐values for promoter‐targeted dCas9 peaks shown are 2.22 × 10−289 for PF3D7_0413100 and 7.07 × 10−257 for PF3D7_1240400. q‐values for intron‐targeted dCas9 peaks shown are 2.03 × 10−76 for PF3D7_412700, 6.81 × 10−46 for PF3D7_0412900, 1.53 × 10−62 for PF3D7_0413100, and 8.37 × 10⁻⁴ for PF3D7_1240900. One replicate was performed for each strain. Peak quantification for promoter‐ and intron‐targeted dCas9 ChIP‐seq can be found in [Link], [Link], respectively.
ChIP‐seq (red) and RIP‐seq (green) data show enrichment of DNA and RNA, respectively, from var genes in the promoter‐targeted and non‐targeted “Control” dCas9 immunoprecipitation from non‐clonal bulk population of ring stage parasites. Genome location is indicated at the top of each panel. The x‐axis is DNA sequence, with genes represented by black boxes indented to delineate introns and labeled with white arrowheads to indicate transcription direction. The y‐axis is input‐subtracted dCas9 ChIP enrichment in the var gene promoter‐targeted dCas9 strain (red), dCas9 RIP enrichment normalized to IgG control in the var gene promoter‐targeted dCas9 strain or non‐targeted “Control” dCas9 strain (green), or var gene transcript levels in the promoter‐targeted dCas9 strain (RPKM, gray). One replicate was performed for ChIP‐seq and RNA‐seq, and one replicate was performed for HA and IgG control RIP‐seq. ChIP‐seq peak quantification can be found in Table EV1, and RIP‐seq quantification can be found in Table EV3.
Circos plot of ChIP‐seq data showing genome‐wide enrichment of non‐targeted dCas9 in ring stage parasites. The 14 chromosomes are represented circularly by the outer gray bars, with chromosome number indicated in roman numerals and chromosome distances indicated in Arabic numerals (Mbp). Enrichment (ChIP normalized to input) is shown as average reads per million (RPM) over bins of 1,000 nt. The maximum y‐axis value is 1,000 RPM (rings represent increments of 167). var genes are represented by red bars. One replicate was used for the dCas9 ChIP‐seq.
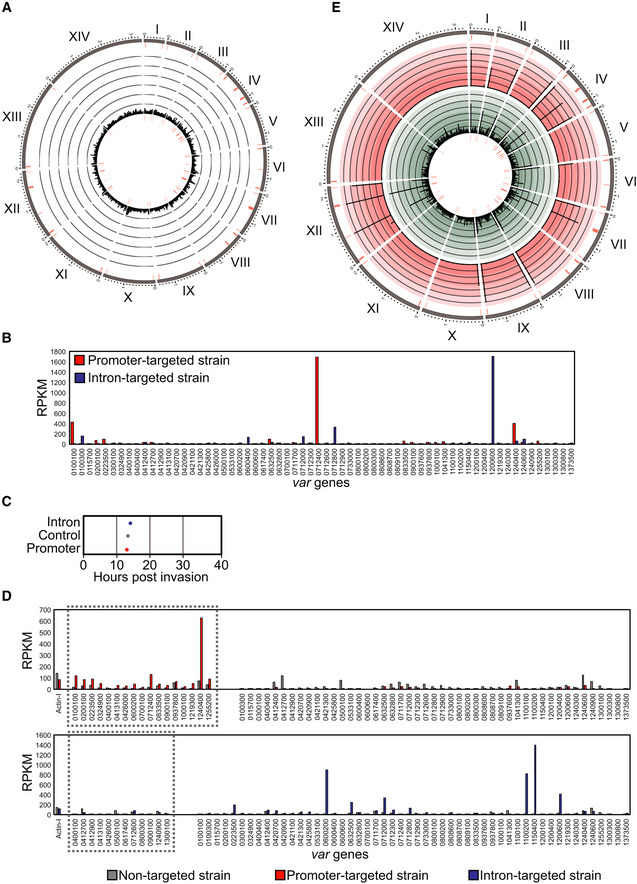
RNA‐seq data from clonal parasite populations of promoter‐ (red) or intron‐targeted (blue) dCas9 strains show transcript abundance (y‐axis = RPKM) for all var genes (x‐axis) at 14 hpi. One replicate was performed for each clone.
Cell cycle progression estimation of synchronized non‐clonal bulk parasite cultures of the promoter‐ (red), intron‐ (blue), and non‐targeted (gray) dCas9 strains at 14 hpi. RNA‐seq data from these parasites were compared to microarray data from Bozdech et al (2003) (Data ref: Bozdech et al, 2003) as in Lemieux et al (2009).
RNA‐seq data from non‐clonal bulk parasite cultures of the promoter‐ (red), intron‐ (blue), and non‐targeted (gray) dCas9 strains at 14 hpi show transcript abundance (y‐axis = RPKM) for all var genes (x‐axis). The gray dotted boxes indicate var genes bound by dCas9 in the promoter‐targeted strain (top graph) or intron‐targeted strain (bottom graph). One replicate was performed for each strain.
Circos plot of dCas9 ChIP‐seq (outer ring in red) and RIP‐seq (inner ring in green) data showing genome‐wide DNA and RNA enrichment, respectively, in var gene promoter‐targeted dCas9 immunoprecipitation at 14 hpi. The 14 chromosomes are represented circularly by the outer gray bars, with chromosome number indicated in roman numerals and chromosome distances indicated in Arabic numerals (Mbp). dCas9 ChIP enrichment (input‐subtracted and normalized to the corresponding value for the non‐targeted dCas9 control) is shown as average RPM over bins of 1,000 nt. dCas9 RIP enrichment (IgG‐subtracted and normalized to the corresponding value for the non‐targeted dCas9 control) is shown as average enrichment per gene. The maximum y‐axis value is 3,000 for ChIP‐seq, and 3 for RIP‐seq. var genes are represented by red bars. One replicate was performed for ChIP‐seq, and one replicate was performed for HA and IgG control and promoter‐targeted dCas9 RIP‐seq. ChIP‐seq peak quantification can be found in Table EV1, and RIP‐seq quantification can be found in Table EV3.
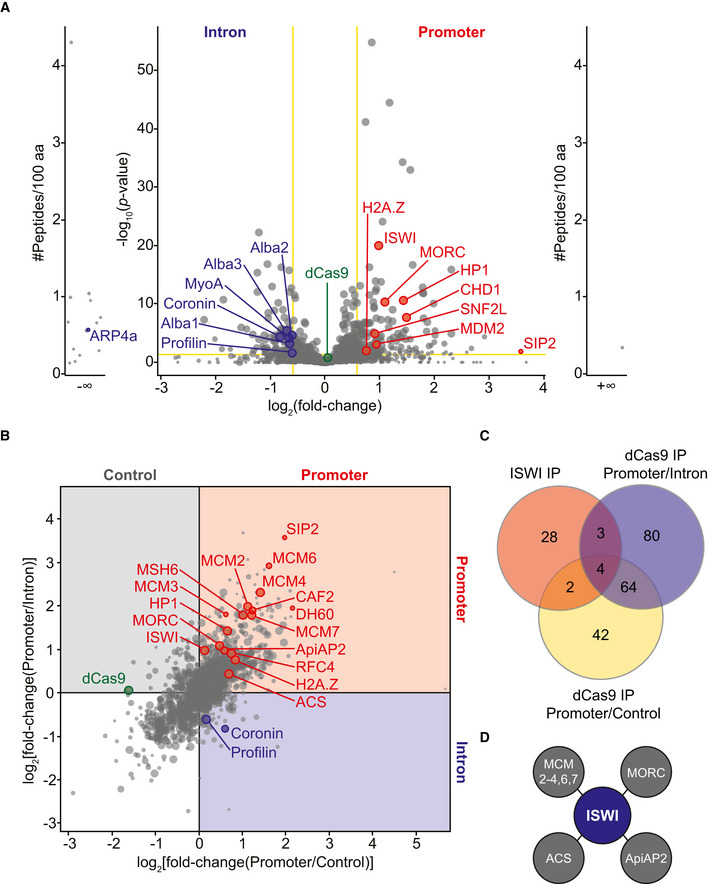
Volcano plot representation of label‐free quantitative proteomic analysis of P. falciparum proteins present in intron‐ (left) and promoter‐targeted (right) dCas9 immunoprecipitations. Each dot represents a protein, and its size corresponds to the sum of peptides from both conditions used to quantify the ratio of enrichment. For the main volcano plot, x‐axis = log2(fold‐change), y‐axis = −log10(P‐value), horizontal yellow line indicates adjusted P‐value = 0.05, and vertical yellow lines indicate absolute fold‐change = 1.5. Side panels indicate proteins uniquely identified in either sample (y‐axis = number of peptides per 100 amino acids). dCas9 protein is highlighted in green for reference. Two replicates were used for the promoter‐targeted dCas9, and four replicates were used for the intron‐targeted dCas9. Fold enrichment and adjusted P‐values for each protein highlighted in red (promoter) and blue (intron) can be found in [Link], [Link], respectively.
Correlation plot of label‐free quantitative proteomic analysis of P. falciparum proteins enriched in promoter‐targeted (top right quadrant in red) versus non‐targeted control (top left quadrant in gray) or intron (bottom right quadrant in blue) dCas9 immunoprecipitations. Each dot represents a protein, and its size corresponds to the sum of peptides from both conditions used to quantify the ratio of enrichment. The x‐axis = log2(fold‐change[promoter/non-targeted control]) and y‐axis = log2(fold‐change[promoter/intron]). dCas9 protein is highlighted in green for reference. Two replicates were used for the promoter‐targeted dCas9, and four replicates were used for the intron‐targeted and non‐targeted dCas9. Fold enrichment and adjusted P‐values can be found for each protein highlighted in red (promoter) in Tables EV5 (intron comparison) and EV7 (control comparison) and for each protein highlighted in blue (intron) in Tables EV6 (promoter comparison) and EV8 (control comparison).
Venn diagram comparing proteins enriched in the ISWI IP LC‐MS/MS (red) and the promoter‐targeted dCas9 IP LC‐MS/MS compared to the intron‐targeted dCas9 (blue) or the non‐targeted dCas9 (yellow).
Schematic of proteins shared between the ISWI IP LC‐MS/MS and the promoter‐targeted dCas9 IP LC‐MS/MS (overlapping regions shown in C): ISWI (PF3D7_0624600), MORC (PF3D7_1468100), ApiAP2 (PF3D7_1107800), MCM2‐4,6,7 (PF3D7_1417800, PF3D7_0527000, PF3D7_1317100, PF3D7_1355100, PF3D7_0705400), and acetyl‐CoA synthetase (ACS, PF3D7_0627800).
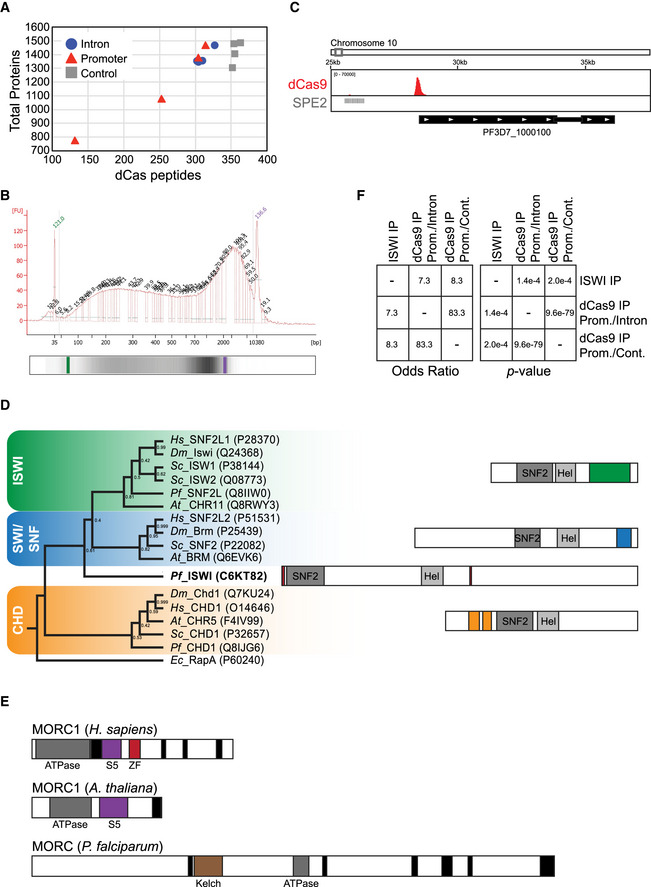
Graph showing dCas9 peptide ions (x‐axis) versus total proteins (y‐axis) detected in the proteomic analysis for each of four replicates of the intron‐ (blue circles), promoter‐ (red triangles), or non‐targeted (gray squares) dCas9 immunoprecipitations. Corresponding data can be found in Table EV4 (top).
Agilent DNA high sensitivity 2100 Bioanalyzer trace showing a representative distribution of DNA fragments after sonication of the chromatin samples used for dCas9 immunoprecipitation. x‐axis indicates DNA fragment size (bp), and y‐axis indicates abundance (fluorescence units). Lower DNA marker is shown in green, and upper DNA marker is shown in purple. A representative gel is shown at the bottom.
ChIP‐seq data showing enrichment of dCas9 in the var gene promoter‐targeted strain. Genome location is indicated at the top. The x‐axis is DNA sequence, with a representative subtelomeric var gene (PF3D7_1000100) represented by black boxes indented to delineate introns and labeled with white arrowheads to indicate transcription direction. The y‐axis is input‐subtracted ChIP enrichment (peak q = 5.54 × 10−275). SPE2 DNA sequences identified in Flueck et al (2010) are indicated with gray lines. One replicate was performed for ChIP‐seq.
Phylogenetic tree comparing PfISWI with SNF2 domain‐containing chromatin remodelers in P. falciparum and other organisms (indicated in italicized letters) based on the SNF2 domain sequence (left). Bootstrap values of 1,000 replicates are shown at nodes. General representations of protein compositions are shown on the right, with SNF2 and helicase (“Hel”) domains in gray. The ISWI family of chromatin remodelers contains HAND, SANT, and SLIDE domains (green), the SWI/SNF family contains a bromodomain (blue), and the CHD family contains chromodomains (orange). PfISWI contains zinc finger domains (red).
Graphical representation of MORC family proteins in P. falciparum and other eukaryotes. S5 = S5 fold domain, ZF = zinc finger domain. Black box = coiled‐coil domain.
Odds ratios and P‐values calculated with Fisher's exact test (with GeneOverlap R package) for protein overlap (Venn diagram in Fig 3C) between the ISWI IP LC‐MS/MS, var promoter‐targeted dCas9 LC‐MS/MS (compared to intron‐targeted dCas9), or var promoter‐targeted dCas9 LC‐MS/MS (compared to control dCas9). Odds ratio represents strength of association (≤ 1 indicates no association between two lists while > 1 indicates association).
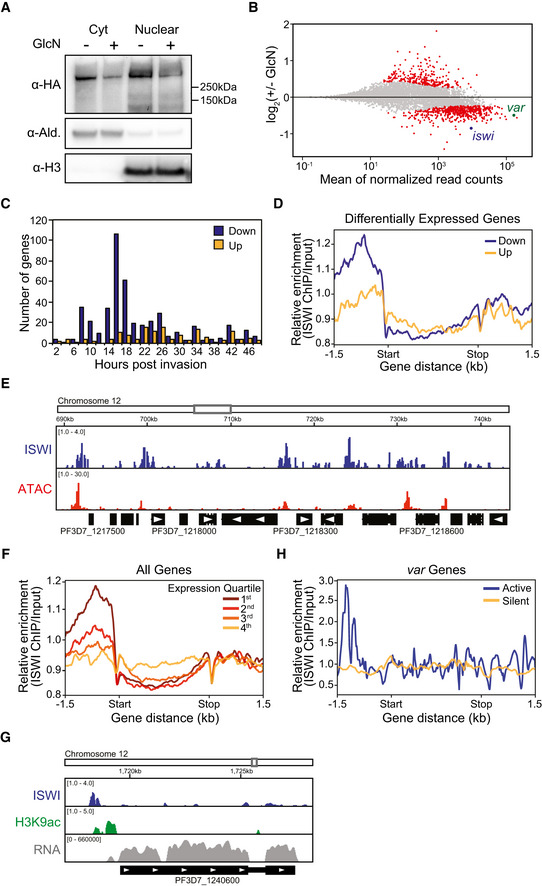
Western blot analysis of cytoplasmic (Cty) and nuclear extracts from a bulk population of ISWI‐3HA-ribo parasites in the absence (−) or presence (+) of glucosamine (GlcN). ISWI‐3HA is detected with an anti‐HA antibody. Antibodies against aldolase (Ald.) and histone H3 are controls for the cytoplasmic and nuclear extracts, respectively. Molecular weights are shown to the right.
MA plot of log2(glucosamine‐treated/untreated, M) plotted over the mean abundance of each gene (A) at 12 hpi. Transcripts with a significantly higher (above x‐axis) or lower (below x‐axis) abundance in the presence of glucosamine are highlighted in red (q ≤ 0.05). iswi is highlighted in blue (q = 6.71 × 10⁻¹⁰), and the active var gene is highlighted in green (q = 2.53 × 10⁻⁵). Two and three replicates were used for untreated and glucosamine‐treated parasites, respectively. P‐values were calculated with a Wald test for significance of coefficients in a negative binomial generalized linear model as implemented in DESeq2 (Love et al, 2014). q = Bonferroni corrected P‐value.
Frequency plot showing the time in the IDC of peak transcript level (comparison to microarray time course in Bozdech et al (2003) (Data ref: Bozdech et al, 2003)) for genes that are significantly down‐regulated (blue) or up‐regulated (yellow) following ISWI knockdown.
Meta‐gene plot showing average ISWI enrichment (y‐axis = ChIP/Input) in clonal ISWI‐3HA parasites at 12 hpi from 1.5 kb upstream of the translation start site (“Start”) to 1.5 kb downstream of the translation stop site (“Stop”) for genes that are down‐ (blue) or up‐regulated (yellow) upon ISWI knockdown. One replicate was used for the ISWI ChIP‐seq.
ChIP‐seq data show enrichment of ISWI (blue) in clonal ISWI‐3HA parasites at 12 hpi relative to regions of accessible chromatin (“ATAC,” red). Chromatin accessibility (ATAC‐seq) data were taken from the 15 hpi time point in Toenhake et al, 2018 (Data ref: Toenhake et al, 2018). Genome location is indicated at the top of the panel. The x‐axis is DNA sequence, with genes represented by black boxes indented to delineate introns and labeled with white arrowheads to indicate transcription direction. The y‐axis is enrichment (ChIP/Input or ATAC‐seq/genomic DNA). One replicate was used for the ISWI ChIP‐seq.
Meta‐gene plot showing average ISWI enrichment (y‐axis = ChIP/Input) in clonal ISWI‐3HA parasites at 12 hpi from 1.5 kb upstream of the translation start site (“Start”) to 1.5 kb downstream of the translation stop site (“Stop”) for all genes, which are grouped into quartiles based on their transcript levels (RPKM) at 12 hpi. Dark red represents genes with the highest transcript levels (“1st”), light red represents genes with the second highest transcript levels (“2nd”), orange represents genes with the third highest transcript levels (“3rd”), and yellow represents genes with the lowest transcript levels (“4th”). One replicate was used for the ISWI ChIP‐seq, and the transcription data are an average from the two replicates of the untreated ISWI‐3HA clone used for the differential expression analysis.
ChIP‐seq data show enrichment of ISWI (blue) and H3K9ac (green) in clonal ISWI‐3HA parasites at 12 hpi at the active var gene (PF3D7_1240600). RNA‐seq data from this clone at 12 hpi show transcript levels for this gene (gray). Genome location is indicated at the top of the panel. The x‐axis is DNA sequence, with genes represented by black boxes indented to delineate introns and labeled with white arrowheads to indicate transcription direction. The y‐axis is ChIP/Input for ChIP data and RPKM for RNA‐seq data. One replicate was used for each ChIP‐seq, and the RNA‐seq data are from a single replicate from the untreated ISWI‐3HA clone used for the differential expression analysis.
Meta‐gene plot showing average ISWI enrichment (y‐axis = ChIP/Input) in clonal ISWI‐3HA parasites at 12 hpi from 1.5 kb upstream of the translation start site (“Start”) to 1.5 kb downstream of the translation stop site (“Stop”) for the active var gene (PF3D7_1240600, blue) or silent var genes (yellow). One replicate was used for the ISWI ChIP‐seq.
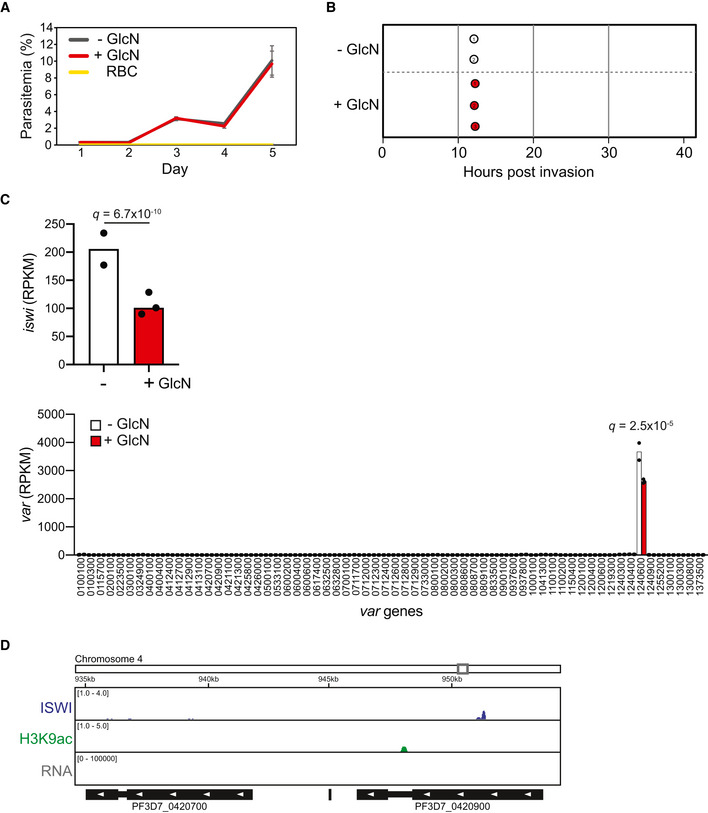
Growth curve over 5 days of clonal ISWI‐3HA-ribo parasites in the absence (“− GlcN” in gray) or presence (“+ GlcN” in red) of glucosamine. Uninfected red blood cells (“RBC” in yellow) serve as reference of background. Error bars indicate standard deviation of three technical replicates in blood from two different donors (n = 6).
Cell cycle progression estimation of an ISWI‐3HA-ribo parasite clone in the absence (“− GlcN” in white) or presence (“+ GlcN” in red) of glucosamine. RNA‐seq data from synchronized parasites harvested at 12 hpi were compared to microarray data from Bozdech et al (2003) (Data ref: Bozdech et al, 2003) as in Lemieux et al (2009). Replicates are represented with numbered circles.
RNA‐seq of an ISWI‐3HA-ribo clone at 12 hpi shows iswi (top, q = 6.71 × 10⁻¹⁰) and var gene (bottom, active var gene q = 2.53 × 10⁻⁵) transcript levels in the absence (“−”, white) or presence (“+”, red) of glucosamine (GlcN). y‐axis is transcript level (RPKM). Bars represent averages of two and three replicates (individual values indicated with black dots) for untreated and glucosamine‐treated parasites, respectively. P‐values are calculated with a Wald test for significance of coefficients in a negative binomial generalized linear model as implemented in DESeq2 (Love et al, 2014). q = Bonferroni corrected P‐value. Corresponding data can be found in Source Data for Table EV12.
ChIP‐seq data show enrichment of ISWI (blue) and H3K9ac (green) in clonal ISWI‐3HA parasites at 12 hpi at two silent var genes (PF3D7_0420700 and PF3D7_0420900). RNA‐seq data from this clone at 12 hpi show transcript levels for these genes (gray). Genome location is indicated at the top of the panel. The x‐axis is DNA sequence, with genes represented by black boxes indented to delineate introns and labeled with white arrowheads to indicate transcription direction. The y‐axis is ChIP/Input for ChIP data and RPKM for RNA‐seq data. One replicate was used for each ChIP‐seq, and the RNA‐seq data are from a single replicate from the untreated ISWI‐3HA clone used for the differential expression analysis.
References
-
- Aravind L, Iyer LM, Wellems TE, Miller LH (2003) Plasmodium biology: genomic gleanings. Cell 115: 771–785 - PubMed
Publication types
MeSH terms
Substances
Associated data
- Actions
Grants and funding
LinkOut - more resources
Full Text Sources
