

Monocytopenia, monocyte morphological anomalies and hyperinflammation characterise severe COVID-19 in type 2 diabetes
- PMID: 32816392
- PMCID: PMC7461002
- DOI: 10.15252/emmm.202013038
Monocytopenia, monocyte morphological anomalies and hyperinflammation characterise severe COVID-19 in type 2 diabetes
Abstract
Early in the COVID-19 pandemic, type 2 diabetes (T2D) was marked as a risk factor for severe disease and mortality. Inflammation is central to the aetiology of both conditions where variations in immune responses can mitigate or aggravate disease course. Identifying at-risk groups based on immunoinflammatory signatures is valuable in directing personalised care and developing potential targets for precision therapy. This observational study characterised immunophenotypic variation associated with COVID-19 severity in T2D. Broad-spectrum immunophenotyping quantified 15 leucocyte populations in peripheral circulation from a cohort of 45 hospitalised COVID-19 patients with and without T2D. Lymphocytopenia and specific loss of cytotoxic CD8+ lymphocytes were associated with severe COVID-19 and requirement for intensive care in both non-diabetic and T2D patients. A morphological anomaly of increased monocyte size and monocytopenia restricted to classical CD14Hi CD16- monocytes was specifically associated with severe COVID-19 in patients with T2D requiring intensive care. Increased expression of inflammatory markers reminiscent of the type 1 interferon pathway (IL6, IL8, CCL2, INFB1) underlaid the immunophenotype associated with T2D. These immunophenotypic and hyperinflammatory changes may contribute to increased voracity of COVID-19 in T2D. These findings allow precise identification of T2D patients with severe COVID-19 as well as provide evidence that the type 1 interferon pathway may be an actionable therapeutic target for future studies.
Keywords: COVID-19; SARS-CoV-2; inflammation; monocyte; type 2 diabetes.
© 2020 The Authors. Published under the terms of the CC BY 4.0 license.
Conflict of interest statement
The authors declare that they have no conflict of interest.
Figures
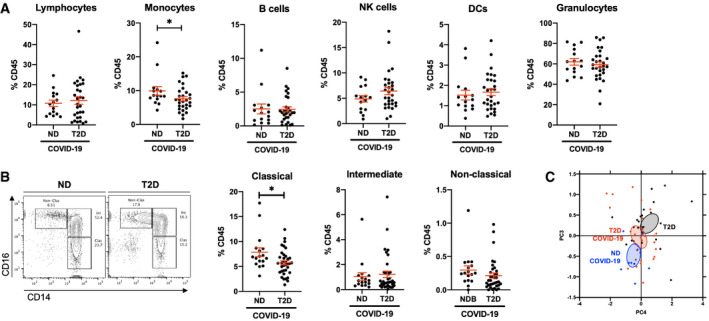
- A
Flow cytometric quantification of lymphocytes, monocytes, B cells, natural killer (NK) cells, dendritic cells (DCs) and granulocytes in peripheral venous blood samples from non‐diabetic (ND) and type 2 diabetic (T2D) patients with COVID‐19.
- B
Quantification of monocyte subpopulation phenotypes as classical (CD14Hi CD16−), intermediate (CD14Hi CD16+) or non‐classical (CD14Lo CD16+).
- C
Principal component analysis of lymphocyte and monocyte population frequencies in ND and T2D COVID‐19 patients and in T2D patients without COVID‐19.
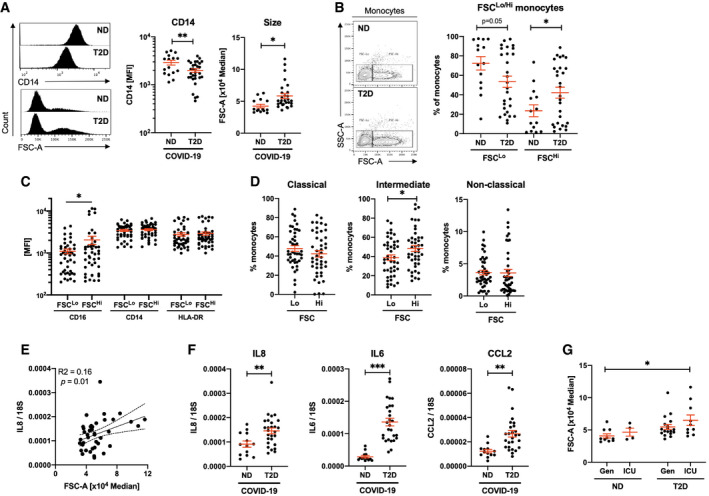
- A
Quantification of CD14 expression and size (FSC) in monocyte populations from non‐diabetic (ND) and type 2 diabetic (T2D) COVID‐19 patients.
- B
Frequency of conventional (FSCLo) and large (FSCHi) monocytes in ND and T2D COVID‐19 patients.
- C
Expression of CD16, CD14 and HLA‐DR in FSCLo and FSCHi monocytes from COVID‐19 patients.
- D
Proportions of classical, intermediate and non‐classical monocytes within FSCLo and FSCHi monocytes from COVID‐19 patients.
- E
Correlative analyses of IL8 expression in peripheral blood mononuclear cells (PBMCs) to monocyte FSC.
- F
IL8, IL6 and CCL2 mRNA expression in PBMCs from ND and T2D COVID‐19 patients.
- G
Monocyte size quantified in ND and T2D COVID‐19 patients treated in general wards (Gen) or in the intensive care unit (ICU).
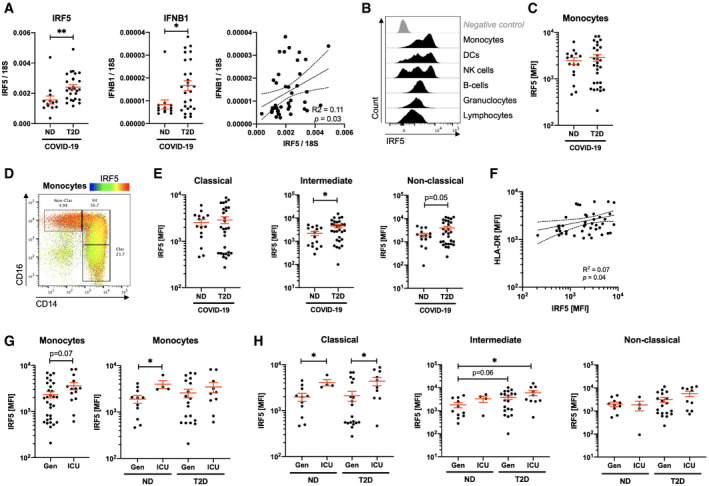
- A
Quantification of IRF5 and IFNB1 mRNA expression in peripheral blood mononuclear cells of non‐diabetic (ND) and type 2 diabetic (T2D) COVID‐19 patients.
- B
Histograms of IRF5 expression on different populations analysed by flow cytometry on venous blood samples.
- C
IRF5 median fluorescence intensity (MFI) in monocytes of ND and T2D patients with COVID‐19.
- D
IRF5 expression overlaid onto monocyte phenotypic gating.
- E
IRF5 expression (MFI) in monocyte subtypes from ND and T2D COVID‐19 patients.
- F
HLA‐DR and IRF5 expression in monocytes from COVID‐19 patients.
- G
IRF5 expression in monocytes of ND or T2D COVID‐19 patients admitted to the intensive care unit (ICU) or treated exclusively in general wards (Gen).
- H
IRF5 expression in monocytes of ND or T2D COVID‐19 patients admitted to the ICU or treated exclusively in Gen.
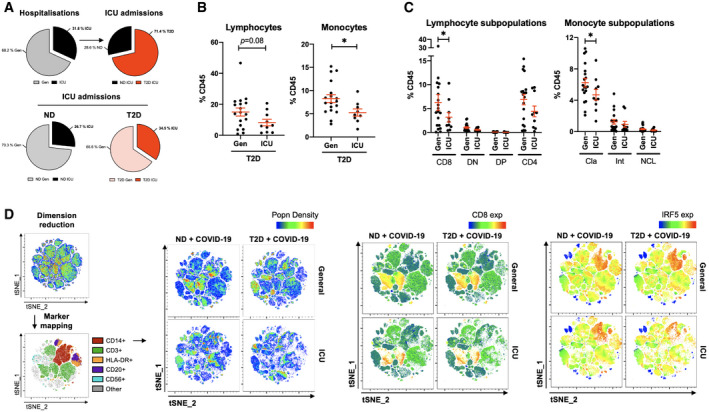
- A
Pie charts of COVID‐19 hospitalisation that were exclusively treated in general wards (Gen) or that required intensive care (ICU). Proportions of patients admitted to the ICU that were non‐diabetic (ND) or with type 2 diabetes (T2D).
- B
Proportions of lymphocytes and monocytes in peripheral venous blood from T2D patients with COVID‐19 either treated in Gen or requiring ICU admission.
- C
Phenotypic analysis of lymphocyte and monocyte subpopulations in peripheral venous blood from T2D COVID‐19 patients treated in Gen or requiring ICU treatment.
- D
t‐SNE mapping of all cytometric acquired data with projections of population density, CD8 or IRF5 expression. Maps are of representative profiles from each group.
References
-
- Codo AC, Davanzo GG, Monteiro LB, de Souza GF, Muraro SP, Virgilio‐da-Silva JV, Prodonoff JS, Carregari VC, de Biagi Junior CAO, Crunfli F et al (2020) Elevated glucose levels favor SARS‐CoV‐2 infection and monocyte response through a HIF‐1alpha/glycolysis‐dependent axis. Cell Metab 10.1016/j.cmet.2020.07.007 - DOI
-
- Corbin AL, Gomez‐Vazquez M, Khoyratty TE, Berthold DL, Almuttaqi H, Attar M, Arnold IC, Powrie FM, Sansom SN, Udalova IA (2019) IRF5 promotes intestinal inflammation by guiding monocyte differentiation towards a pathogenic CD11c+ macrophage phenotype. BioRxiv 10.1101/601963 [PREPRINT] - DOI
Publication types
MeSH terms
Substances
Grants and funding
- ANR-19-CE14-0005/Agence Nationale de la Recherche (ANR)/International
- ERC-EpiFAT 725790/EC | H2020 | H2020 Priority Excellent Science | H2020 European Research Council (ERC)/International
- Société Francophone du Diabète (SFD)/International
- Assistance Publique - Hôpitaux de Paris (AP-HP)/International
- Institut National de la Santé et de la Recherche Médicale (Inserm)/International
LinkOut - more resources
Full Text Sources
Medical
Research Materials
Miscellaneous
