Comment
. 2021 Jan;11(1):142-157.
doi: 10.1158/2159-8290.CD-20-0142. Epub 2020 Aug 19.

BI-3406, a Potent and Selective SOS1-KRAS Interaction Inhibitor, Is Effective in KRAS-Driven Cancers through Combined MEK Inhibition

Affiliations
Comment

BI-3406, a Potent and Selective SOS1-KRAS Interaction Inhibitor, Is Effective in KRAS-Driven Cancers through Combined MEK Inhibition

Marco H Hofmann et al. Cancer Discov. 2021 Jan.

Abstract

KRAS is the most frequently mutated driver of pancreatic, colorectal, and non-small cell lung cancers. Direct KRAS blockade has proved challenging, and inhibition of a key downstream effector pathway, the RAF-MEK-ERK cascade, has shown limited success because of activation of feedback networks that keep the pathway in check. We hypothesized that inhibiting SOS1, a KRAS activator and important feedback node, represents an effective approach to treat KRAS-driven cancers. We report the discovery of a highly potent, selective, and orally bioavailable small-molecule SOS1 inhibitor, BI-3406, that binds to the catalytic domain of SOS1, thereby preventing the interaction with KRAS. BI-3406 reduces formation of GTP-loaded RAS and limits cellular proliferation of a broad range of KRAS-driven cancers. Importantly, BI-3406 attenuates feedback reactivation induced by MEK inhibitors and thereby enhances sensitivity of KRAS-dependent cancers to MEK inhibition. Combined SOS1 and MEK inhibition represents a novel and effective therapeutic concept to address KRAS-driven tumors. SIGNIFICANCE: To date, there are no effective targeted pan-KRAS therapies. In-depth characterization of BI-3406 activity and identification of MEK inhibitors as effective combination partners provide an attractive therapeutic concept for the majority of KRAS-mutant cancers, including those fueled by the most prevalent mutant KRAS oncoproteins, G12D, G12V, G12C, and G13D.See related commentary by Zhao et al., p. 17.This article is highlighted in the In This Issue feature, p. 1.


Conflict of interest statement

Disclosure of conflict of interest: The authors declare competing financial interests: Marco H. Hofmann, Michael Gmachl, Juergen Ramharter, Fabio Savarese, Daniel Gerlach, Michael P. Sanderson, Dirk Kessler, Francesca Trapani, Heribert Arnhof, Klaus Rumpel, Dana-Adriana Botesteanu, Peter Ettmayer, Thomas Gerstberger, Christiane Kofink, Tobias Wunberg, Andreas Zoephel, Nikolai, Jark Böttcher, Pototschnig, Franziska Schachinger, Katharina Schipany, Simone Lieb, Jurgen Moll, Mark Petronczki, Mark Pearson, Darryl B. McConnell and Norbert Kraut performed the work herein reported as employees of Boehringer Ingelheim RCV GmbH & Co KG. Jonathan C. O’Connell and Rachel L. Mendes performed the work herein reported as employees of Forma Therapeutics. Joseph R. Marszalek, Szu-Chin Fu, Jessica L. Teh, Christopher P. Vellano and Timothy P. Heffernan performed the work herein reported as employees of the University of Texas MD Anderson Cancer Center.

Figures

Figure 1:
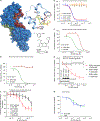
Figure 1:. Discovery of BI-3406, a potent and selective SOS1::KRAS interaction inhibitor
a, Co-crystal x-ray structure of BI-3406 bound to the catalytic pocket of SOS1 (ligand shown in yellow, SOS1 as surface representation). The previously described catalytic RAS interaction site (dark red; PDB: 1NVU) and the allosteric site (green) are highlighted. The enlarged area depicts the key interactions of BI-3406 and SOS1 within the binding site. Amino acids involved in the RAScat interaction are highlighted in dark red, indicating a clash of BI-3406 with RAScat. Structure and potency of BI-3406 are shown at the bottom right. b, Biochemical protein-protein interaction assays (AlphaScreen) between recombinant SOS1 or SOS2 and recombinant KRAS G12C or KRAS G12D conducted under incubation with increasing concentrations of BI-3406 (dose-response curves as relative fluorescence units (RFUs) means±s.e.m., n=2). c-d, Biochemical protein-protein interaction assays (AlphaScreen) between recombinant SOS1 and recombinant KRAS G12C (c) or KRAS G12D (d) carried out under increasing concentrations of BI-3406 or the covalent KRAS G12C inhibitor ARS-1620 (c, and d, n=2, means±s.e.m.). Dose response curves as in (b). e, MIA PaCa-2 stably transduced with FLAG-tagged wild-type SOS1 or the indicated mutant SOS1 transgenes were exposed to different concentrations of BI-3406 for 2 hours. Phospho-ERK levels were subsequently quantified in cell lysates by capillary immunodetection using alpha-actinin as a loading control and normalized to the levels measured in DMSO solvent treated samples (n=3 independent biological replicates). IC50 values (nM) are shown in the legend. Inlay: Lane view of FLAG-SOS1 transgene expression in comparison to alpha-actinin in stably transduced MIA PaCa-2 cells from a representative capillary immunodetection experiment. f, Cell proliferation assay using MIA PaCa-2 transgenic cell pools expressing the indicated FLAG-SOS1 transgenes (data points are derived from two independent biological replicates each containing three technical replicates). IC50 values (nM) are shown in the legend. g, Dose-dependent, cellular effect of BI-3406 on RAS-GTP levels (n=2, means±s.e.m.) in standard 2D / 10% serum conditions with increasing concentrations of BI-3406 for 2 h. RAS-GTP levels were quantified relative to DMSO controls (RAS G-LISA).
Figure 2:
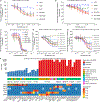
Figure 2:. Drug sensitivity profiling of cancer cell lines uncovers an association of KRAS mutation status with sensitivity to SOS1 inhibition
a, Inhibition of pERK activity by BI-3406 after 1 hour in 2D assay conditions in a cancer cell line panel quantified by Western blotting (n=2, means±s.d.). A375 (KRAS wt, BRAF V600E), A549 (KRAS G12S), DLD-1 (KRAS G13D), NCI-H23 (KRAS G12C), NCI-H358 (KRAS G12C), and NCI-H520 (KRAS wt and BRAF wt). b, Inhibition of cell proliferation by BI-3406 in a cancer cell line panel in 3D proliferation assays (n=3, means±s.d.). c, In vitro sensitivity of a panel of cell lines to the positive control panobinostat (Sigma Aldrich) in a 3D proliferation assay (n=3, means±s.d.). d) Effect of BI-3406 on pERK levels in a panel of isogenic NCI-H23 cell lines. Values were normalized to total ERK protein (n=2, means±s.d.). e) In vitro sensitivity of a panel of isogenic cell lines treated with BI-3406 in a 3D proliferation assay (n=3, means±s.d.). f, In vitro sensitivity of 40 cancer cell lines treated with BI-3406 in 3D proliferation assays. Panels depict the proliferation data (n=2), the respective cancer type, and the mutation status of selected genes. Cell lines are grouped based on an IC50 cut-off of 100 nmol/L. The mutation status and zygosity is shown by a continuous color-coding scheme, blue boxes reflect wild-type status, while light blue boxes indicate an unknown status. Only re-occurring hotspot mutations are reported for KRAS, NRAS, HRAS, EGFR, and BRAF (Supplementary Table S5). NCI-H2347 carries a KRAS L19F mutation (asterisks).
Figure 3:
Figure 3:. SOS1 inhibition suppresses tumor growth and KRAS/MAPK signaling in xenograft models of KRAS-driven cancers
a, pERK levels analyzed by a multiplexed immunoassay in explanted MIA PaCa-2 tumors treated with 50 mg/kg BI-3406 twice daily at the time point 0 h and 6 h. (n=5 animals per group, means±s.e.m, two-tailed t-test). b, pERK levels in mouse skin (treatment as in a) assessed by IHC staining (H-scores) (n=5 animals per group, means±s.d., two-tailed t-test). c, Gene expression profiling of pharmacodynamic biomarkers in a MIA PaCa-2 in vivo biomarker experiment (n=4–5 animals per group, medians of normalized gene expression). A subset of nine genes shows time-dependent modulation after BI-3406 (50 mg/kg) treatment, visualized as a color-coded expression heatmap. d, Anti-tumor effect of BI-3406 in the MIA PaCa-2 xenograft model (n=7 animals per group, means±s.e.m., one-tailed t-test) e, Median body weight change of mice bearing subcutaneous MIA PaCa-2 xenografts administered as described in (d) (n=7 animals per group, medians). f, Responses of different xenograft models after treatment with BI-3406 (50 mg/kg bid) or vehicle (control). Tumor growth inhibition (TGI) was determined based on tumor size after 20–23 days of continuous treatment (n=7–9 animals per group, means±s.d.). Genotypes of tested xenograft models: SW620 colorectal (KRAS G12V, BRAF wt), LoVo colorectal (KRAS G13D, BRAF wt), MIA PaCa-2 pancreas (KRAS G12C, BRAF wt), and A549 non-small cell lung cancer (KRAS G12S, BRAF wt). Significant TGI was achieved in all tested KRAS mutant xenograft models, with the exception of the KRAS wild-type model A375 (*≤0.05 ** < 0.01, *** < 0.001, one tailed t-test).
Figure 4:
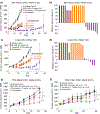
Figure 4:. Combined SOS1 and MEK inhibition leads to regressions in KRAS-mutant tumors
a, Tumor volumes of mice injected subcutaneously with MIA PaCa-2 cells. All mice were treated bid (with a delta of 6 hours) with vehicle (control), trametinib (0.125 mg/kg), BI-3406 (50 mg/kg) for 22 days, or the combination of both agents for 29 days (n=7 animals per group, means±s.e.m.) followed by an off-treatment period until day 57. b, Relative tumor volume of MIA PaCa-2 are indicated as percent change from baseline at day 22. Values smaller than zero percent indicate tumor regressions. c, Efficacy of the combination of BI-3406 and trametinib in the LoVo xenograft model. Continuous treatment with trametinib or BI-3406 alone or in combination for 23 days, followed by an off-treatment period until day 34 (n=7 animals per group, means±s.e.m.). (*≤0.05 ** < 0.01, *** < 0.001; a and c, one tailed Student’s t-test comparing control with treatment groups). d, Relative tumor volume for the LoVo model are indicated as percent change from baseline at day 22. e-f Tumor growth of colorectal cancer (CRC) PDX xenografts in mice treated with vehicle, BI-3406 (50 mg/kg, bid), trametinib (0.1 mg/kg, bid), or the combination for the models B8032 (e) and C1047 (f) tumors (n=5–7 animals per group, means±s.e.m. For convenience in PDX models mice were treated in a 5 days on / 2 days off schedule. Statistical significance was determined using an unpaired t-test per row and the Holm-Sidak method to correct for multiple comparisons, see as well Supplementary Fig. S4d and S4e).
Figure 5:
Figure 5:. Biomarker modulation upon combined SOS1 and MEK inhibition
a, Western blot analysis of pMEK1/2 in MIA PaCa-2 cells grown in vitro in 2D and treated with BI-3406, trametinib, or the combination for the indicated time periods (n=3, means±s.e.m.). b, Western blot analysis of pERK in MIA PaCa-2 cells grown in vitro in 2D as in a; (a and b, one tailed t-test p=0.05; two-tailed t-test: p=0.1). c, Multiplexed immunoassay measurements of pERK and total ERK in MIA PaCa-2 tumor xenografts at 4 h post-treatment (n=4 animals per group, means±s.d.; two tailed t-test). d, Proposed model of the effects of combined MEK and SOS1 inhibition. Inhibition of MEK results in the attenuation of negative feedback control leading to increased SOS1 activity KRAS-GTP loading driving reactivation of downstream signals. Based on these adaptive responses, effects of MEK inhibitors on cell proliferation and survival are limited. Adaptive responses can be abrogated through combined blockade of MEK and SOS1, which prevents MEK inhibitor-induced KRAS-GTP loading and reduces signaling downstream of KRAS, resulting in durable tumor regressions.

Comment in

Comment on

References

    1. Moll HP, Pranz K, Musteanu M, Grabner B, Hruschka N, Mohrherr J, et al. Afatinib restrains K-RAS-driven lung tumorigenesis. Science translational medicine 2018;10(446) doi 10.1126/scitranslmed.aao2301. - DOI - PMC - PubMed
    1. Cichowski K, Jacks T. NF1 tumor suppressor gene function: narrowing the GAP. Cell 2001;104(4):593–604 doi 10.1016/s0092-8674(01)00245-8. - DOI - PubMed
    1. Bollag G, Clapp DW, Shih S, Adler F, Zhang YY, Thompson P, et al. Loss of NF1 results in activation of the Ras signaling pathway and leads to aberrant growth in haematopoietic cells. Nature genetics 1996;12(2):144–8 doi 10.1038/ng0296-144. - DOI - PubMed
    1. Cox AD, Fesik SW, Kimmelman AC, Luo J, Der CJ. Drugging the undruggable RAS: Mission possible? Nature reviews Drug discovery 2014;13(11):828–51 doi 10.1038/nrd4389. - DOI - PMC - PubMed
    1. Stephen AG, Esposito D, Bagni RK, McCormick F. Dragging ras back in the ring. Cancer cell 2014;25(3):272–81 doi 10.1016/j.ccr.2014.02.017. - DOI - PubMed

Publication types

Substances