

Tebentafusp, A TCR/Anti-CD3 Bispecific Fusion Protein Targeting gp100, Potently Activated Antitumor Immune Responses in Patients with Metastatic Melanoma
- PMID: 32816891
- PMCID: PMC9210997
- DOI: 10.1158/1078-0432.CCR-20-1247
Tebentafusp, A TCR/Anti-CD3 Bispecific Fusion Protein Targeting gp100, Potently Activated Antitumor Immune Responses in Patients with Metastatic Melanoma
Abstract
Purpose: Tebentafusp is a first-in-class bispecific fusion protein designed to target gp100 (a melanoma-associated antigen) through a high affinity T-cell receptor (TCR) binding domain and an anti-CD3 T-cell engaging domain, which redirects T cells to kill gp100-expressing tumor cells. Here, we report a multicenter phase I/II trial of tebentafusp in metastatic melanoma (NCT01211262) focusing on the mechanism of action of tebentafusp.
Patients and methods: Eighty-four patients with advanced melanoma received tebentafusp. Treatment efficacy, treatment-related adverse events, and biomarker assessments were performed for blood-derived and tumor biopsy samples obtained at baseline and on-treatment.
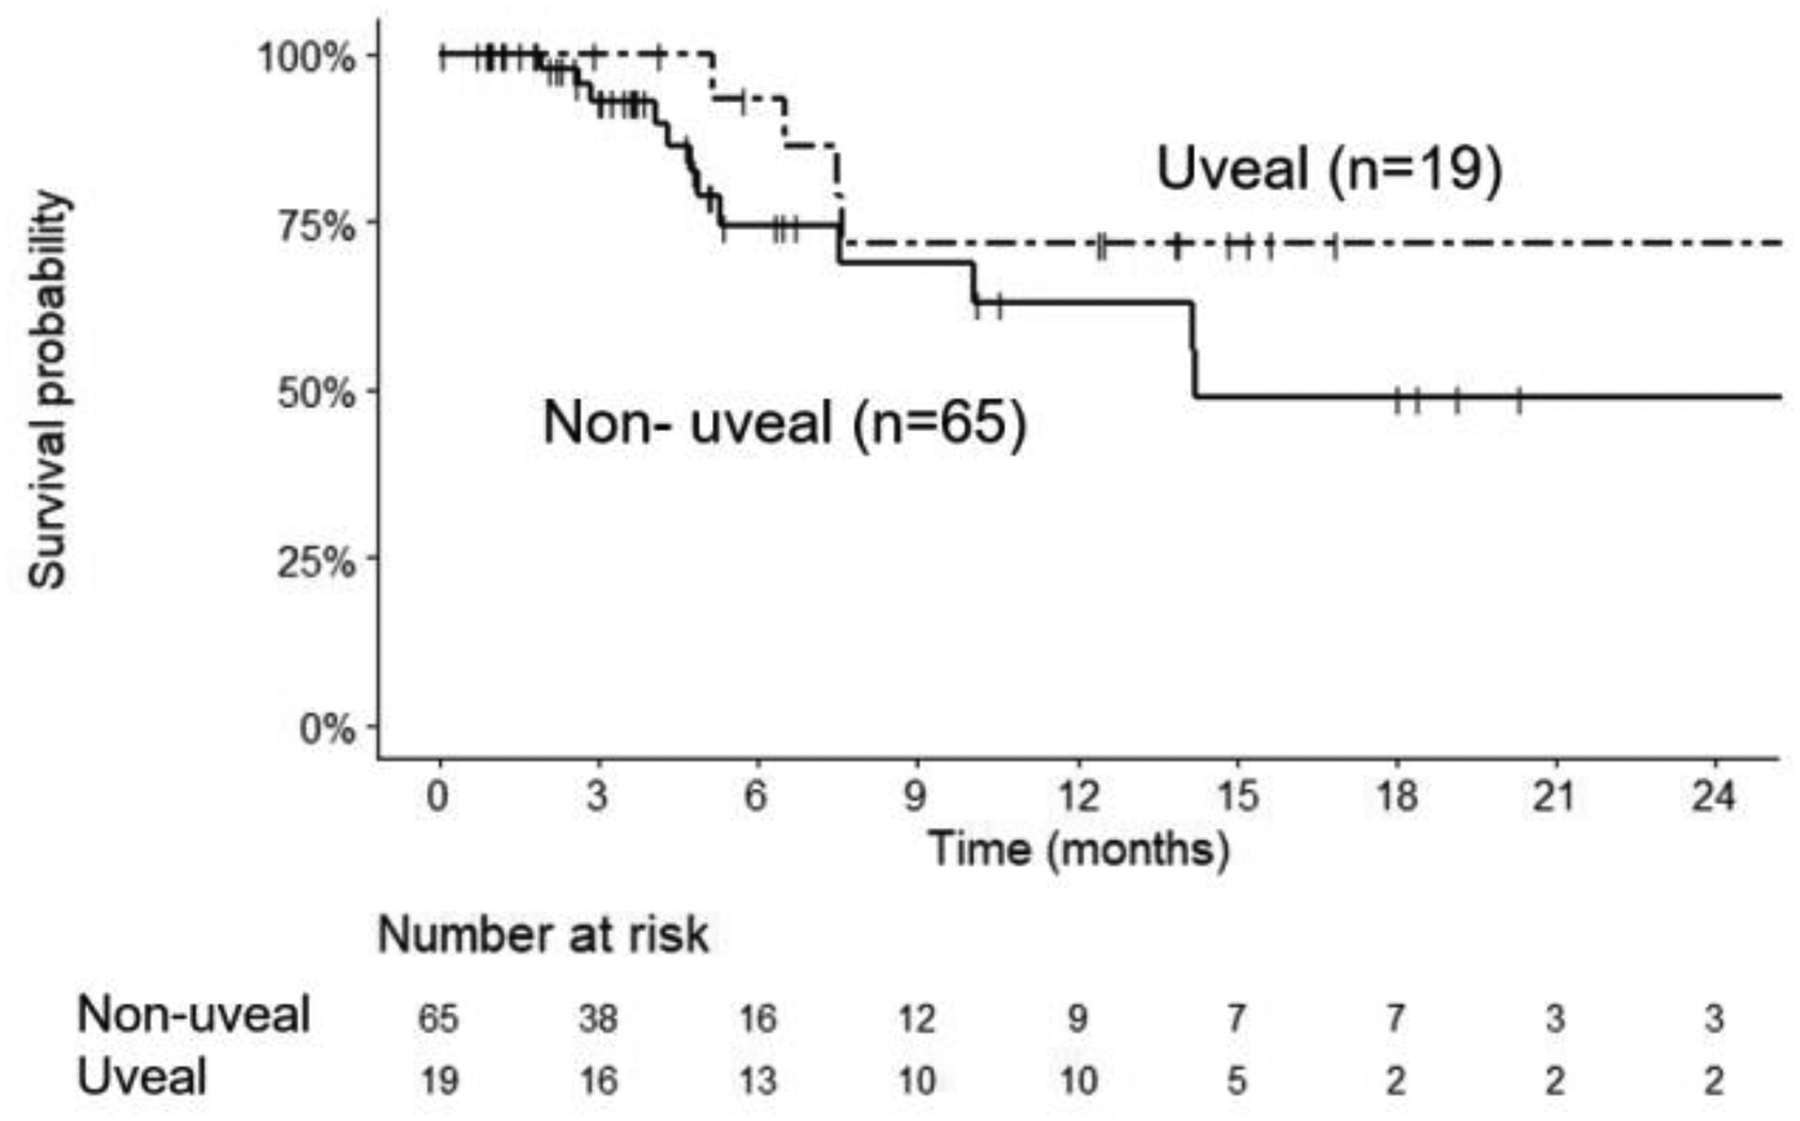
Results: Tebentafusp was generally well-tolerated and active in both patients with metastatic uveal melanoma and patients with metastatic cutaneous melanoma. A 1-year overall survival rate of 65% was achieved for both patient cohorts. On-treatment cytokine measurements were consistent with the induction of IFNγ pathway-related markers in the periphery and tumor. Notably, tebentafusp induced an increase in serum CXCL10 (a T-cell attractant) and a reduction in circulating CXCR3+ CD8+ T cells together with an increase in cytotoxic T cells in the tumor microenvironment. Furthermore, increased serum CXCL10 or the appearance of rash (likely due to cytotoxic T cells targeting gp100-expressing skin melanocytes) showed a positive association with patient survival.
Conclusions: These data suggest that redirecting T cells using a gp100-targeting TCR/anti-CD3 bispecific fusion protein may provide benefit to patients with metastatic melanoma. Furthermore, the activity observed in these two molecularly disparate melanoma classes hints at the broad therapeutic potential of tebentafusp.
©2020 American Association for Cancer Research.
Conflict of interest statement
Declaration of competing interests
Cheryl McAlpine, Antonella Vardeu, Emma Leach, Revashnee Naidoo, Sarah Stanhope, Sion Lewis, Jacob Hurst, and Ita O’Kelly are / have been employees of Immunocore, which could benefit from commercialization of these results. Mark Middleton and Mario Sznol have previously served on the scientific advisory board of Immunocore
Figures
 ), IL-10 (
 ), IL-6 (
 ), CXCL10 (
 ) and CXCL11 (
 ) in a subset of 15 patients treated weekly with 600 ng/kg/ 50 mcg tebentafusp. Plots represents mean ± standard error of the mean [SEM] c. Percentage differences in CXCR3+ CD4+ and CD8+ parent populations (A), CD4+ subsets (B) and CD8+ subsets (C) at ~24 h post 1st dose tebentafusp compared with baseline. Heatmaps constructed using the ComplexHeatmap R library(13). N, naïve; EM, effector memory; CM, central memory; Tscm, stem-cell memory T cell; and LD, late differentiated effector memory. d. Correlation of fold increase in serum CXCL10 with fold decrease in peripheral CXCR3+ CD8+ cell population 24 h following first dose of tebentafusp (Spearman R= −0.66; p=0.00104; n=21).
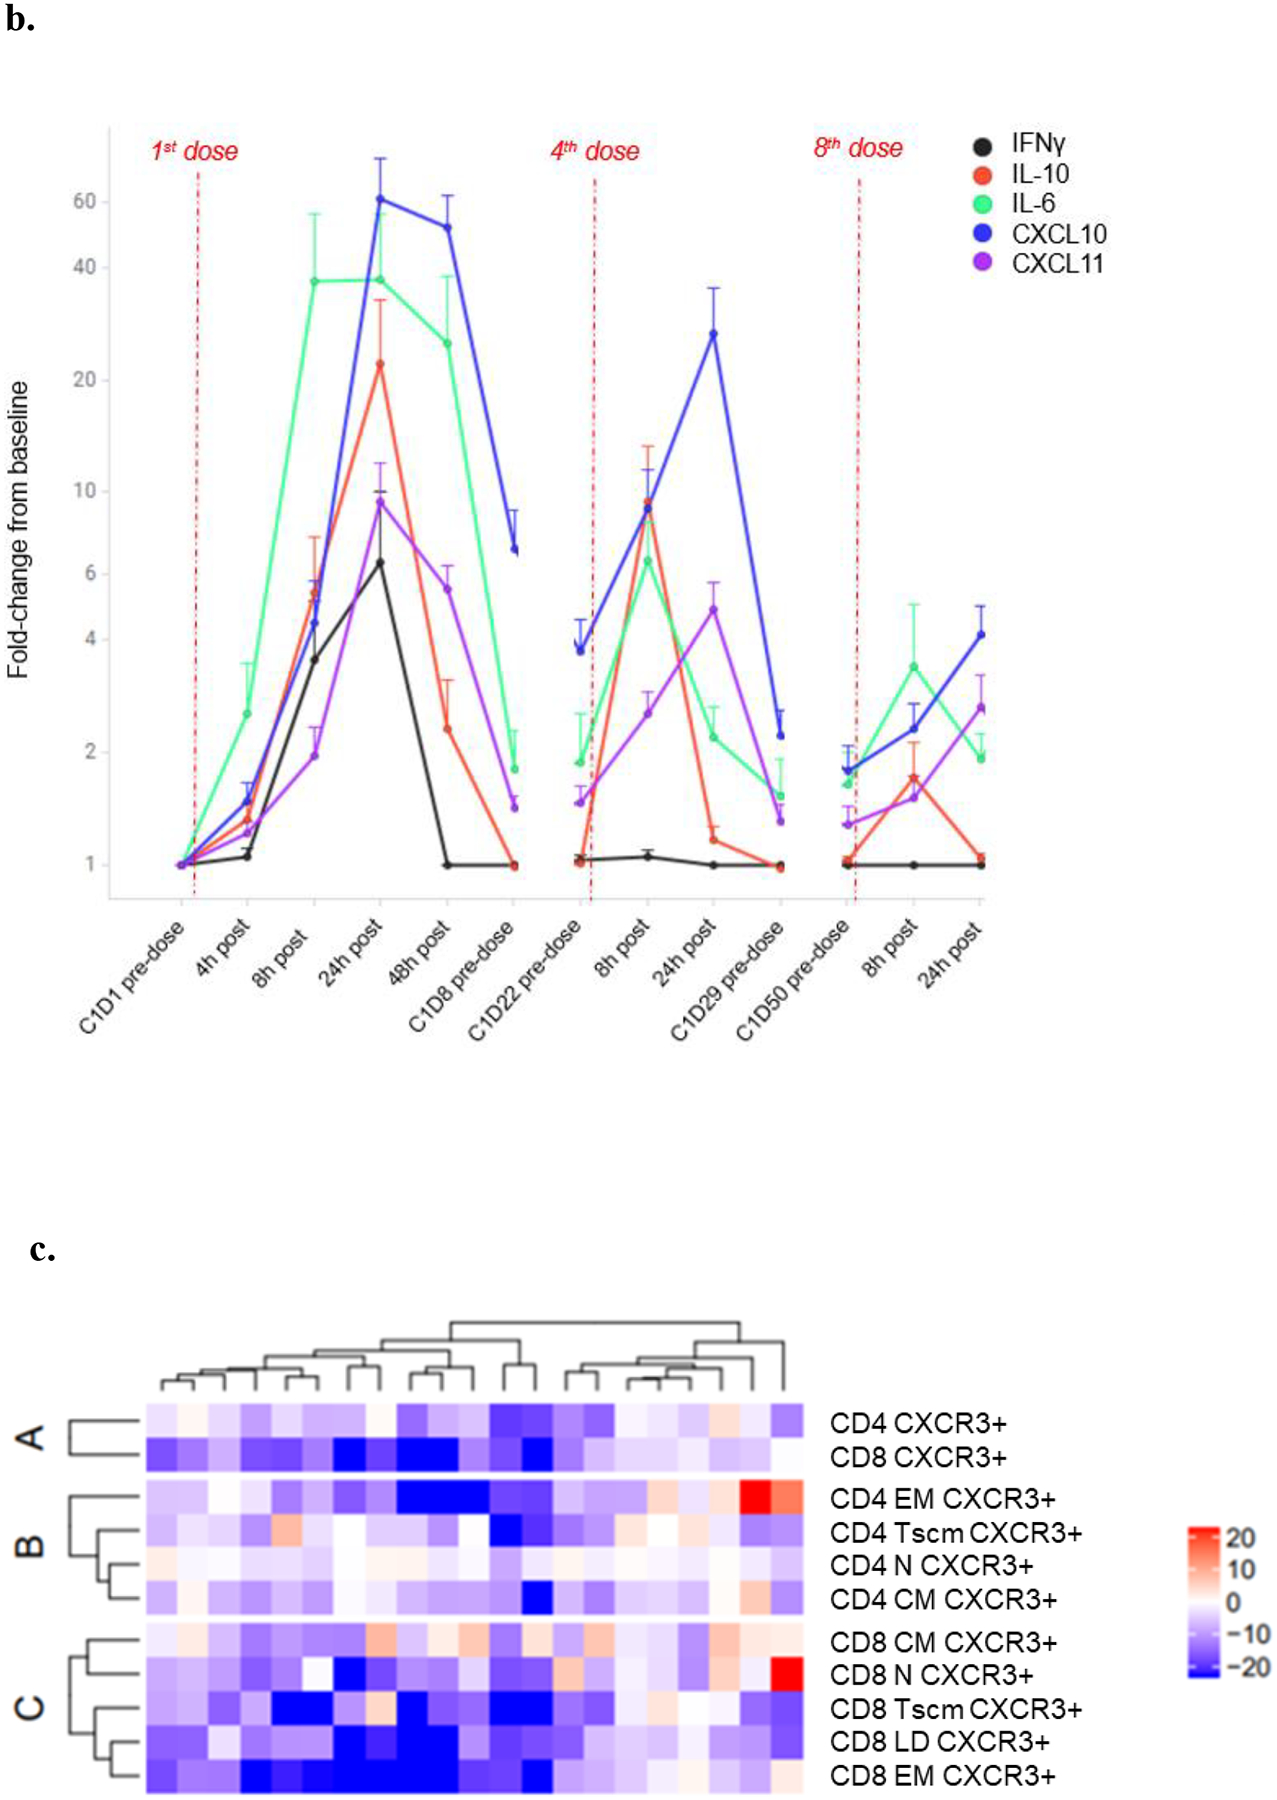 ), IL-10 (), IL-6 (), CXCL10 () and CXCL11 () in a subset of 15 patients treated weekly with 600 ng/kg/ 50 mcg tebentafusp. Plots represents mean ± standard error of the mean [SEM] c. Percentage differences in CXCR3+ CD4+ and CD8+ parent populations (A), CD4+ subsets (B) and CD8+ subsets (C) at ~24 h post 1st dose tebentafusp compared with baseline. Heatmaps constructed using the ComplexHeatmap R library(13). N, naïve; EM, effector memory; CM, central memory; Tscm, stem-cell memory T cell; and LD, late differentiated effector memory. d. Correlation of fold increase in serum CXCL10 with fold decrease in peripheral CXCR3+ CD8+ cell population 24 h following first dose of tebentafusp (Spearman R= −0.66; p=0.00104; n=21).
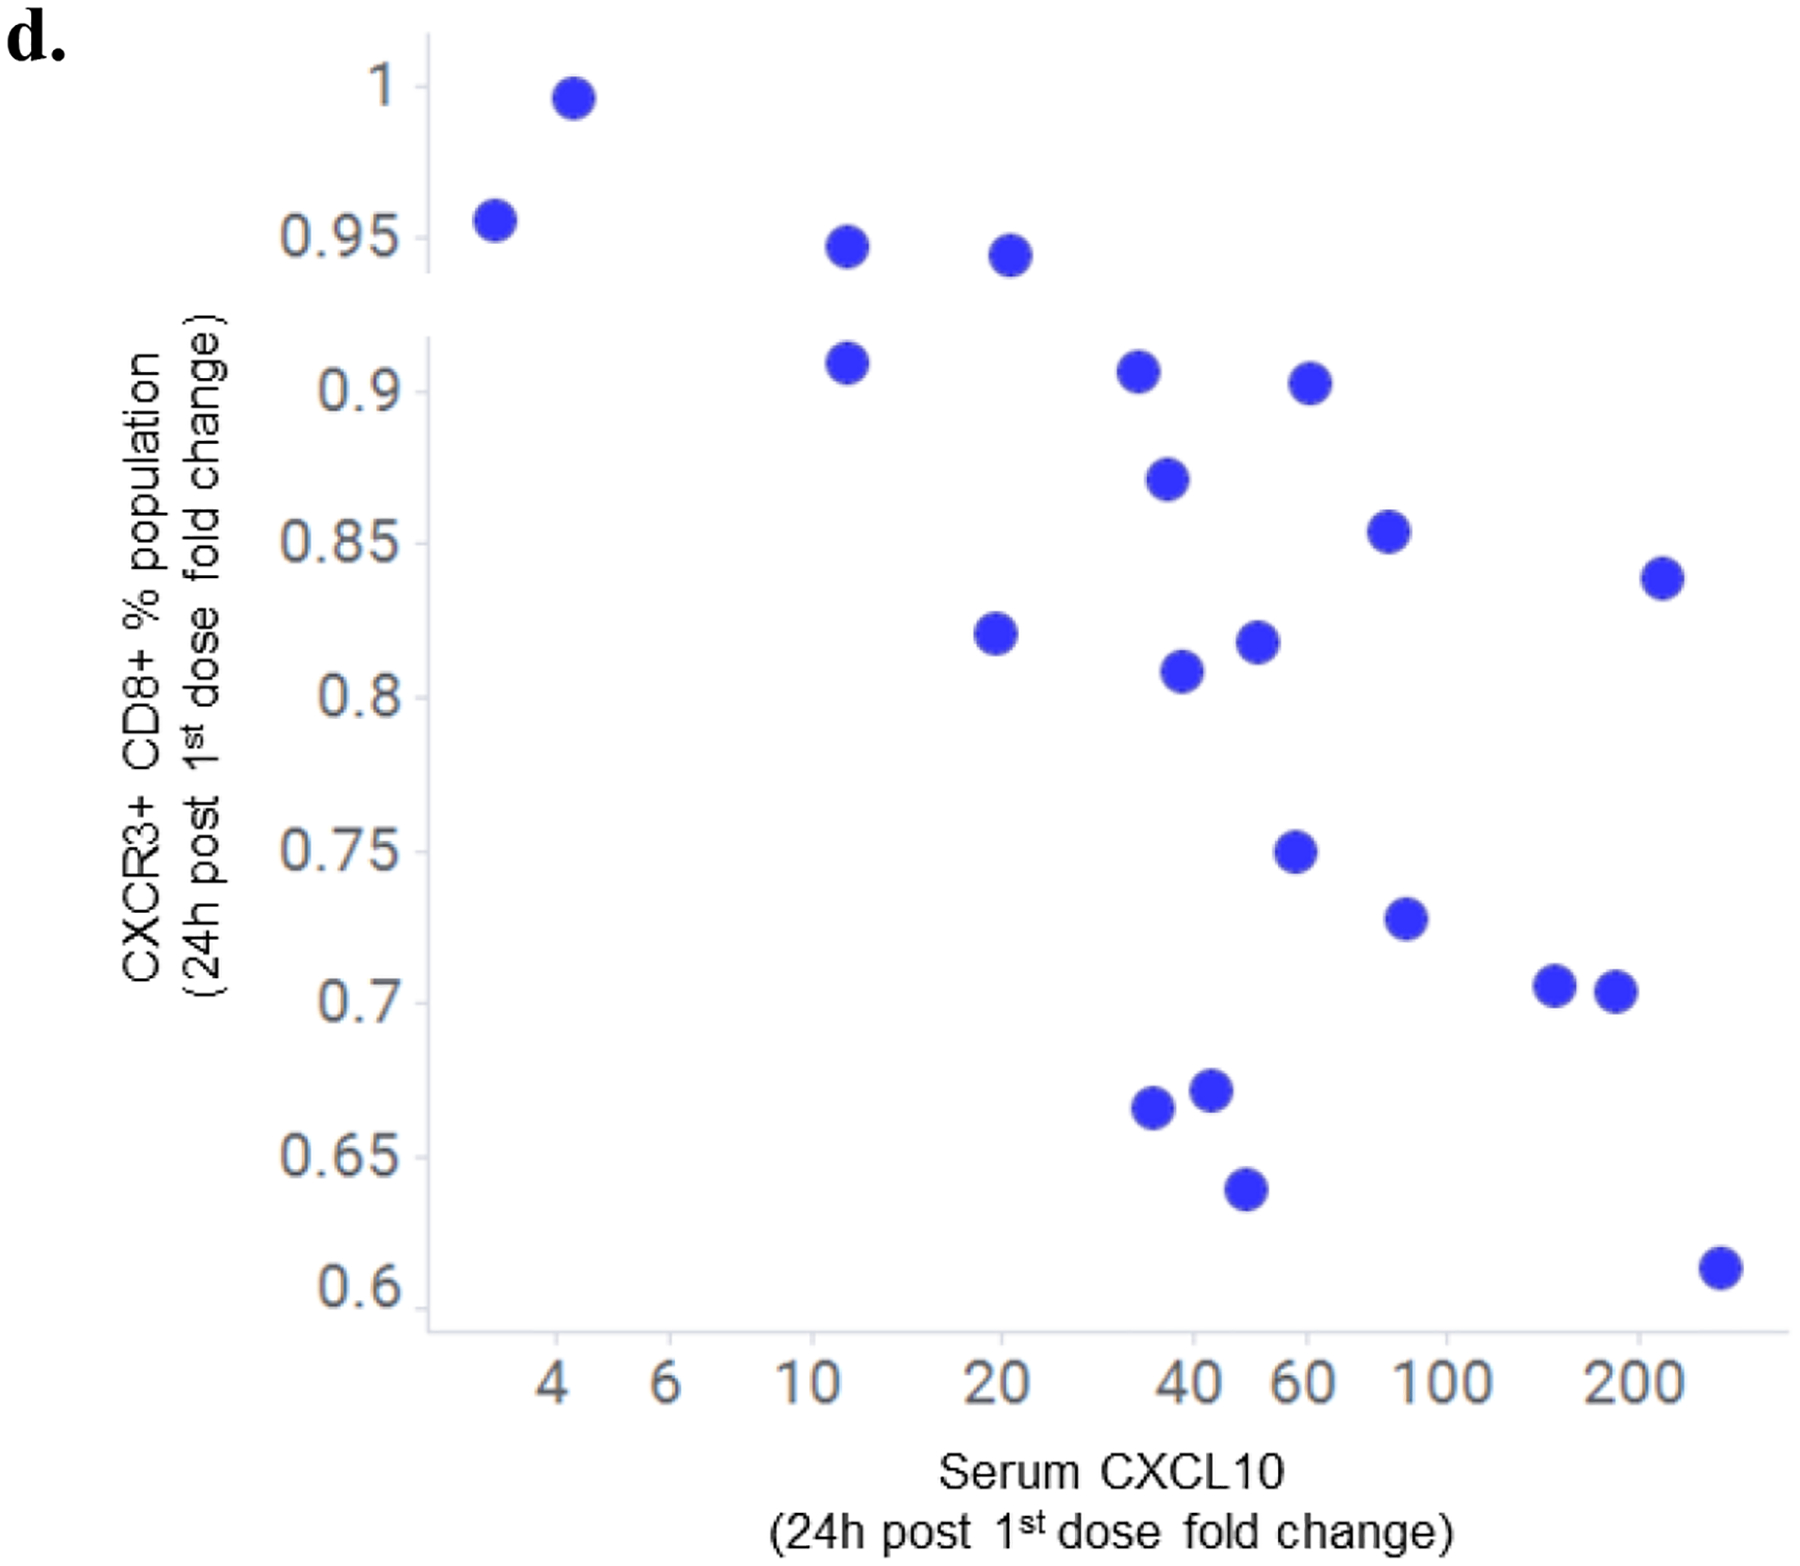 ), IL-10 (), IL-6 (), CXCL10 () and CXCL11 () in a subset of 15 patients treated weekly with 600 ng/kg/ 50 mcg tebentafusp. Plots represents mean ± standard error of the mean [SEM] c. Percentage differences in CXCR3+ CD4+ and CD8+ parent populations (A), CD4+ subsets (B) and CD8+ subsets (C) at ~24 h post 1st dose tebentafusp compared with baseline. Heatmaps constructed using the ComplexHeatmap R library(13). N, naïve; EM, effector memory; CM, central memory; Tscm, stem-cell memory T cell; and LD, late differentiated effector memory. d. Correlation of fold increase in serum CXCL10 with fold decrease in peripheral CXCR3+ CD8+ cell population 24 h following first dose of tebentafusp (Spearman R= −0.66; p=0.00104; n=21).
References
Publication types
MeSH terms
Substances
Grants and funding
LinkOut - more resources
Full Text Sources
Other Literature Sources
Medical
Research Materials
