Comment
. 2020 Nov 15;80(22):4932-4945.
doi: 10.1158/0008-5472.CAN-20-1255. Epub 2020 Aug 19.

KRAS Controls Pancreatic Cancer Cell Lipid Metabolism and Invasive Potential through the Lipase HSL

Affiliations
Comment

KRAS Controls Pancreatic Cancer Cell Lipid Metabolism and Invasive Potential through the Lipase HSL

Cody N Rozeveld et al. Cancer Res. .

Abstract

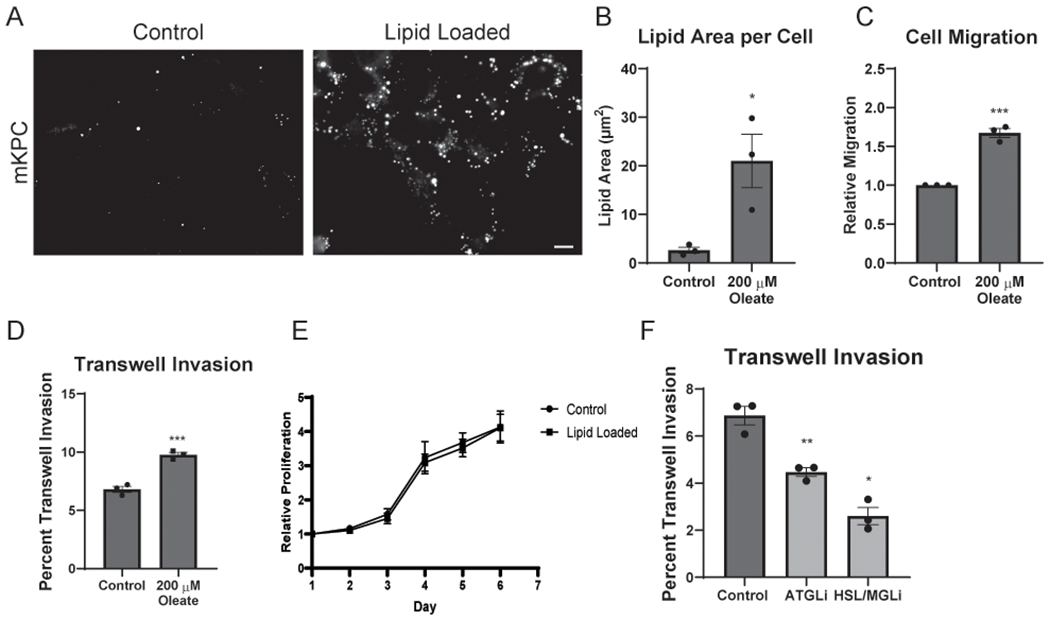
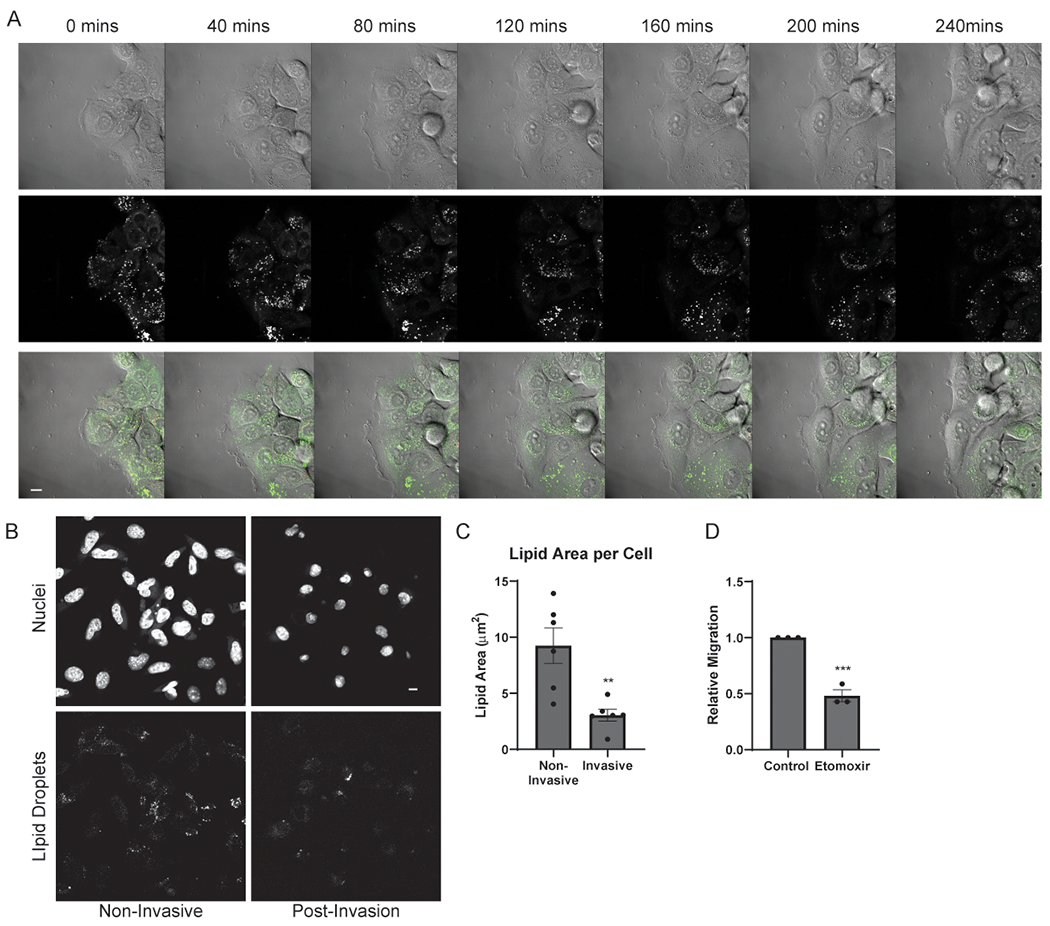
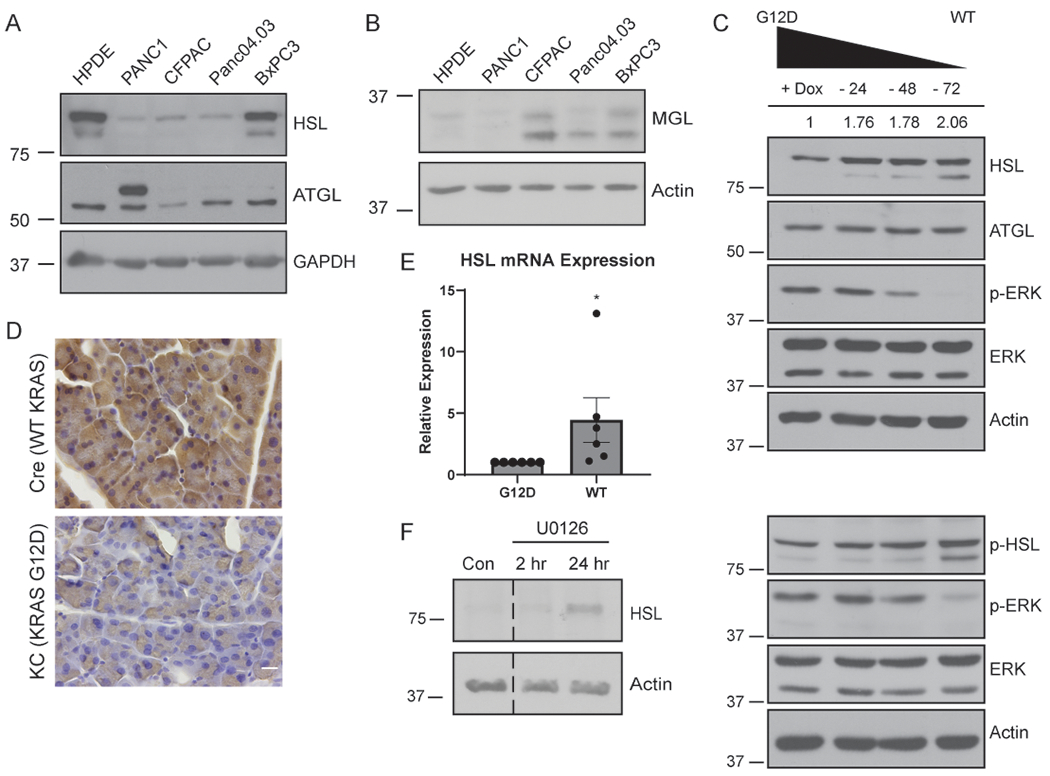
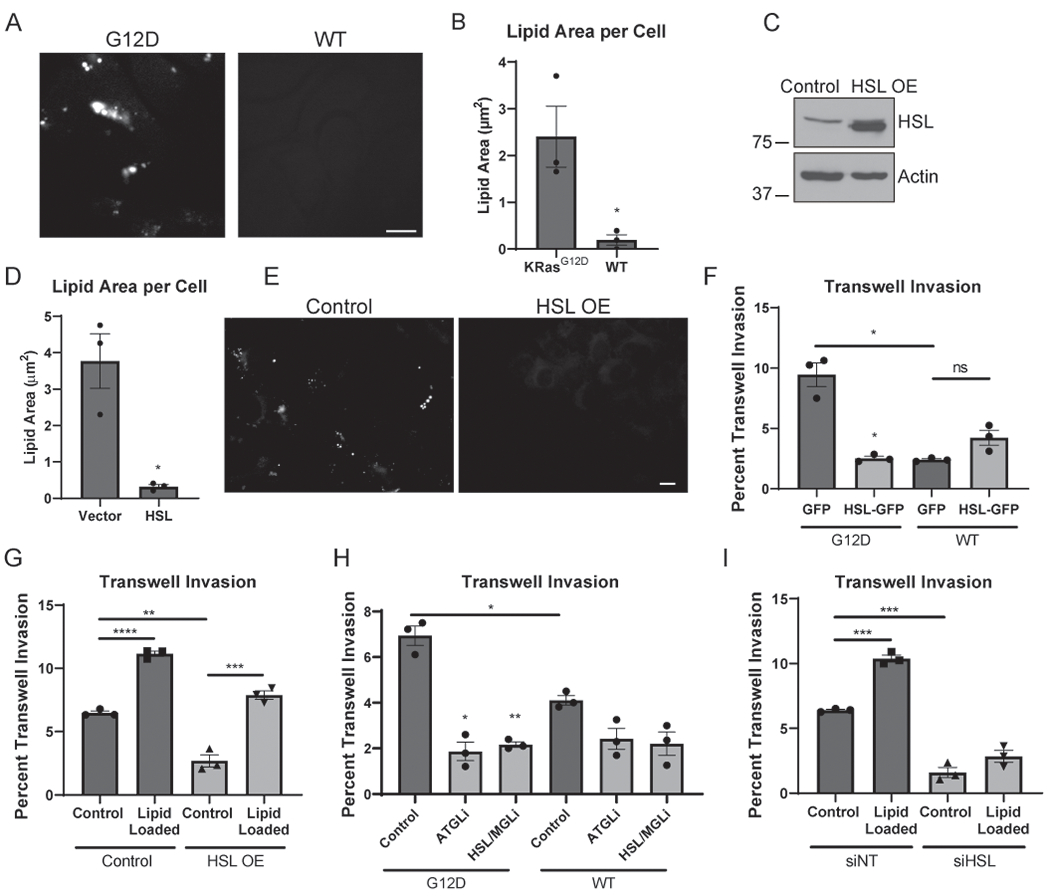
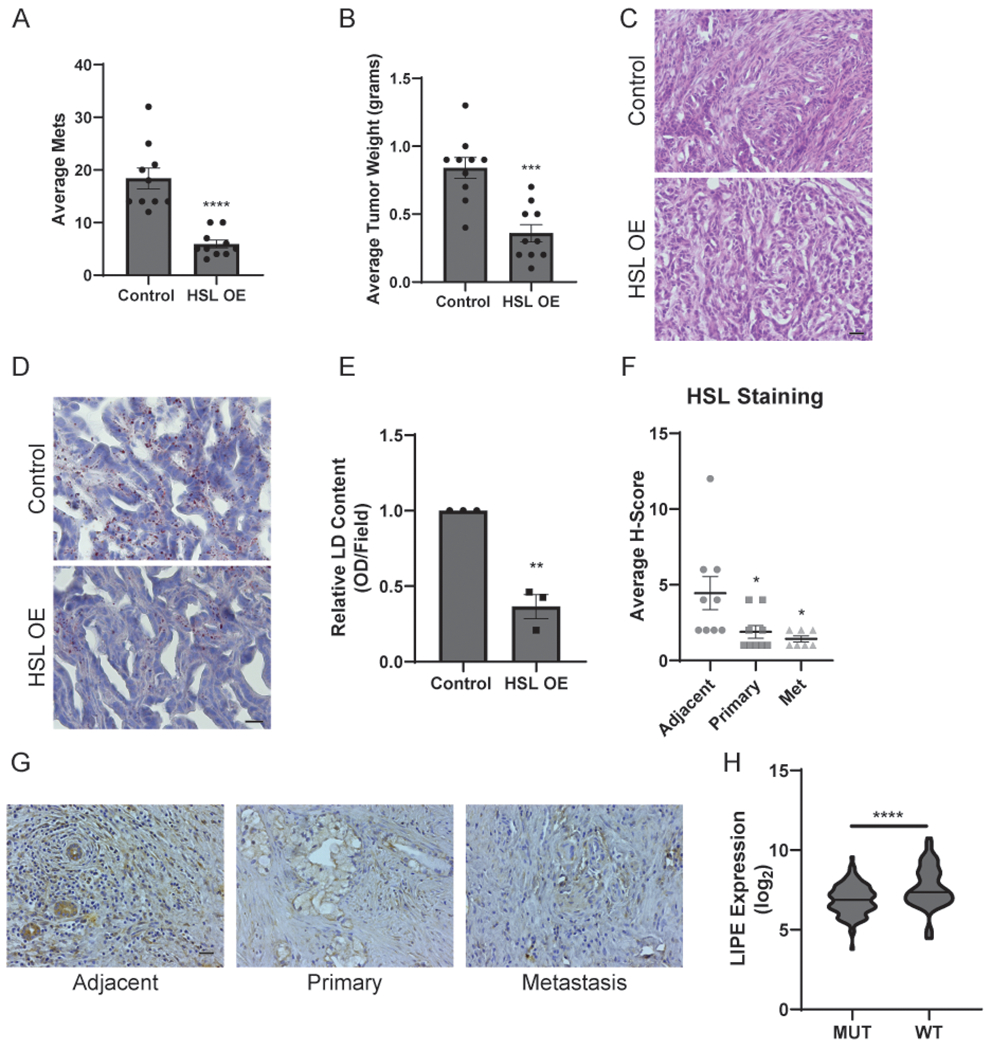
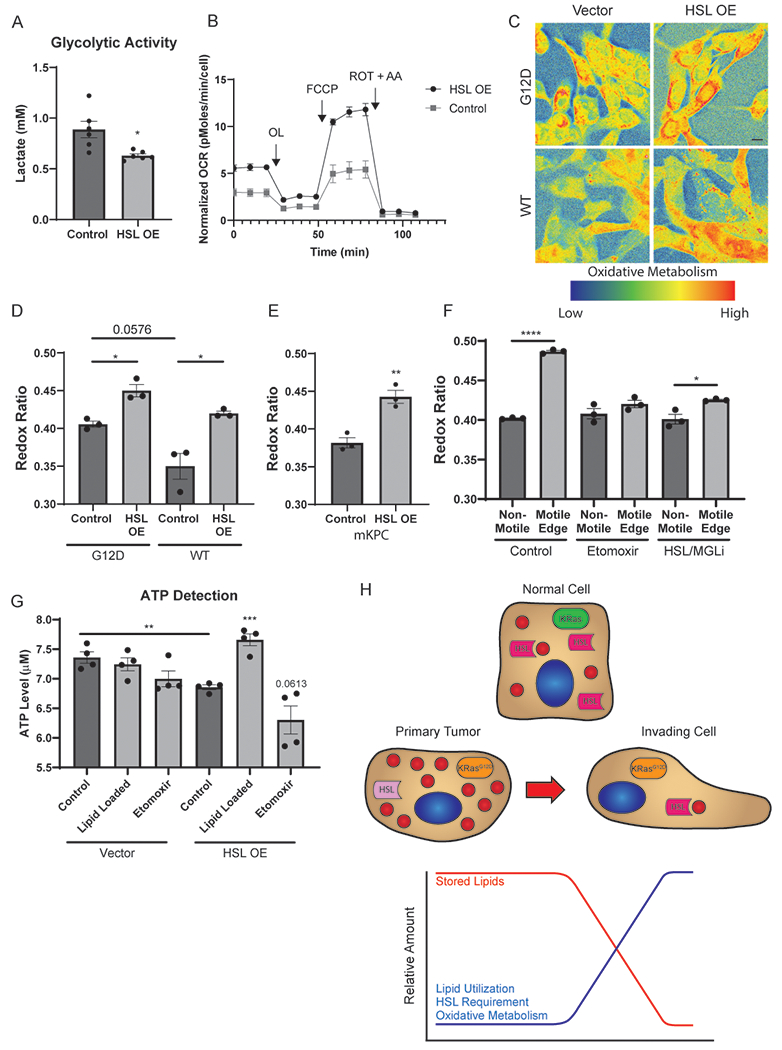
Oncogene-induced metabolic reprogramming is a hallmark of pancreatic cancer (PDAC), yet the metabolic drivers of metastasis are unclear. In PDAC, obesity and excess fatty acids accelerate tumor growth and increase metastasis. Here, we report that excess lipids, stored in organelles called lipid droplets (LD), are a key resource to fuel the energy-intensive process of metastasis. The oncogene KRAS controlled the storage and utilization of LD through regulation of hormone-sensitive lipase (HSL), which was downregulated in human PDAC. Disruption of the KRAS-HSL axis reduced lipid storage, reprogrammed tumor cell metabolism, and inhibited invasive migration in vitro and metastasis in vivo. Finally, microscopy-based metabolic analysis revealed that migratory cells selectively utilize oxidative metabolism during the process of migration to metabolize stored lipids and fuel invasive migration. Taken together, these results reveal a mechanism that can be targeted to attenuate PDAC metastasis. SIGNIFICANCE: KRAS-dependent regulation of HSL biases cells towards lipid storage for subsequent utilization during invasion of pancreatic cancer cells, representing a potential target for therapeutic intervention.See related commentary by Man et al., p. 4886.


Conflict of interest statement

Competing Interests Statement: The authors declare no potential conflicts of interest.

Figures

Figure 1.
Figure 1.
Excess lipid promotes PDAC invasion and migration through lipolysis. A, Control and oleic acid (OA) loaded (200 μM) mKPC cells were visualized by staining for LDs using Oil Red O (ORO). Scale bar, 10 μm. B, Quantitation of total LD area per cell from the conditions in (A). >125 cells scored in at least five fields for 3 independent biological replicates. C, Quantitation of distance migrated of control and OA-loaded mKPC cells in a wound healing assay over 12 hours. 10 measurements of three fields for 3 independent biological replicates represented. D, Quantitation of control and OA-loaded mKPC cells in a transwell invasion assay. Cells invaded for 16 hours through a Matrigel-coated filter toward high-serum media. >300 cells scored in each of 3 independent biological replicates. E, Quantitation of control and OA-loaded mKPC cell proliferation over the indicated number of days. 8 independent biological replicates, normalized to Day 1 for each experiment. F, Quantitation of control or drug-treated mKPC cells in a transwell invasion assay. Cells attached for 2 hours prior to drug treatment, and invaded for 14 hours. 10 μM Atglistatin (ATGLi) and 10 μM CAY 10499 (HSL/MGLi). >300 cells scored in each of 3 independent biological replicates. Graphs indicate mean ± SEM, analyzed by Student’s t-test. *p < 0.05, **p < 0.01, ***p < 0.001.
Figure 2.
Figure 2.
Lipid droplets are catabolized during invasive migration. A, Still images taken from Supplemental Video 1 depicting Panc04.03 cells at indicated time points migrating in a wound healing assay, with LDs visualized by BODIPY. Brightfield, lipid droplets (white), and composite images are shown. Scale bar, 10 μm. B, Representative images of LDs in mKPC cells in an invasion assay and pre-loaded with OA (200 μM). Non-Invasive cells (left) did not invade, whereas Invasive cells (right) did invade and were imaged on the bottom of the transwell. Cells were stained for nuclei (Hoechst, top) and LDs (ORO, bottom). Scale bar, 10 μm. C, Quantitation of lipid area per cell from (B). >50 cells scored in at least five fields from 6 independent biological replicates. D, Migration quantitation of control or etomoxir-treated (10 μM) mKPC cells. >10 measurements of 3 fields for 3 independent biological replicates shown. Graphs indicate mean ± SEM data, analyzed by Student’s t-test. **p < 0.01, ***p < 0.001.
Figure 3.
Figure 3.
HSL is regulated by oncogenic KRAS. A, Western blot of the indicated cells for HSL, ATGL, and GAPDH from whole-cell lysates. B, Western blot of the indicated cells for MGL and Actin. C, Western blot of HSL, phospho-HSL, ATGL, phospho-ERK, ERK, and Actin expression from whole-cell lysates. iKRAS cells were cultured in doxycycline, or with doxycycline withdrawn for 24, 48, or 72 hours prior to lysis. Quantitative densitometry values for HSL expression from blot shown (both bands) are indicated above. D, Immunohistochemistry for HSL expression in pancreatic tissue sections isolated from Ptf1a-Cre (Cre) or littermate Ptf1a-Cre driven KRASG12D (KC) mice. n=3 mice per condition. Scale bar, 10 μm. E, Relative HSL mRNA levels by quantitative RT-PCR from iKRAS cells cultured with doxycycline (G12D) or following 72 hour doxycycline withdrawal (WT). 3 technical replicates for 6 independent biological replicates shown. Data analyzed by Wilcoxon Signed Rank test. F, Western blot of mKPC cells treated with vehicle control (Con) or the MEK inhibitor U0126 for the indicated time. Blots are representative of three independent experiments. Graphs indicate mean ± SEM. *p < 0.05.
Figure 4.
Figure 4.
HSL regulates the invasive impact of oncogenic KRAS. A, Representative images of iKRAS cells cultured in doxycycline (KRASG12D) or following 72 hour doxycycline withdrawal (WT) and stained for LDs (ORO). Scale bar, 10 μm. B, Quantitation of total lipid droplet area per cell described in (A). >50 cells scored in each of five fields for 3 independent biological replicates. C, Western blot of HSL and Actin in mKPC whole-cell lysates constitutively overexpressing HSL or vector control. D, Quantitation of total lipid droplet area per cell of mKPC cells overexpressing HSL or a vector control. >75 cells scored in each of five fields for 3 independent biological replicates. E, Representative immunofluorescence images from cells described in (D) stained for LDs (ORO). Scale bar, 10 μm. F, Quantitation of iKRAS cells overexpressing GFP or HSL-GFP in the presence of doxycycline (G12D) or following 72 hour doxycycline withdrawal (WT) prior to seeding on a Matrigel-coated filter and allowed to invade for 16 hours. >40 cells scored in each of 3 independent biological replicates. G, Quantitation of mKPC overexpressing HSL or vector control and loaded with 200 μM BSA-conjugated OA or BSA control prior to invasion for 16 hours. >245 cells scored in each of 3 independent biological replicates. H, Quantitation of iKRAS cells cultured in the presence of doxycycline (G12D) or following 72 hour doxycycline withdrawal (WT) prior to seeding on a Matrigel-coated filter and allowed to invade. Cells attached for 2 hours prior to drug treatment, and invaded for 14 hours. 10 μM Atglistatin (ATGLi) and 10 μM CAY 10499 (HSL/MGLi) were used. >220 cells scored in each of 3 independent biological replicates. I, mKPC cells transfected with siRNA targeting HSL and loaded with 200μM BSA-conjugated OA or BSA control prior to seeding on a Matrigel-coated filter and invading for 16 hours. >260 cells scored in each of 3 independent biological replicates. Graphs indicate mean ± SEM and analyzed by Student’s t-test. *p < 0.05, **p < 0.01, ***p < 0.001, ****p < 0.0001.
Figure 5.
Figure 5.
HSL regulates metastasis in vivo. A, The average total number of metastases from C57BL/6 mice following pancreatic orthotopic injections with mKPC cells constitutively overexpressing HSL or a vector control. n=10 mice per group. B, Average weights of the primary tumors isolated from the experiment described in (A). C, H&E staining of primary tumor sections isolated from the experiment described in (A). Scale bar, 20 μm. D, LD staining of primary tumor sections isolated from the experiment described in (A) using ORO and Hematoxylin as counterstain. Scale bar, 10 μm. E, Quantitation of histological sections stained for lipid droplets and depicted in (D). Data represent the relative change in the optical density (OD) of lipid content visualized by ORO staining in three distinct fields from 3 independent biological replicates. F, Immunohistochemistry analysis of patient-matched human pancreatic tissue sections stained for HSL. Data represent adjacent normal, primary tumor, and metastatic tissues isolated from each patient. G, Representative immunohistochemistry images of the tissues described in (F). Scale bar, 20 μm. Graphs indicate mean ± SEM and analyzed by Student’s t-test. H, Analysis of the TCGA-Pancreatic Cancer dataset comparing LIPE (HSL) gene expression in tumors with wild-type or mutant KRAS. Mean log2 expression values are indicated by a dashed line and significance was determined by a Mann-Whitney U test. *p < 0.05, **p < 0.01, ***p < 0.001, ****p < 0.0001.
Figure 6.
Figure 6.
HSL shifts PDAC cells to oxidative metabolism. A, Analysis of glycolytic activity determined by lactate production of mKPC cells overexpressing HSL or a vector control. Data represent 6 independent biological replicates. B, Quantitation of the normalized oxygen consumption rate (OCR) of mKPC cells overexpressing HSL or a vector control via Seahorse metabolic analysis. Data represent 3 independent biological replicates. C, Representative composite images of the optical redox ratio of iKRAS cells overexpressing HSL or vector control. Cells were cultured in the presence of doxycycline (G12D) or following a 72 hour withdrawal of doxycycline (WT) prior to imaging. Scale bar, 10 μm. D, Optical redox ratio quantitation of the conditions depicted in (B). >40 cells scored in each of five fields for 3 independent biological replicates. E, Optical redox ratio quantitation of mKPC cells overexpressing HSL or vector control. >40 cells scored in each of five fields for 3 independent biological replicates. F, Optical redox ratio quantitation of mKPC cells in a wound healing assay. Cells were treated with DMSO (control), 10 μM Etomoxir, or CAY 10499 (HSL/MGLi) for 4 hours prior to imaging. Cells on the edge of the wound were classified as “Motile Edge” whereas cells at least 4 frames away from the edge were classified as “Non-Motile.” >35 cells scored in each of five fields for 3 independent biological replicates shown. G, mKPC cells treated with 200 μM OA, 10 μM Etomoxir, or grown under control conditions prior to lysis and use in an ATP Detection assay. H, Representation of lipid storage and catabolism during metastatic invasion. Graphs indicate mean ± SEM and analyzed by Student’s t-test. *p < 0.05, **p < 0.01, ***p<0.001, ****p < 0.0001.

Comment in

Comment on

Similar articles

Cited by

References

    1. Sleeman J, Steeg PS. Cancer metastasis as a therapeutic target. Eur J Cancer 2010;46:1177–80 - PMC - PubMed
    1. Chaffer CL, Weinberg RA. A perspective on cancer cell metastasis. Science 2011;331:1559–64 - PubMed
    1. Sahai E Illuminating the metastatic process. Nat Rev Cancer 2007;7:737–49 - PubMed
    1. Ganapathy-Kanniappan S, Geschwind JF. Tumor glycolysis as a target for cancer therapy: progress and prospects. Mol Cancer 2013;12:152. - PMC - PubMed
    1. Elia I, Doglioni G, Fendt SM. Metabolic Hallmarks of Metastasis Formation. Trends Cell Biol 2018;28:673–84 - PubMed

Publication types