. 2020 Oct 14;94(21):e01367-20.
doi: 10.1128/JVI.01367-20. Print 2020 Oct 14.

Severe Human Lassa Fever Is Characterized by Nonspecific T-Cell Activation and Lymphocyte Homing to Inflamed Tissues

Affiliations

Severe Human Lassa Fever Is Characterized by Nonspecific T-Cell Activation and Lymphocyte Homing to Inflamed Tissues

Julia R Port et al. J Virol. .

Abstract

Lassa fever (LF) is a zoonotic viral hemorrhagic fever caused by Lassa virus (LASV), which is endemic to West African countries. Previous studies have suggested an important role for T-cell-mediated immunopathology in LF pathogenesis, but the mechanisms by which T cells influence disease severity and outcome are not well understood. Here, we present a multiparametric analysis of clinical immunology data collected during the 2017-2018 Lassa fever outbreak in Nigeria. During the acute phase of LF, we observed robust activation of the polyclonal T-cell repertoire, which included LASV-specific and antigenically unrelated T cells. However, severe and fatal LF cases were characterized by poor LASV-specific effector T-cell responses. Severe LF was also characterized by the presence of circulating T cells with homing capacity to inflamed tissues, including the gut mucosa. These findings in LF patients were recapitulated in a mouse model of LASV infection, in which mucosal exposure resulted in remarkably high lethality compared to skin exposure. Taken together, our findings indicate that poor LASV-specific T-cell responses and activation of nonspecific T cells with homing capacity to inflamed tissues are associated with severe LF.IMPORTANCE Lassa fever may cause severe disease in humans, in particular in areas of endemicity like Sierra Leone and Nigeria. Despite its public health importance, the pathophysiology of Lassa fever in humans is poorly understood. Here, we present clinical immunology data obtained in the field during the 2018 Lassa fever outbreak in Nigeria indicating that severe Lassa fever is associated with activation of T cells antigenically unrelated to Lassa virus and poor Lassa virus-specific effector T-cell responses. Mechanistically, we show that these bystander T cells express defined tissue homing signatures that suggest their recruitment to inflamed tissues and a putative role of these T cells in immunopathology. These findings open a window of opportunity to consider T-cell targeting as a potential postexposure therapeutic strategy against severe Lassa fever, a hypothesis that could be tested in relevant animal models, such as nonhuman primates.

Keywords: Lassa fever; Lassa virus; T cells; T-cell homing; host response; pathogenesis; viral hemorrhagic fever.


Figures

FIG 1
FIG 1
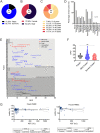
Patient demographics and clinical symptoms. (A to C) Outcome (n = 214) (A), gender (n = 129) (B), and age (n = 63) (C) distributions of patients admitted to the Lassa ward during the study period. Distributions of patients in population are shown as the percentages of the total cohort. Pie chart colors are described in keys below. (D) Symptoms of patients (n = 136) admitted to the Lassa ward. (E) PBMCs in whole-blood samples were analyzed in the field for 36 patients for phenotypical assessment and for 13 patients for assessment of the T-cell response, and for 22 acute patients, cryopreserved samples were analyzed phenotypically. The graph depicts patients and dates of sample collection according to the self-reported days postonset (DPOs). NA, not answered. (F) DPOs of patients at the time of sample collection were compared between patient groups with different outcomes. Violin plots depict individual samples, sample distributions, median values, and quartiles. ns, not significant (Kruskal-Wallis, followed by Dunn’s). (G) Viability of all fresh and frozen PBMC samples was assessed in relation to the corresponding aspartate transaminase (AST) serum levels (U/liter). Panels depict results for individual samples (fresh and frozen) and linear regression lines with 95% confidence intervals (dashed).
FIG 2
FIG 2
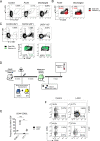
T-cell activation during acute Lassa fever (LF). (A) HLA-A2 tetramers labeled with two fluorophores (T1 and T2, respectively) were utilized to track epitope-specific CD8 T cells during acute LF. The plots show results for pooled (concatenated) samples from LF patients (n = 3) collected during the acute phase of LF or after discharge. (B) Overlay plots showing Lassa virus (LASV) epitope-specific CD8 T cells (red) plotted over the total activated (CD38+ HLA-DR+) population. (C) Epstein-Barr virus (EBV)-specific CD8 T cells were identified in acute LF patients through the use of tetramers labeled with two fluorophores (T1 EBV and T2 EBV). Plots show tetramer staining in negative control (LASV A2) and uninfected control (LASV A2+) and a representative acute HLA-A2+ LF patient (n = 2) (LASV+ A2+). Bottom plots show overlay of EBV-specific CD8 T cells over total activated CD8 T cells. (D) Mixed CD45.1 (WT) and OT-I bone marrow chimeras were generated and infected intranasally with 1,000 focus-forming units (FFU) LASV as depicted in the schematic. IFNAR, IFN-α/β receptor. (E) Frequencies (%) of effector cells (CD44+ CD62L) are shown for CD8 T cells isolated from mouse peripheral blood mononuclear cells (PBMCs) 9 days after infection (LASV) compared to the CD8 T cells from PBMCs of uninfected mice (control) for both CD45.1 (WT) and OT-1 cells. Violin plots depict individual samples, sample distributions, median values, and quartiles. Statistical significance was determined by 2-way analysis of variance (ANOVA) followed by Sidak’s multiple-comparison test, and significance levels are presented as follows: ns, P > 0.05 (not significant); *, P ≤ 0.05; **, P ≤ 0.01; ***, P ≤ 0.001; ****, P ≤ 0.0001. (F) Representative plots are shown depicting effector CD8 T cells (CD44+ CD62L) for infected (LASV) and uninfected (control) mice.
FIG 3
FIG 3
Clonal repertoires and effector T-cell responses in Lassa fever (LF) patients. (A) Cross-sectional T-cell repertoire diversity in LF survivors (n = 28) and fatal cases (n = 10) was analyzed by TCR sequencing and is represented as the inverse of Simpson’s index (InvSimp). Violin plots depict individual samples, sample distributions, median values, and quartiles. Statistical significance was determined using the Mann-Whitney test, and significance levels are presented as follows: ns, P > 0.05 (not significant); *, P ≤ 0.05; **, P ≤ 0.01; ***, P ≤ 0.001; ****, P ≤ 0.0001. (B) Longitudinal evaluation of hyperexpanded clones (see clonal space definitions in Materials and Methods) in n = 120 samples collected from survivors and n = 22 samples collected from nonsurviving patients. Individual samples and trend lines are depicted. ns, not significant (Spearman’s correlation analysis); DPO, days postonset. (C) Pie chart depicting the percentages of patient samples (n = 26) that showed effector response capacity as indicated by production of cytokines interferon gamma (IFN-γ) and tumor necrosis factor alpha (TNF-α) and degranulation marker CD107a/LAMP-1 in response to peptide stimulation. (D) Graphs representing cytokine responses of CD8 T cells in LF patients stimulated with Lassa virus (LASV) peptide pools. Cytokine responses and degranulation are reported across ranges of patient levels of serum aspartate transaminase (AST) (U/liter) (n = 21). Violin plots depict individual samples, sample distributions, median values, and quartiles. ns, not significant (Kruskal-Wallis followed by Dunn’s). (E) Cytokine responses and degranulation are reported across cycle threshold (CT) values as a readout of patient viremia (n = 20). Results for individual samples are depicted.
FIG 4
FIG 4
T-cell homing in human LF. (A) Freshly isolated patient PBMCs were analyzed by flow cytometry, and activated (CD38+ HLA-DR+) CD8 T cells from LF patients were analyzed for expression of the T-cell homing factors ITGB7, ITGA4, ITGB1 (n = 25), CCR3 (n = 16), and CLA (n = 61). Violin plots depict individual samples, sample distributions, median values, and quartiles. Statistical significance was determined using the Kruskal-Wallis test followed by Dunn’s posttest, and significance levels are presented as follows: ns, P > 0.05 (not significant); *, P ≤ 0.05; **, P ≤ 0.01; ***, P ≤ 0.001; ****, P ≤ 0.0001. (B) Principal-component analysis (PCA) of T-cell homing markers in the activated compartment (CD38+ HLA-DR+) of CD4 and CD8 T cells in cryopreserved patient samples (n = 54). Clustering of samples was based on hierarchical analysis to identify main subsets. (C) CFR for each cluster was calculated based on outcome of disease of the corresponding patient linked to each sample. Dim, dimension; C, cluster; CFR, case fatality ratio.
FIG 5
FIG 5
T-cell populations in LF patients. (A) Activated (CD38+ HLA-DR+) CD8+ and CD4+ T cells were concatenated across all patient samples (n = 54). t-Distributed stochastic neighboring embedding (t-SNE) was calculated on the expression of homing markers CLA, CCR3, CCR4, CCR7, ITGA4, ITGA1, ITGAE, and ITGB7 and expression of CD45RA. Outcome-based population analysis was performed by automated density-based gating. Numbers indicate T-cell subsets identified in the t-SNE analysis. (B) For each identified population, the percentage (%) of contribution from each outcome was verified, and the expression frequency (%) of each marker is shown according to the color key on the right. CCR, chemokine receptor; CLA, cutaneous lymphocyte antigen; ITG, integrin.
FIG 6
FIG 6
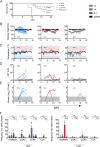
Route-dependent LF severity in mice. (A) IFNARB6 chimeras were infected with 1,000 FFU of LASV either i.n., p.o., or i.d. Uninfected mice served as the control. Survival is shown in Kaplan-Meier curves. Statistical evaluation was performed via Mantel-Cox test. DPI, days postinfection. (B to E) Longitudinal analysis of morbidity parameters in IFNARB6 chimeras infected with LASV via different routes, including relative weight loss (B), fluctuations in body temperature (C), levels of serum aspartate transaminase (AST) (D), and viremia (E). FFU, focus-forming units. (F) Frequencies of homing markers in peripheral blood cells were analyzed for each infection route 9 days postinfection by flow cytometry on effector (CD44+ CD62L) CD4 and CD8 T cells. For data shown in panels B to F, statistical significance was determined using two-way ANOVA, followed by Dunnett’s multiple-comparison test. Across the figure, significance levels are presented as follows: ns, P > 0.05 (not significant); *, P ≤ 0.05; **, P ≤ 0.01; ***, P ≤ 0.001; ****, P ≤ 0.0001. In panel C, shaded areas highlight body temperature extremes due to fever (red, >37.4°C; gray, <33°C). In panels D and E, shaded areas (gray) mark limits of detection. i.n., intranasal; i.d., intradermal; p.o., oral. Throughout the figure, inoculation routes are color coded as shown next to panel A.

References

    1. McCormick JB, Webb PA, Krebs JW, Johnson KM, Smith ES. 1987. A prospective study of the epidemiology and ecology of Lassa fever. J Infect Dis 155:437–444. doi:10.1093/infdis/155.3.437. - DOI - PubMed
    1. Lecompte E, Fichet-Calvet E, Daffis S, Koulemou K, Sylla O, Kourouma F, Doré A, Soropogui B, Aniskin V, Allali B, Kouassi Kan S, Lalis A, Koivogui L, Günther S, Denys C, ter Meulen J. 2006. Mastomys natalensis and Lassa fever, West Africa. Emerg Infect Dis 12:1971–1974. doi:10.3201/eid1212.060812. - DOI - PMC - PubMed
    1. Ogbu O, Ajuluchukwu E, Uneke CJ. 2007. Lassa fever in West African sub-region: an overview. J Vector Borne Dis 44:1–11. - PubMed
    1. Ajayi NA, Nwigwe CG, Azuogu BN, Onyire BN, Nwonwu EU, Ogbonnaya LU, Onwe FI, Ekaete T, Günther S, Ukwaja KN. 2013. Containing a Lassa fever epidemic in a resource-limited setting: outbreak description and lessons learned from Abakaliki, Nigeria (January-March 2012). Int J Infect Dis 17:e1011–e1016. doi:10.1016/j.ijid.2013.05.015. - DOI - PubMed
    1. Kafetzopoulou LE, Pullan ST, Lemey P, Suchard MA, Ehichioya DU, Pahlmann M, Thielebein A, Hinzmann J, Oestereich L, Wozniak DM, Efthymiadis K, Schachten D, Koenig F, Matjeschk J, Lorenzen S, Lumley S, Ighodalo Y, Adomeh DI, Olokor T, Omomoh E, Omiunu R, Agbukor J, Ebo B, Aiyepada J, Ebhodaghe P, Osiemi B, Ehikhametalor S, Akhilomen P, Airende M, Esumeh R, Muoebonam E, Giwa R, Ekanem A, Igenegbale G, Odigie G, Okonofua G, Enigbe R, Oyakhilome J, Yerumoh EO, Odia I, Aire C, Okonofua M, Atafo R, Tobin E, Asogun D, Akpede N, Okokhere PO, Rafiu MO, Iraoyah KO, Iruolagbe CO, Akhideno P, Erameh C, Akpede G, et al. . 2019. Metagenomic sequencing at the epicenter of the Nigeria 2018 Lassa fever outbreak. Science 363:74–77. doi:10.1126/science.aau9343. - DOI - PMC - PubMed

Publication types

MeSH terms