. 2020 Aug 18;3(10):e202000772.
doi: 10.26508/lsa.202000772. Print 2020 Oct.

DDX5 promotes oncogene C3 and FABP1 expressions and drives intestinal inflammation and tumorigenesis

Affiliations

DDX5 promotes oncogene C3 and FABP1 expressions and drives intestinal inflammation and tumorigenesis

Nazia Abbasi et al. Life Sci Alliance. .

Abstract

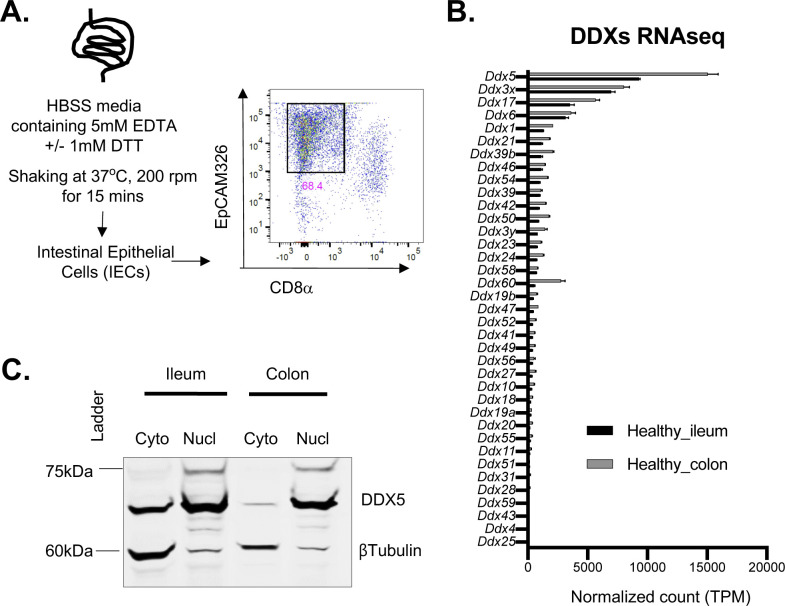
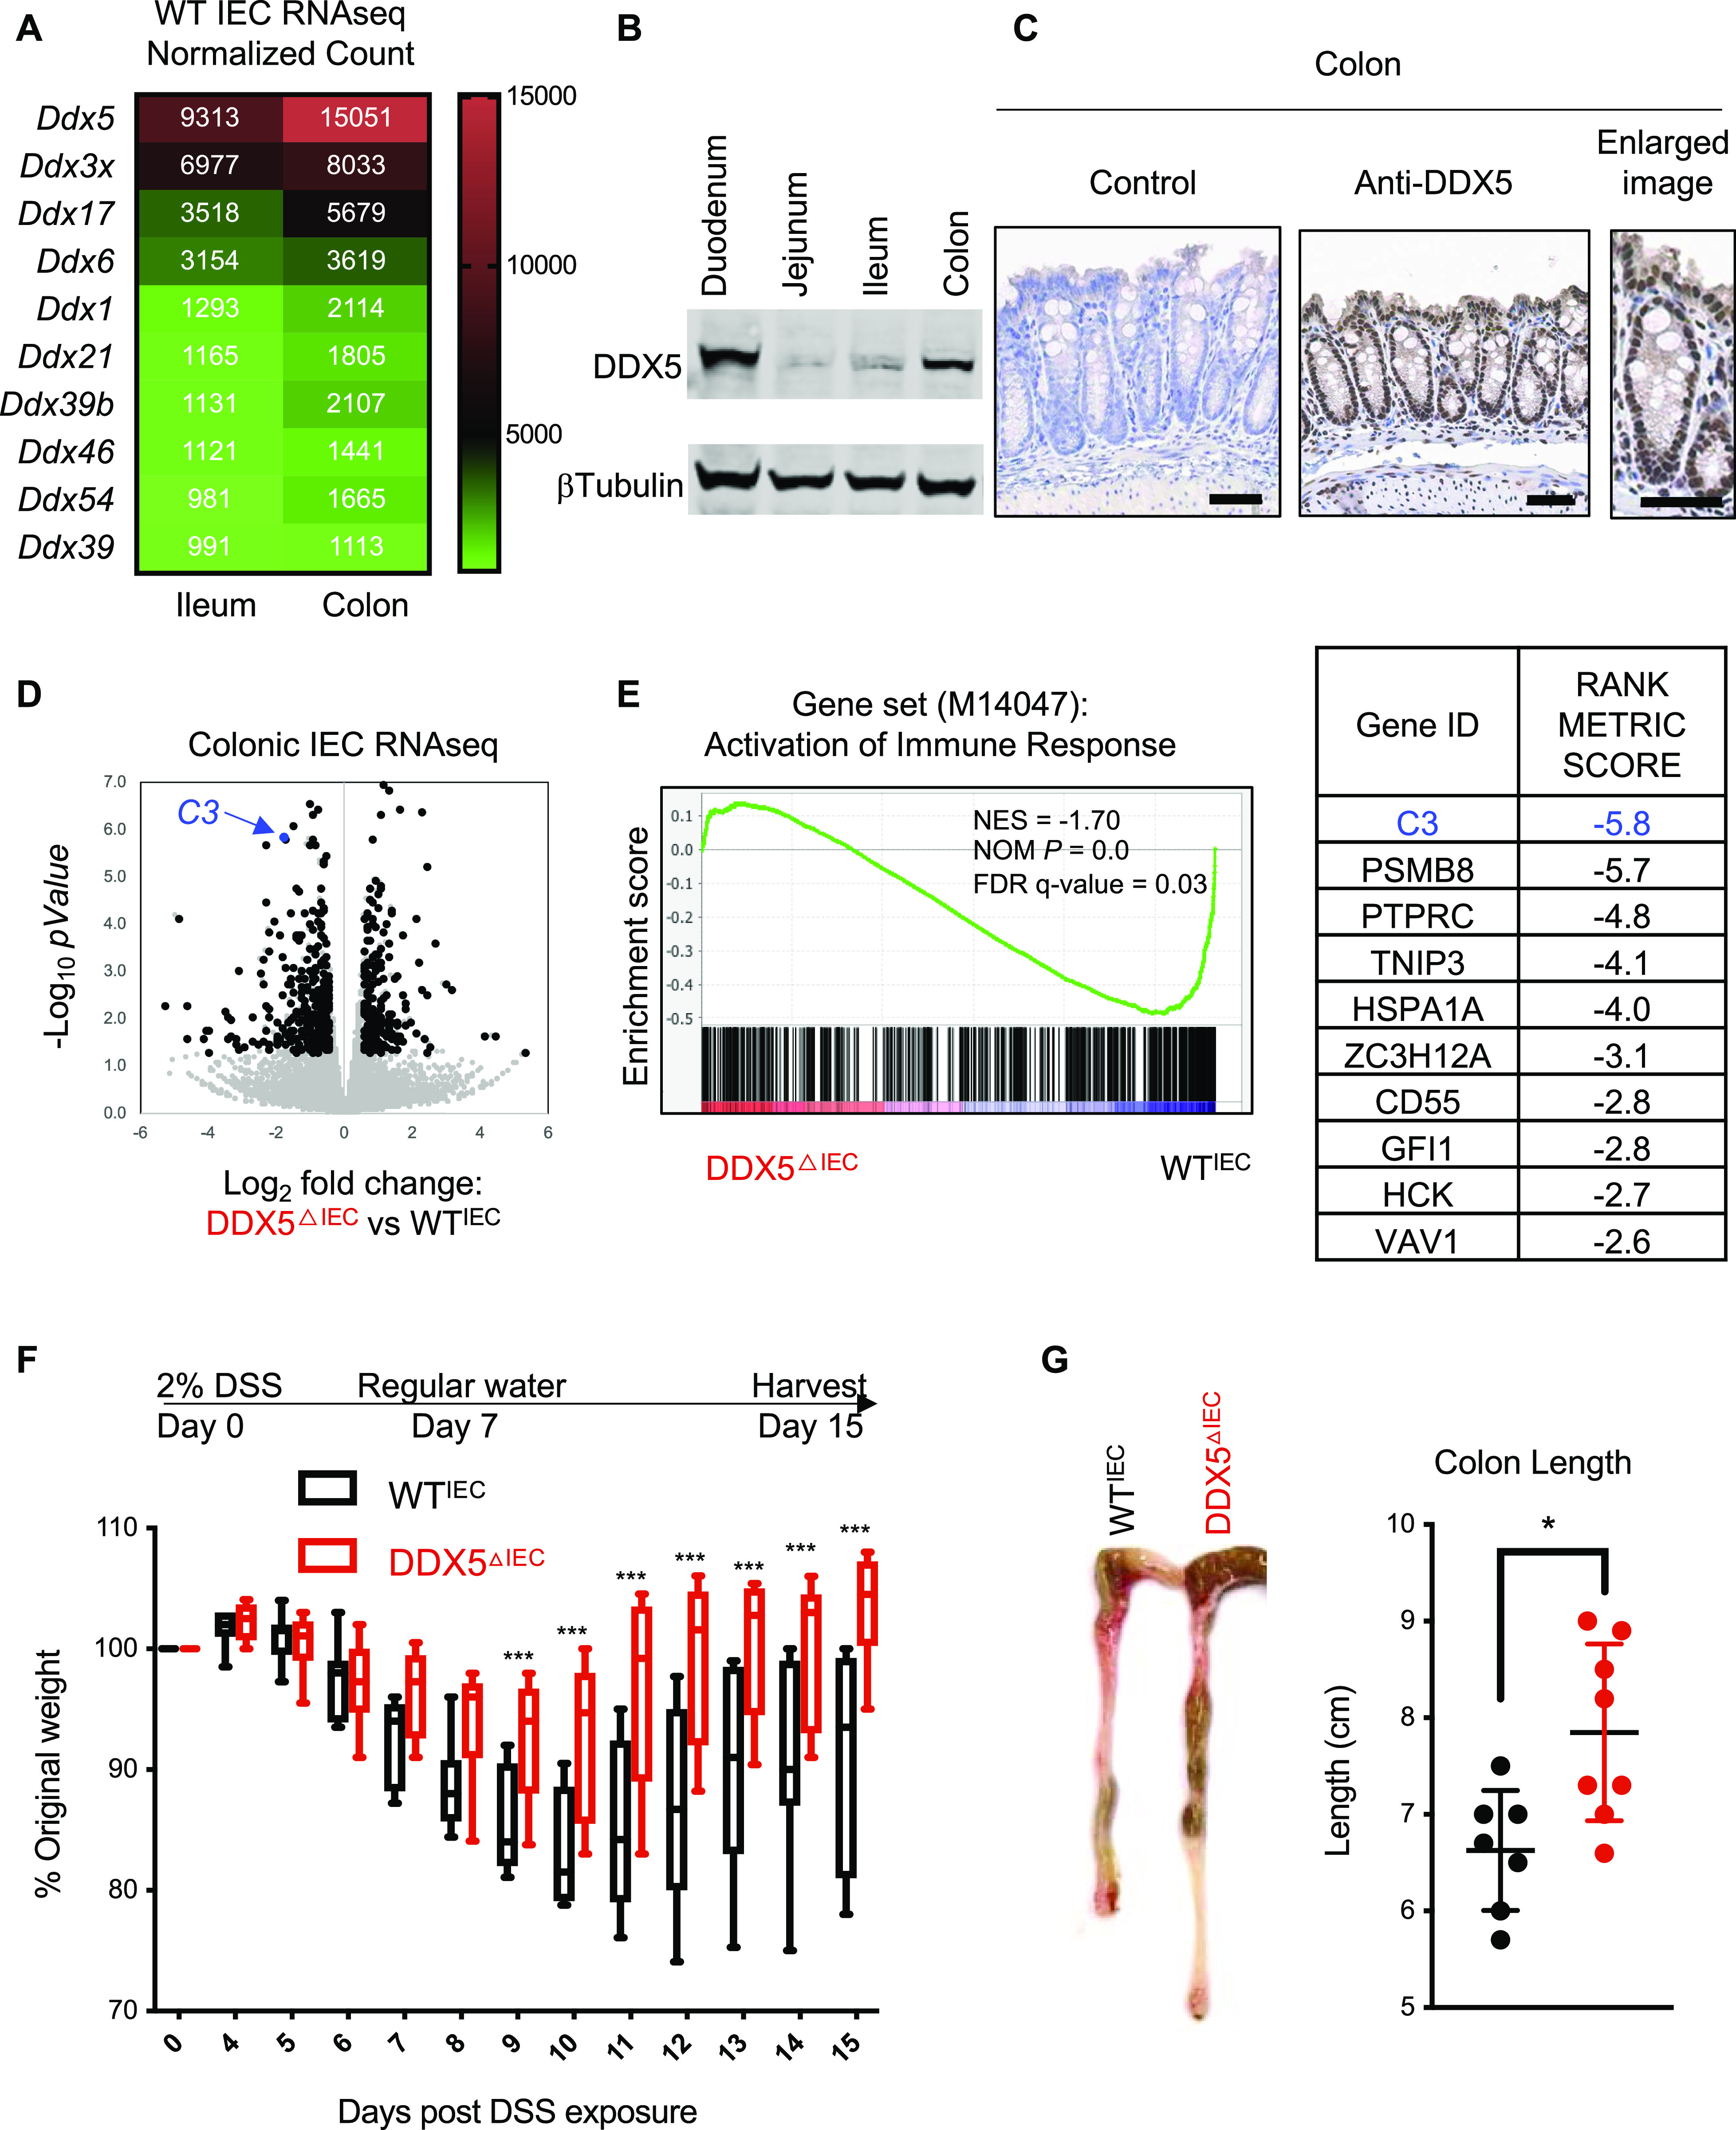
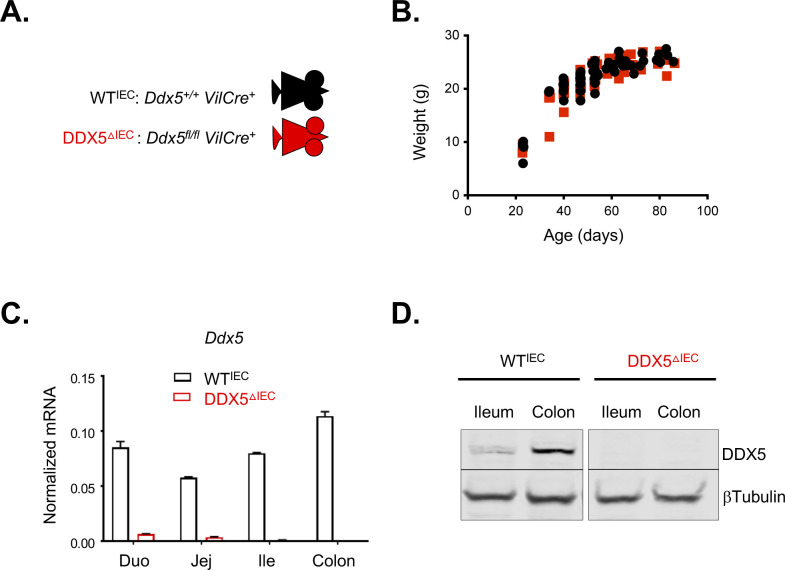
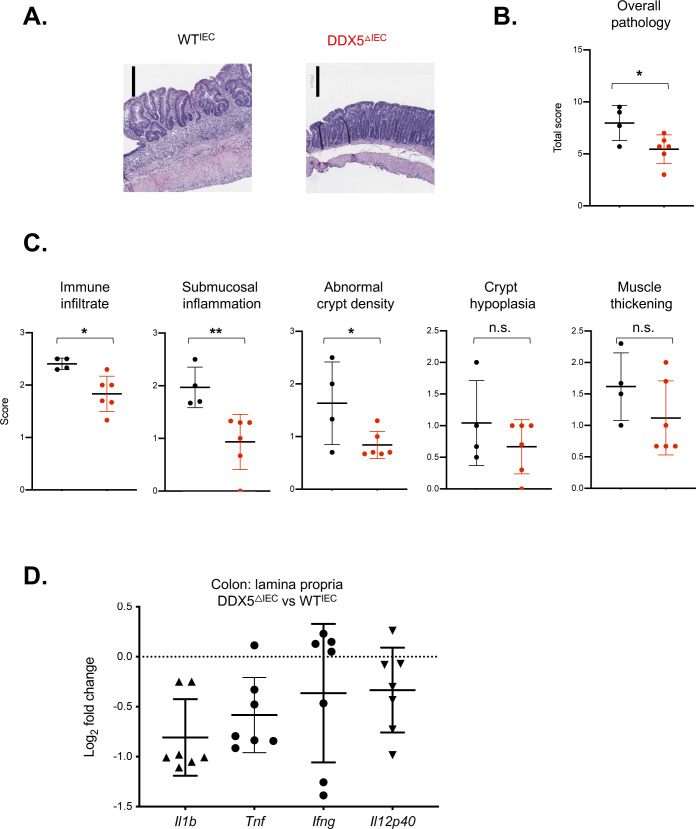
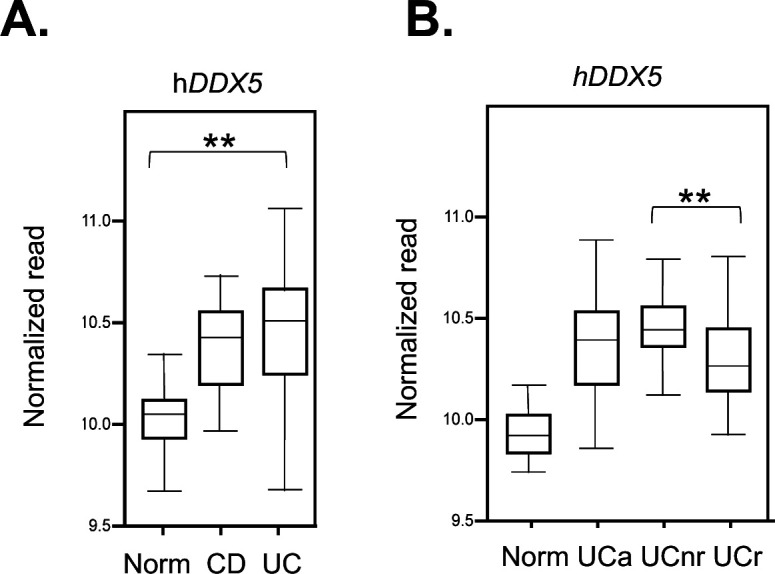
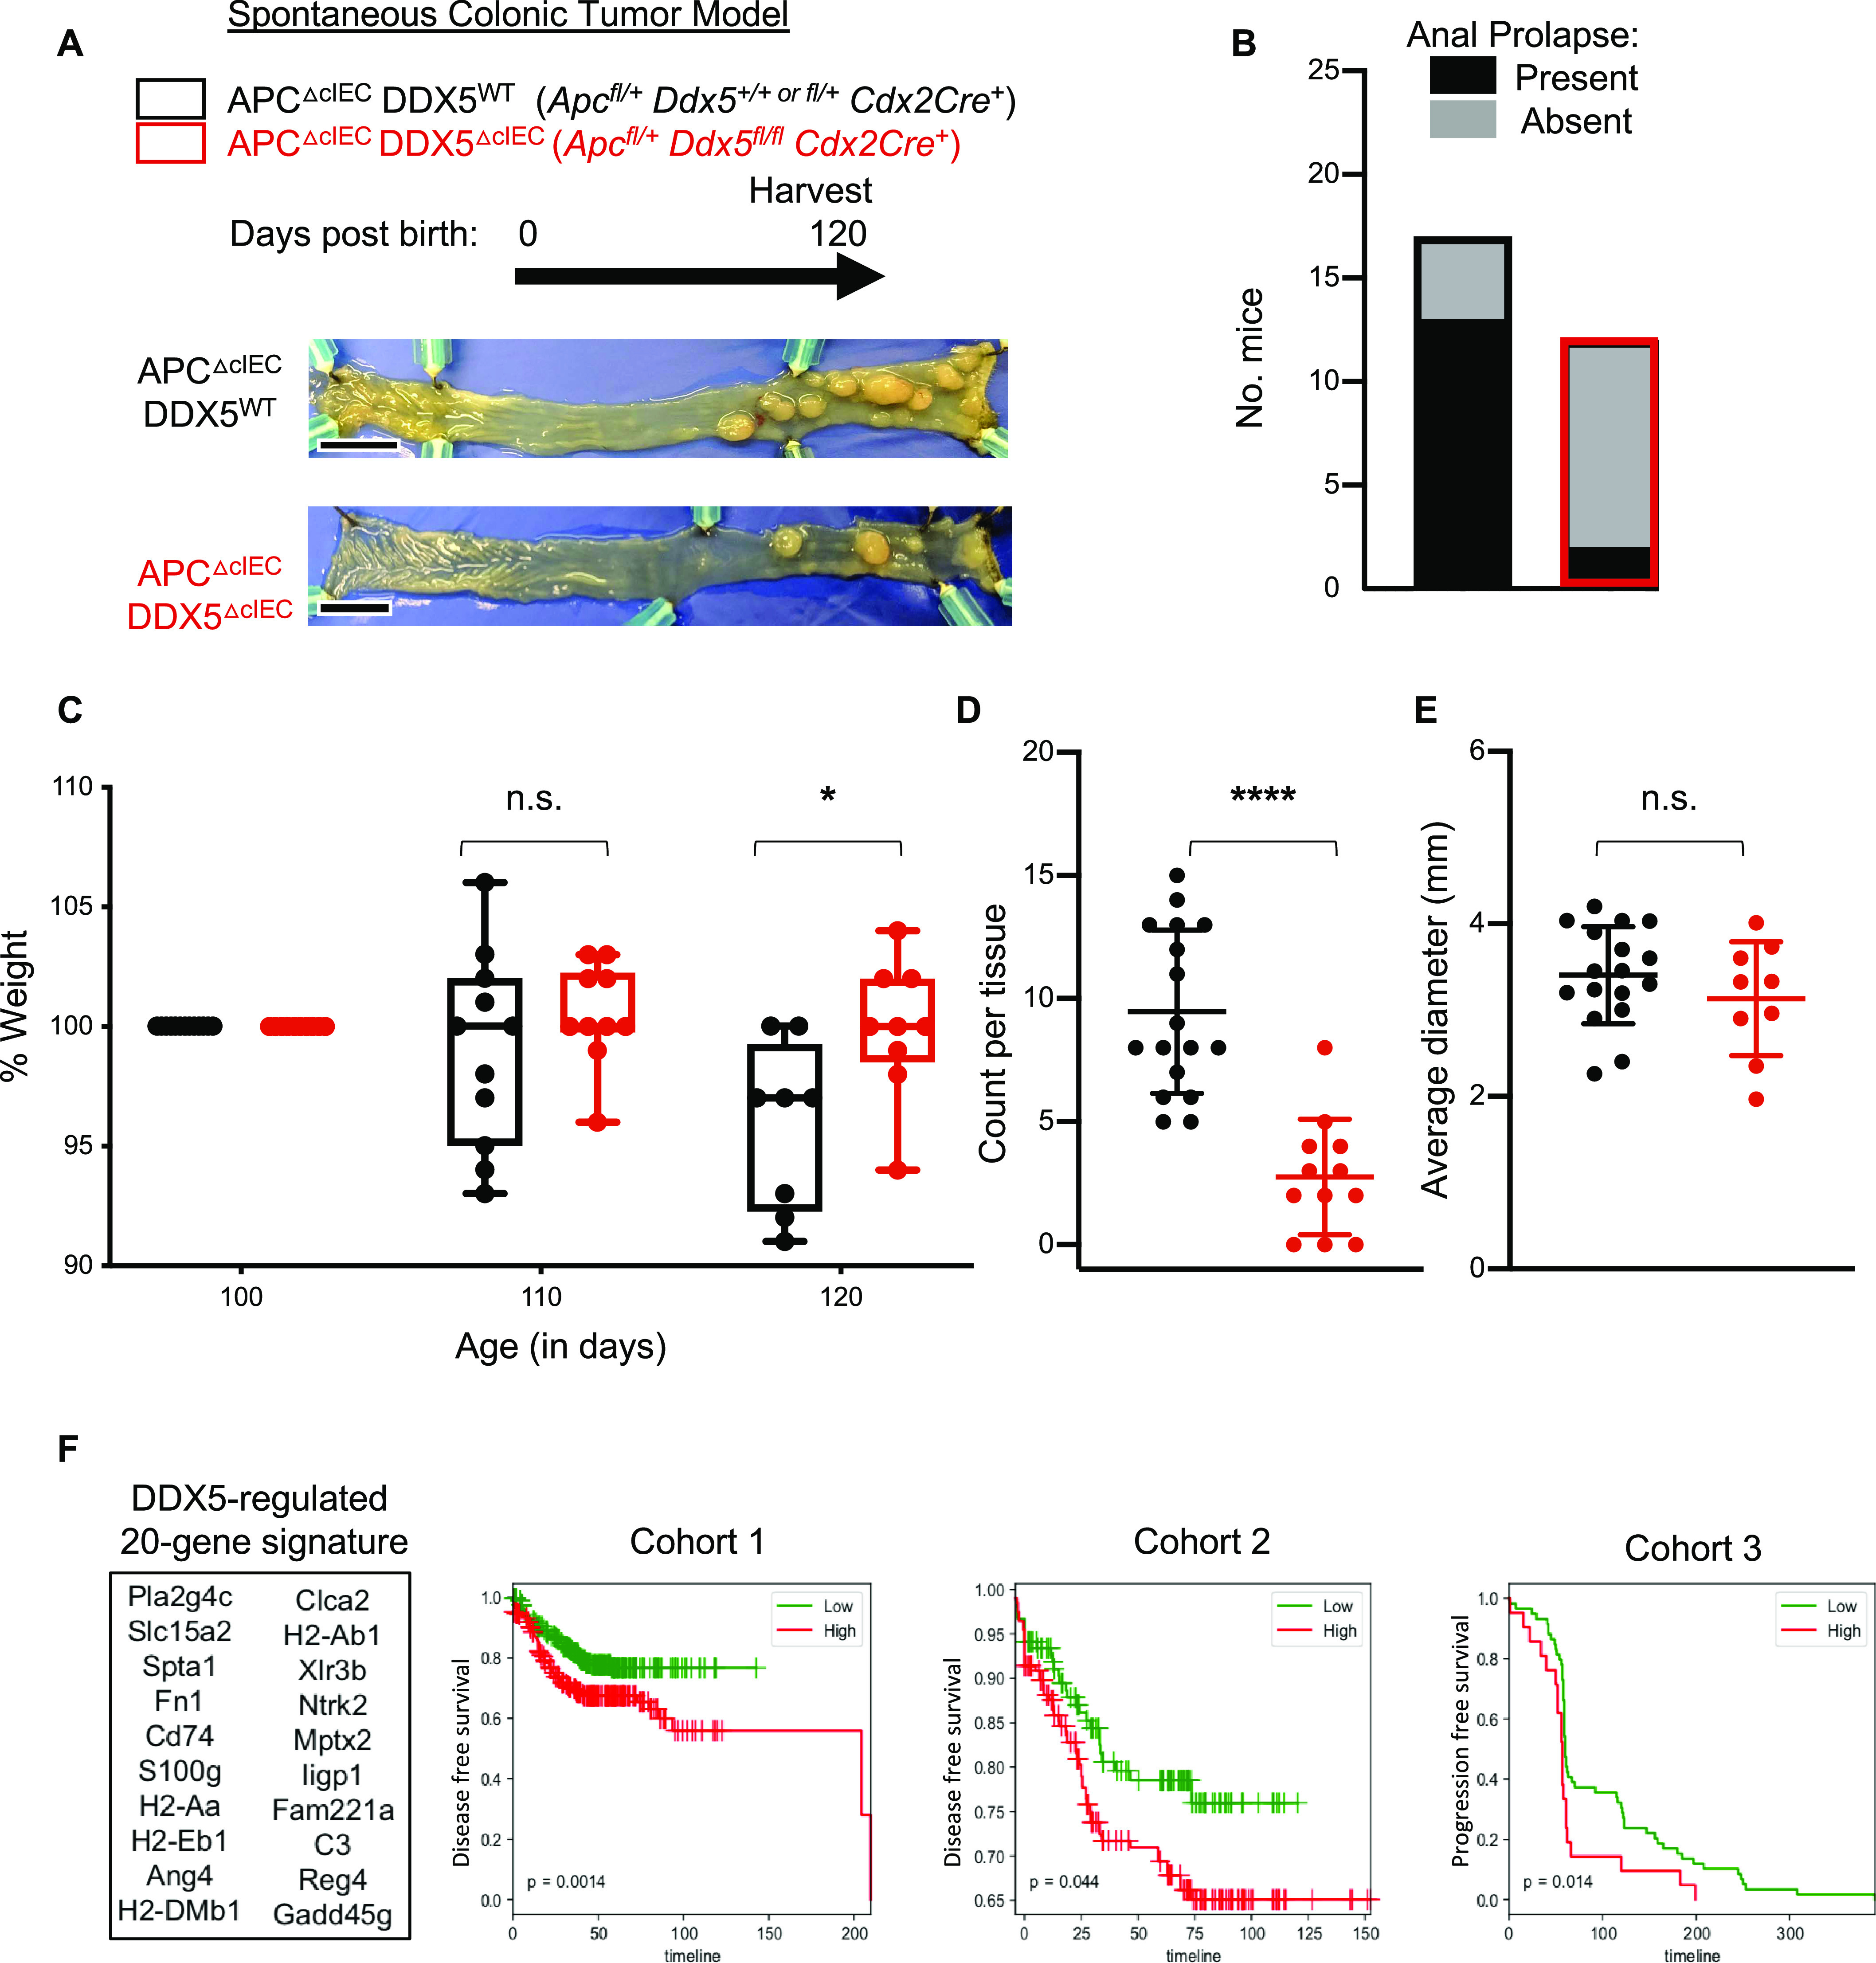
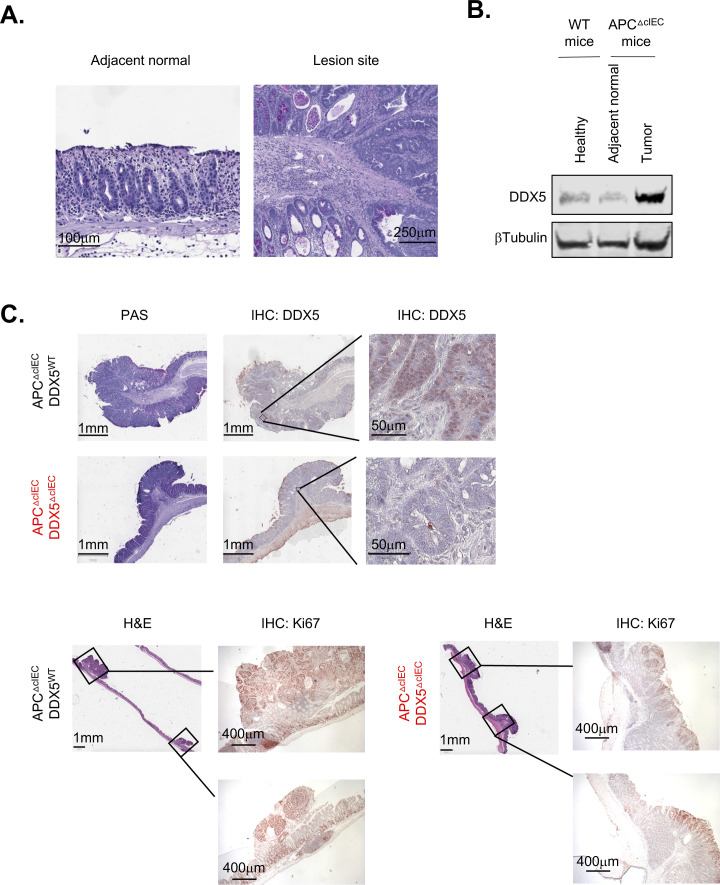
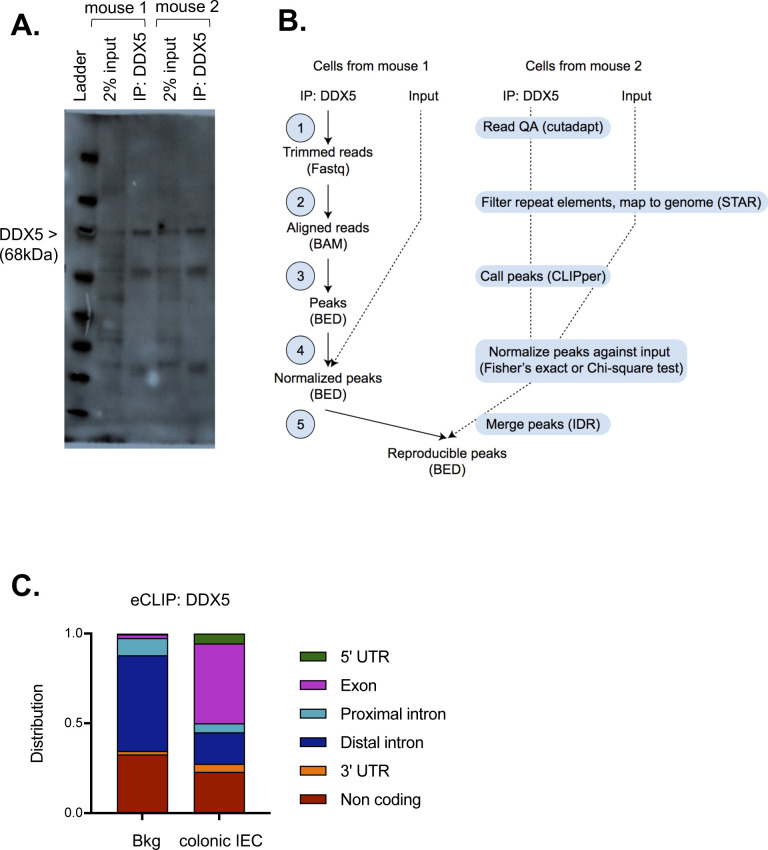
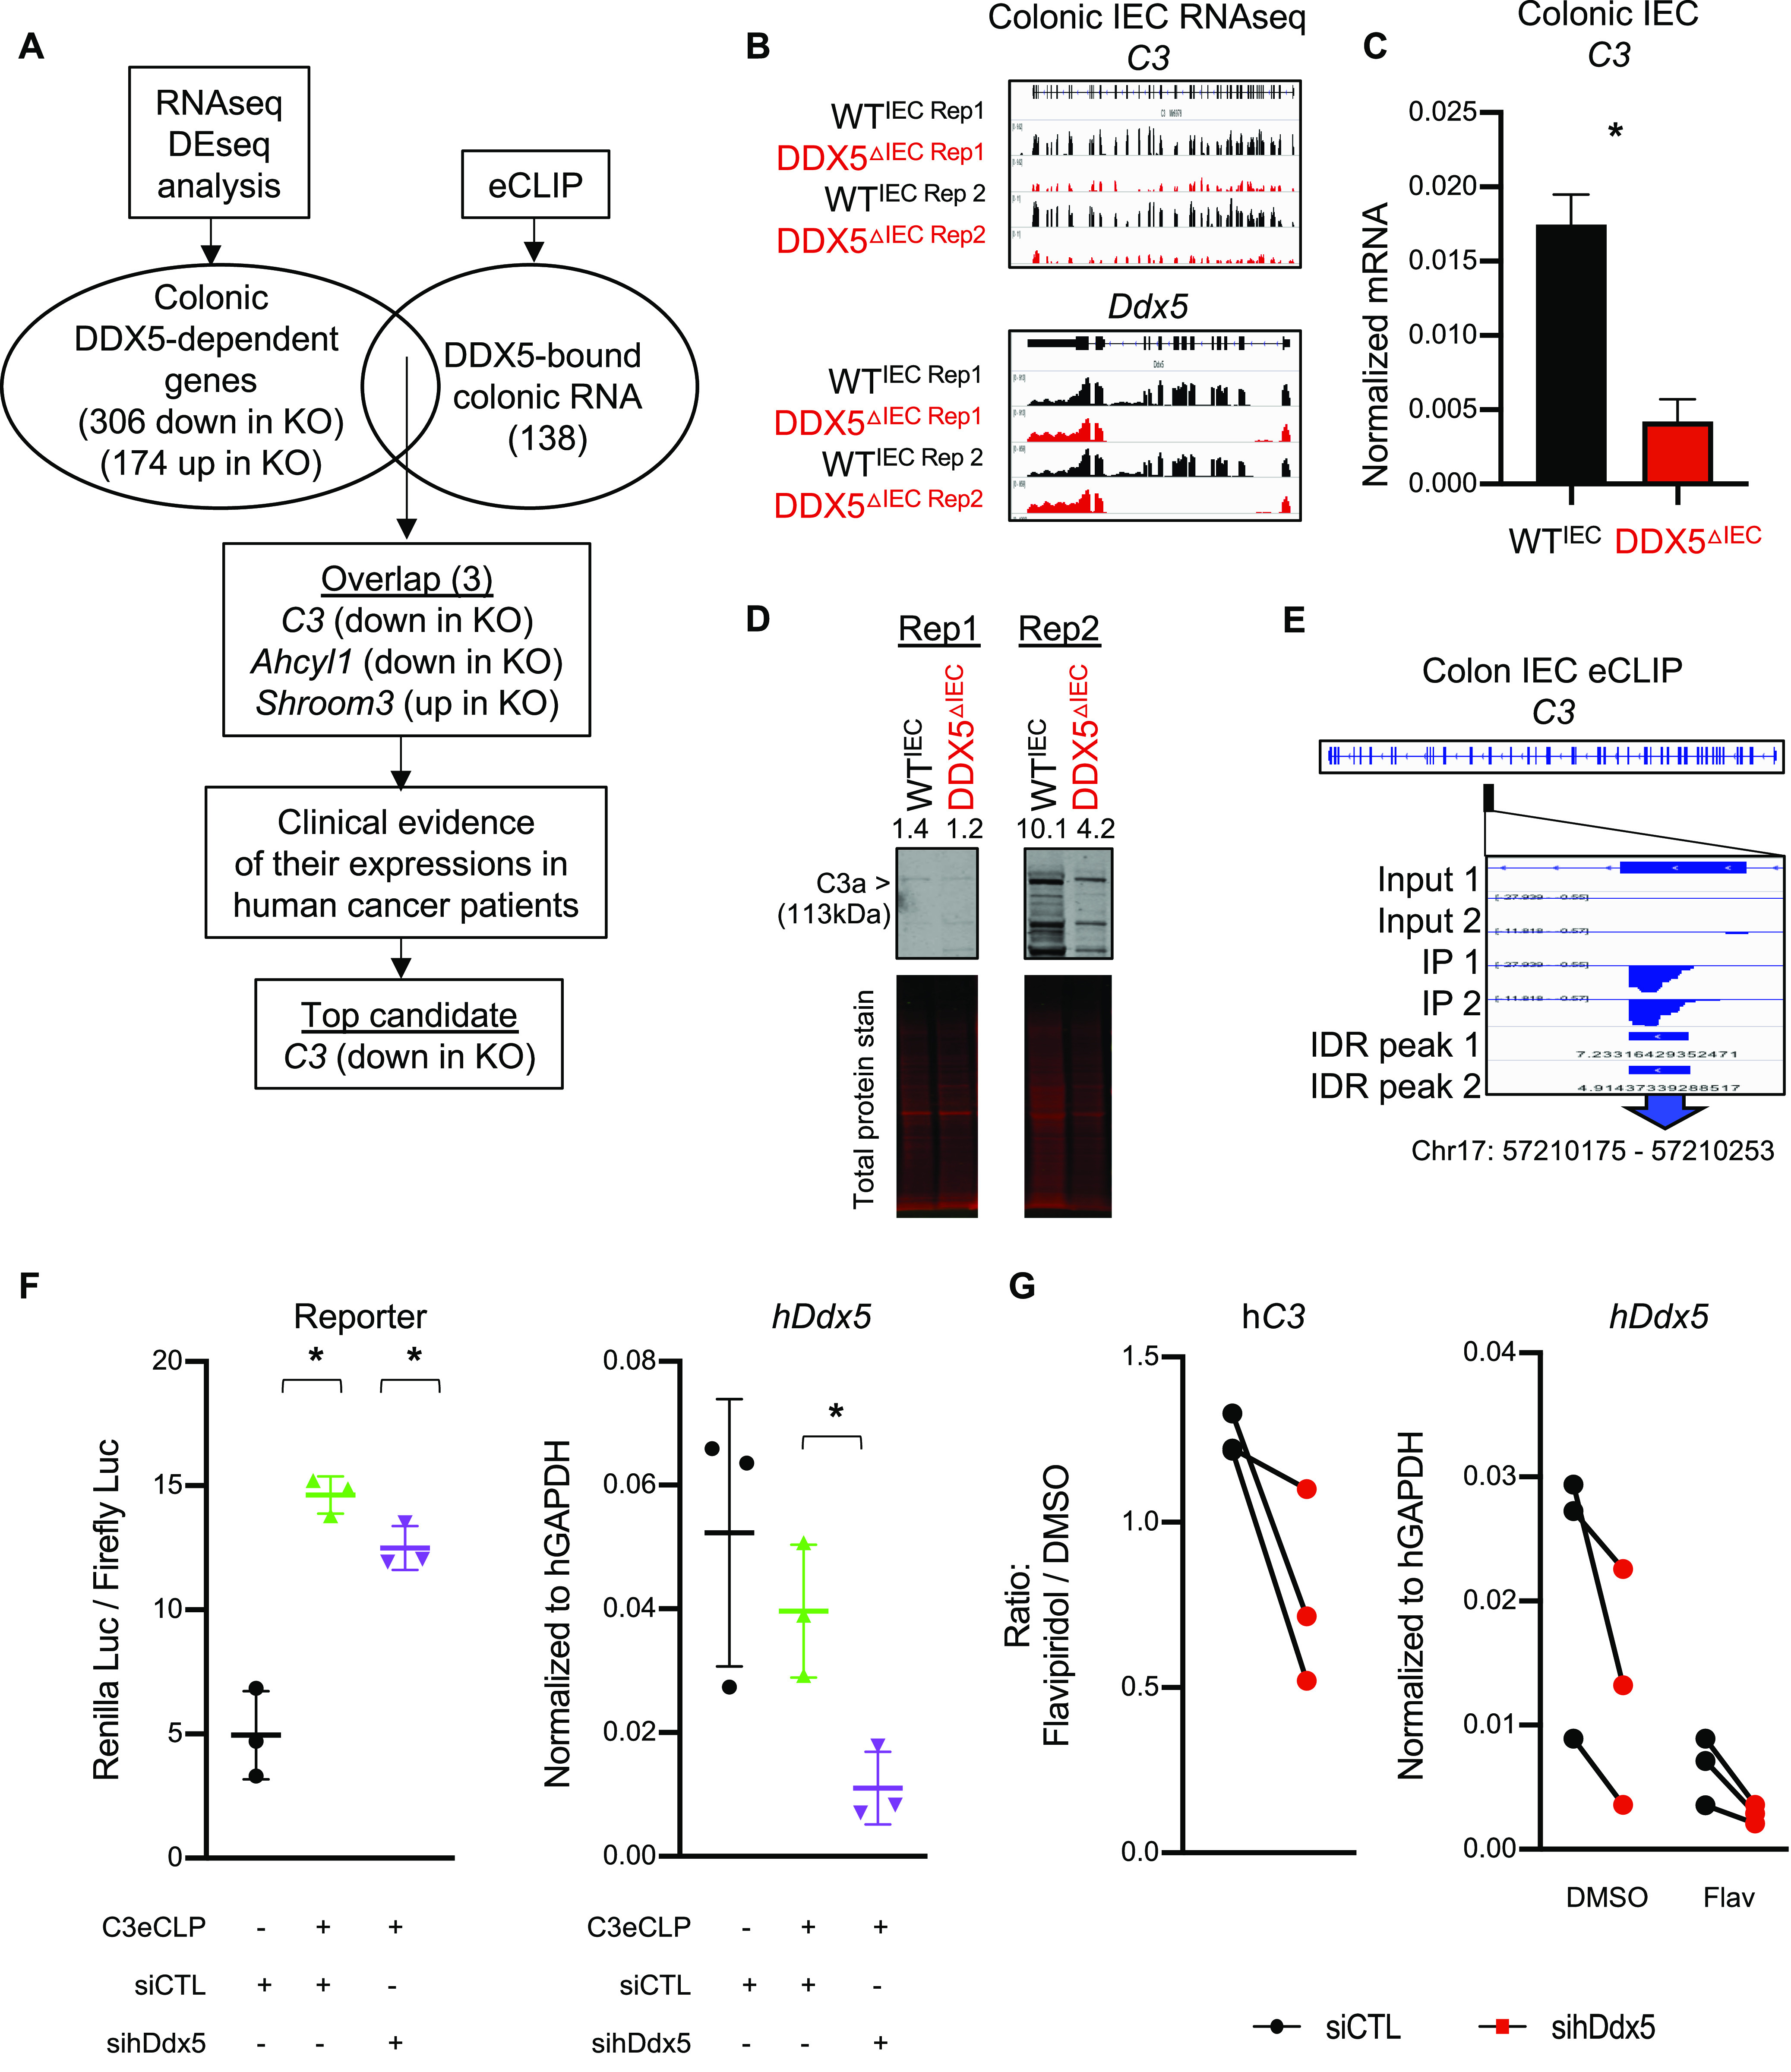
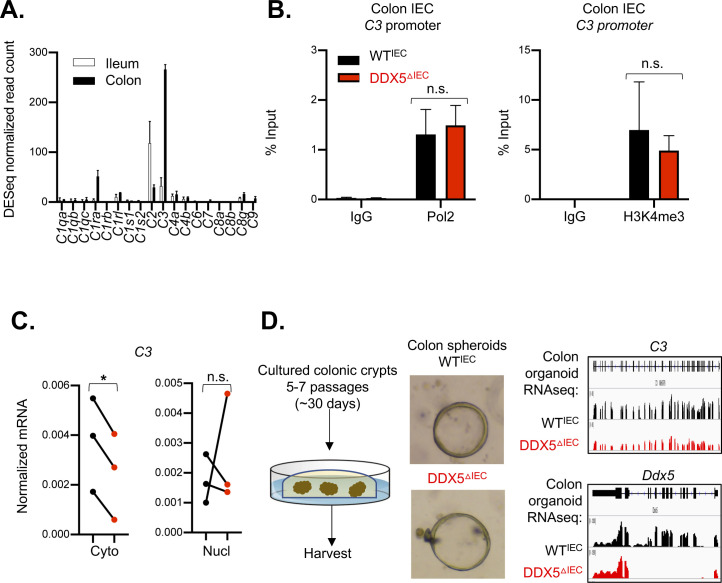
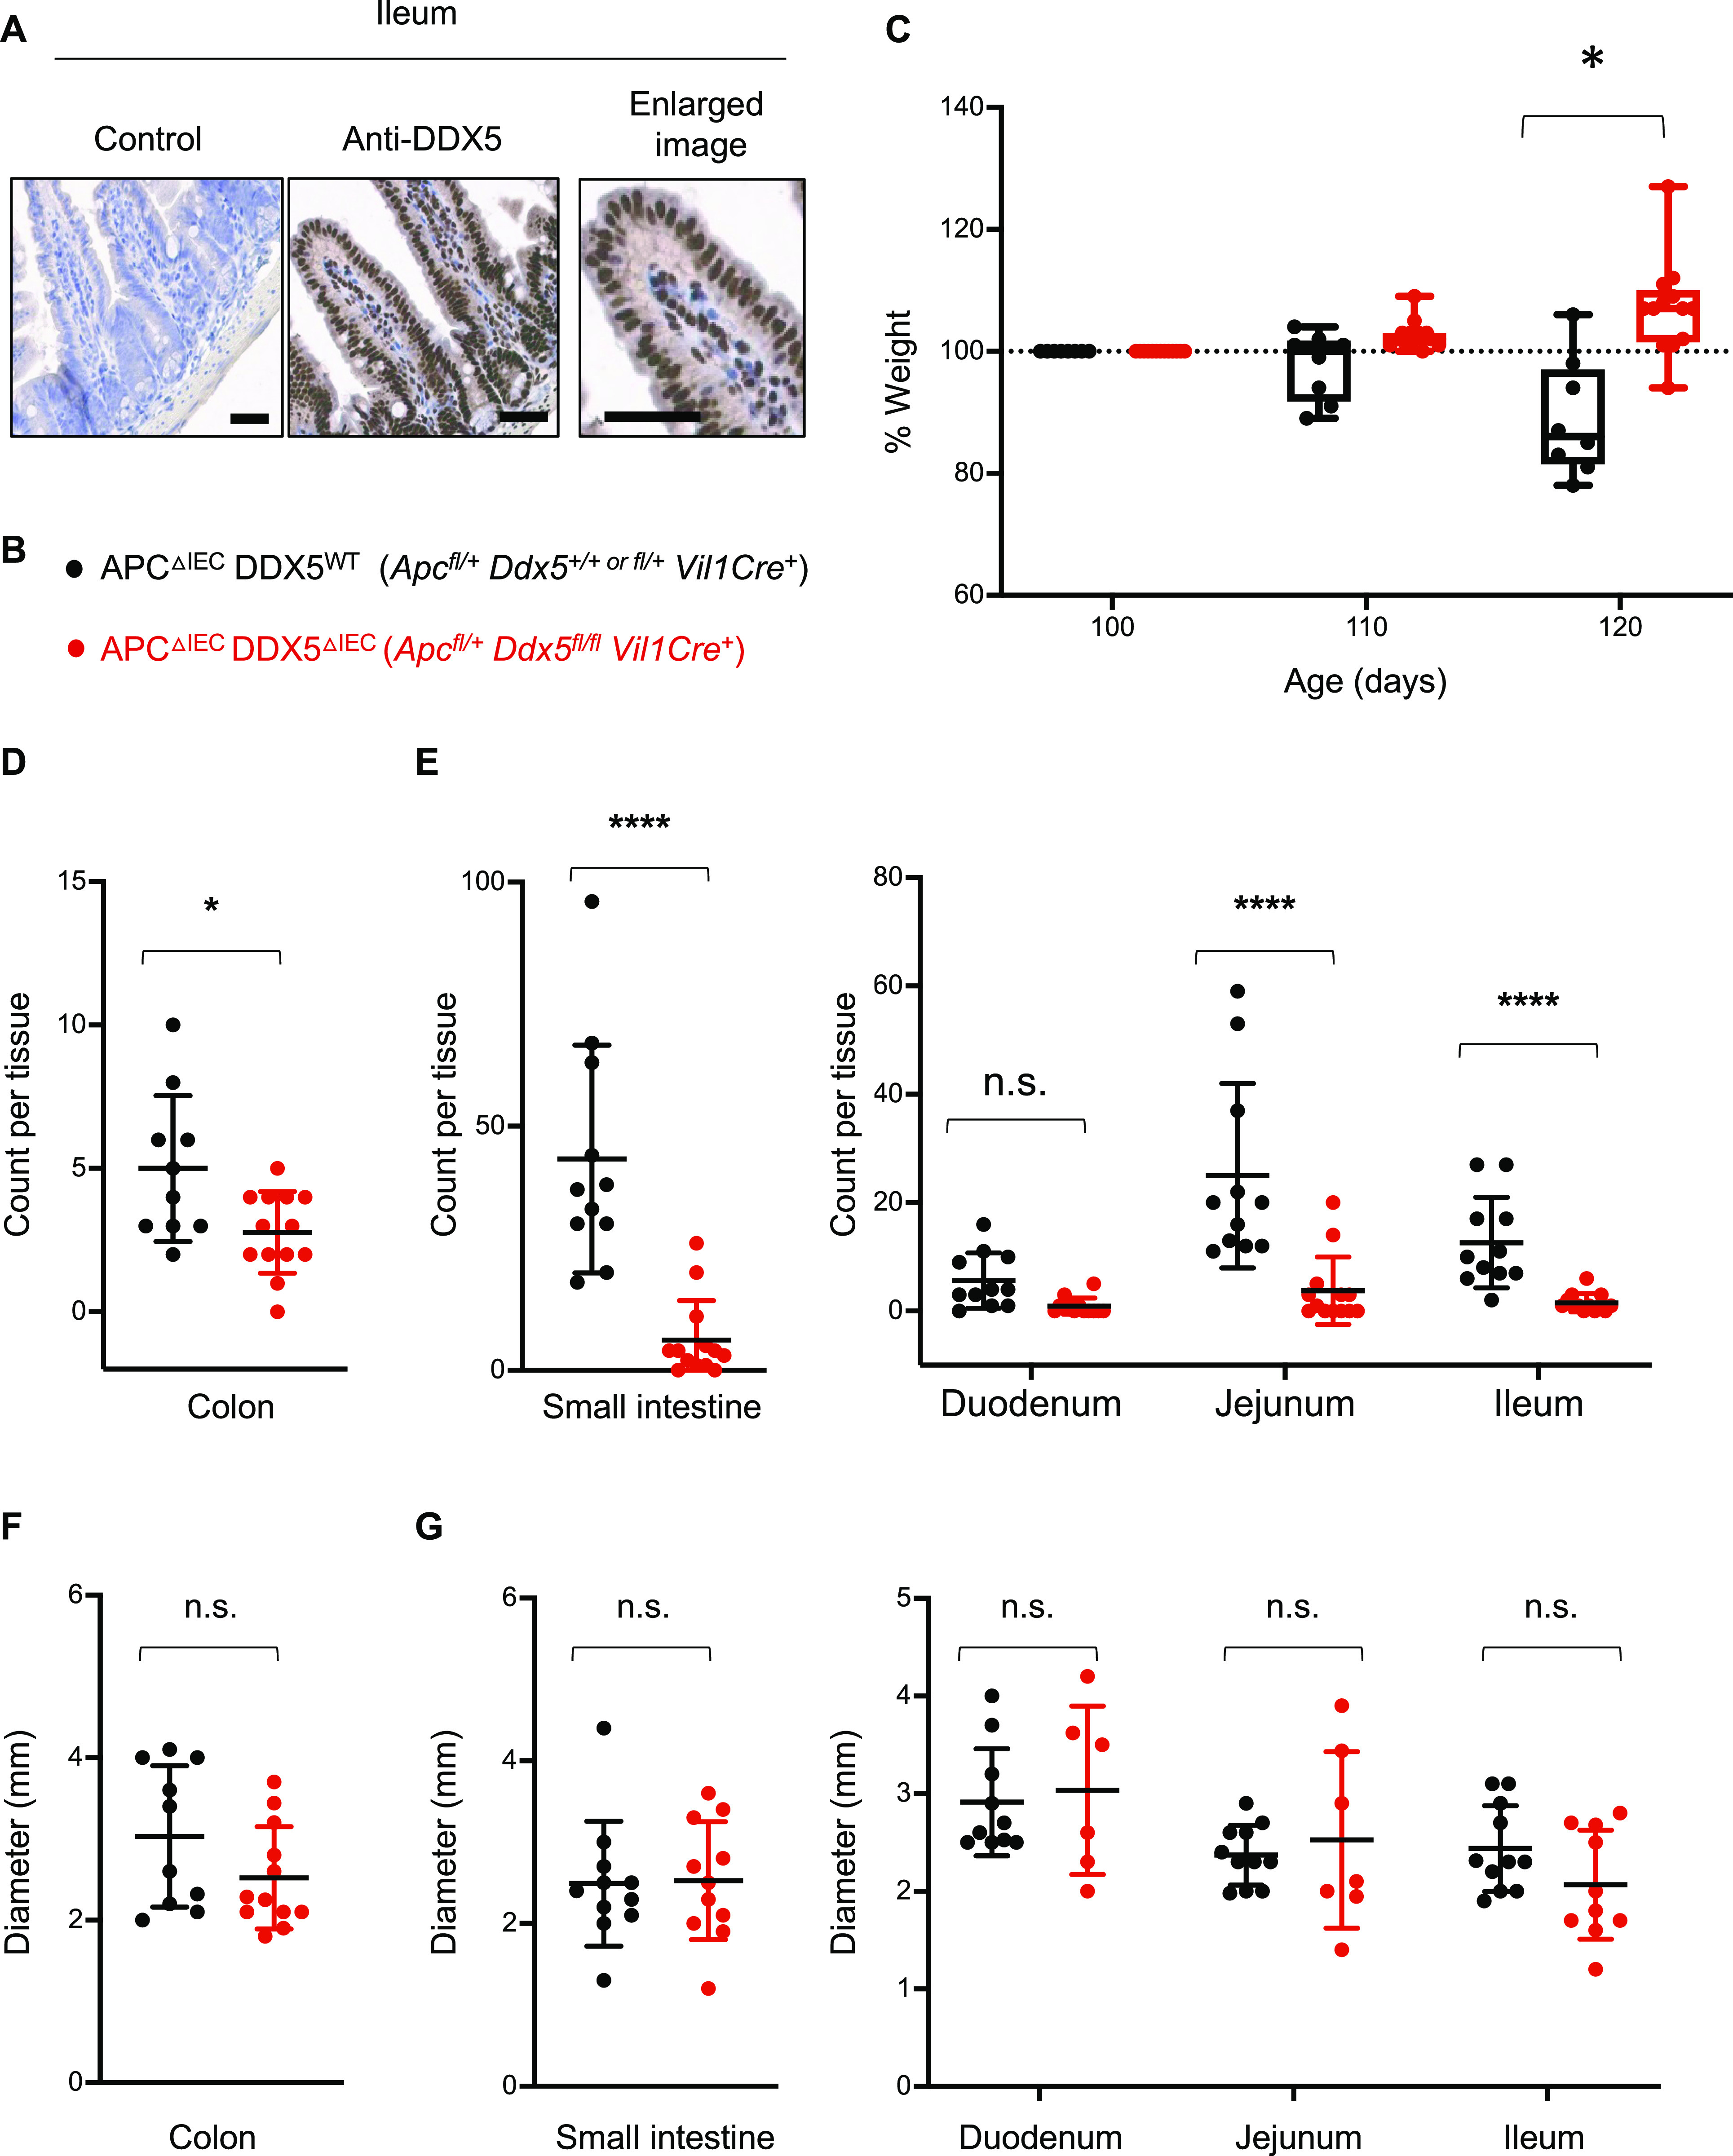
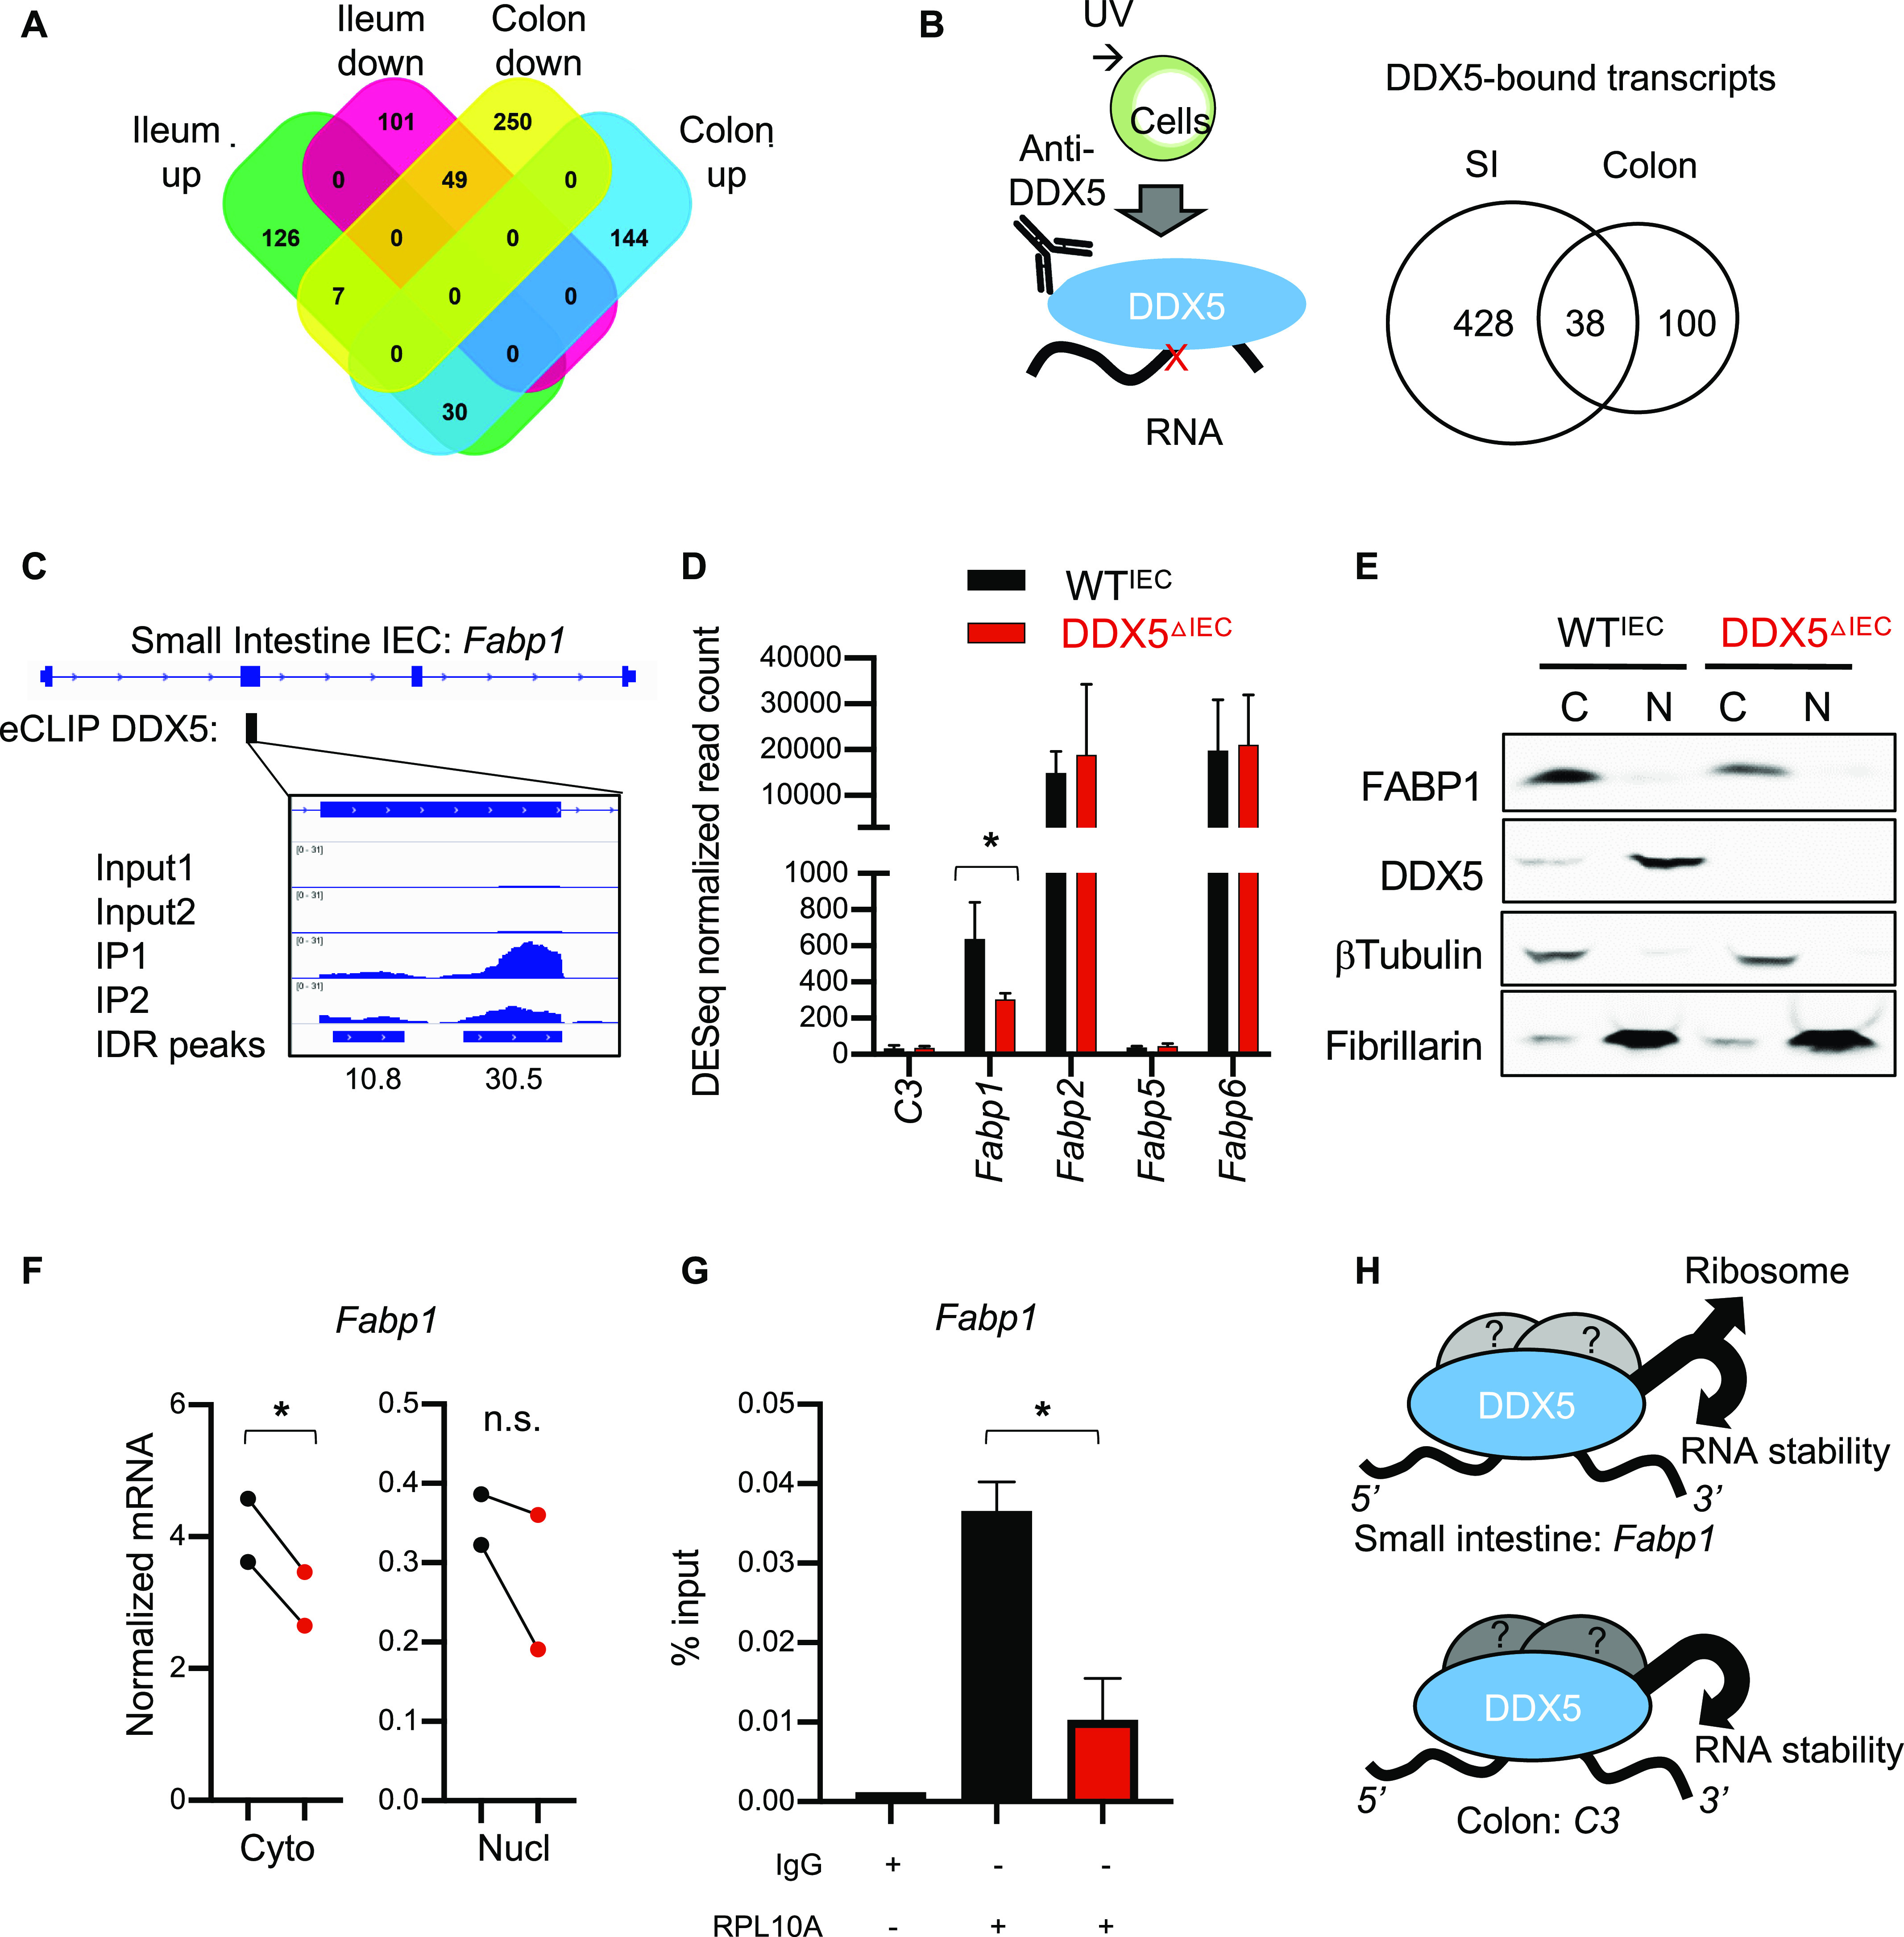
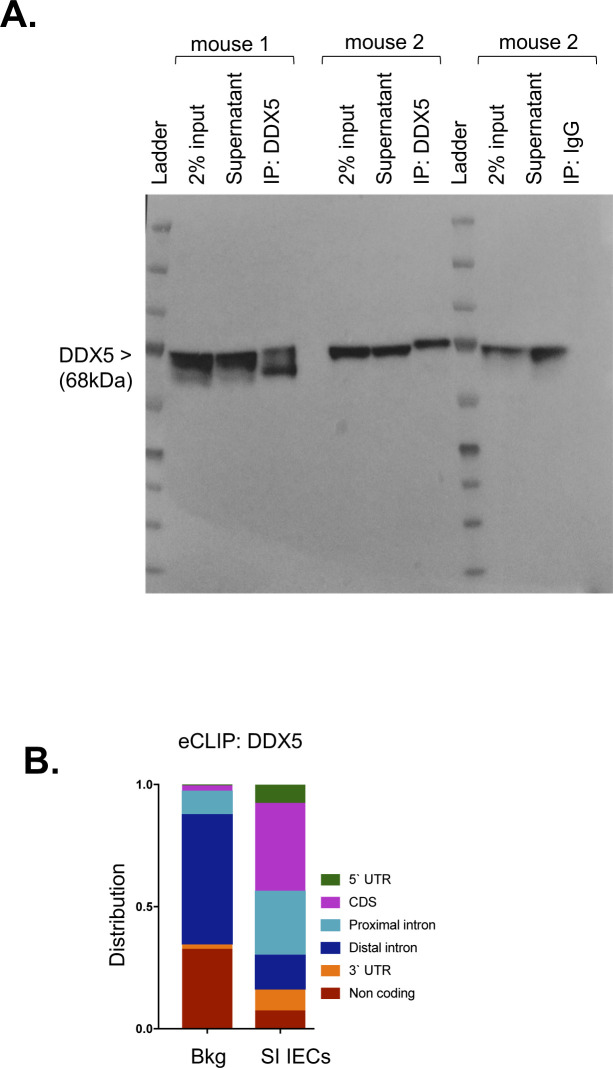
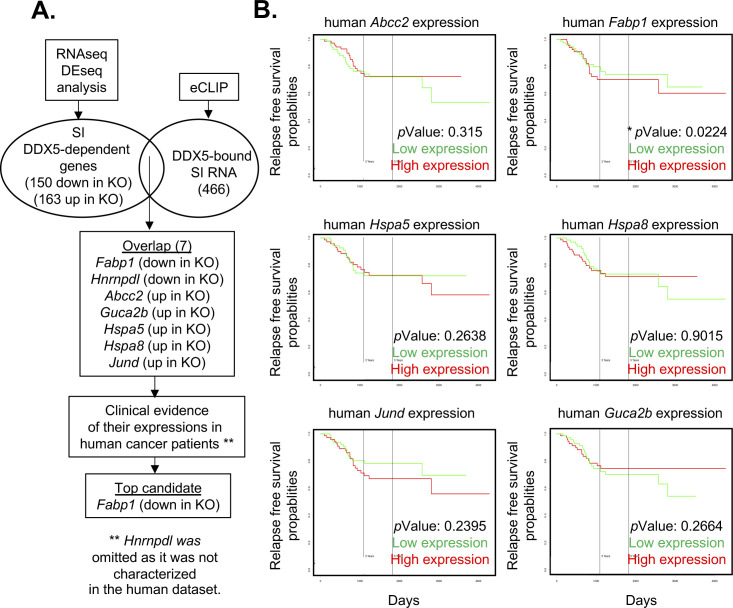
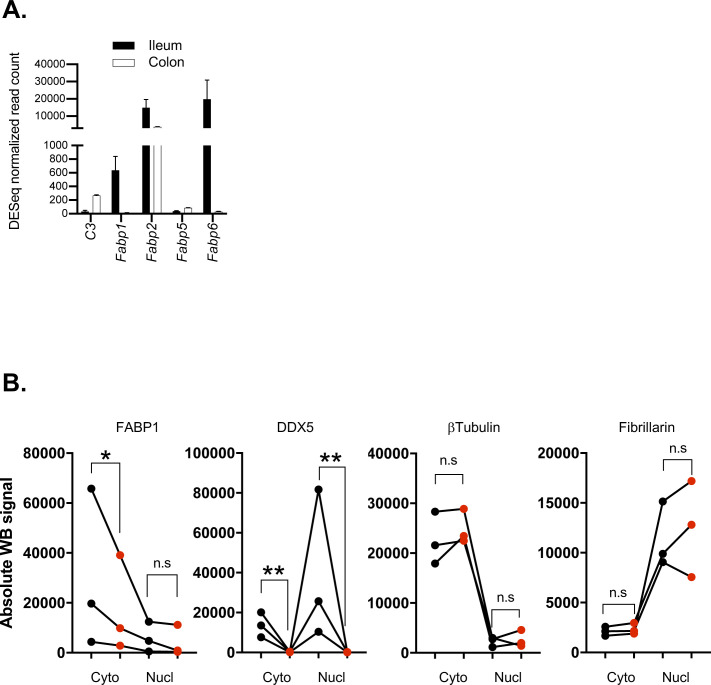
Tumorigenesis in different segments of the intestinal tract involves tissue-specific oncogenic drivers. In the colon, complement component 3 (C3) activation is a major contributor to inflammation and malignancies. By contrast, tumorigenesis in the small intestine involves fatty acid-binding protein 1 (FABP1). However, little is known of the upstream mechanisms driving their expressions in different segments of the intestinal tract. Here, we report that the RNA-binding protein DDX5 binds to the mRNA transcripts of C3 and Fabp1 to augment their expressions posttranscriptionally. Knocking out DDX5 in epithelial cells protected mice from intestinal tumorigenesis and dextran sodium sulfate (DSS)-induced colitis. Identification of DDX5 as a common upstream regulator of tissue-specific oncogenic molecules provides an excellent therapeutic target for intestinal diseases.


Conflict of interest statement

GW Yeo is co-founder, member of the Board of Directors, on the Science Advisory Board, equity holder, and paid consultant for Locanabio and Eclipse BioInnovations. GW Yeo is a visiting professor at the National University of Singapore. GW Yeo’s interests have been reviewed and approved by the University of California San Diego in accordance with its conflict of interest policies. All other authors declare that they have no conflict of interest.

Figures

Figure S1.
Figure S1.. Expression of DDXs in intestinal epithelial cells (IECs).
(A) Workflow for harvesting IECs from the intestine. Flow analyses confirmed EpCAM (CD326)-expressing IECs were enriched following EDTA fractionation of the small intestine. Gated on live singlet cells. (B) RNA expression of DDXs in ileal and colonic IECs. RNAseq was performed on ileal and colonic IECs from two independent WT mice. Data shown are normalized read count means ± SD. (C) Representative Western blot of WTIEC lysates showing that DDX5 was present in the nucleus and cytoplasm. Blots were also probed with βTubulin to confirm proper nuclear and cytoplasmic fractionation.
Figure 1.
Figure 1.. DDX5 regulates colonic epithelial immune response program and contributes to colitis.
(A) Heat map of average normalized RNAseq read counts of the 10 highest expressed members of the DDX family in the ileum and colon of steady-state WT mice (n = 2). (B) Representative Western blots showing DDX5 and β-tubulin protein expression in intestinal epithelial cells (IECs) from different sections of the intestine in WT mice. Experiments were repeated three times using independent biological samples with similar results. (C) Representative images from immunohistochemistry analysis of DDX5 in the colon of WT mice. Enlarged image is shown on the right. Scale bar represents 50 μm. (D) Scatterplot of log2 (fold changes: DDX5ΔIEC over WTIEC) and −log10(P-values) of colonic IEC transcripts. RNAseq was performed on two independent pairs of cohoused DDX5ΔIEC over WTIEC littermates. Black dot: DDX5-dependent transcripts defined as log2 (fold changes: DDX5ΔIEC over WTIEC) ≥0.5 or ≤−0.5 and P-value < 0.05 (DESeq). C3 is indicated in blue. (E) Left: Gene set enrichment analysis of immune response activation (M14047) in DDX5-deficient and DDX5-expressing colonic IECs from steady-state mice. NES, normalized enrichment score; NOM P, normalized P-value. Right: Ranked top 10 DDX5-regulated genes involved in immune response activation. (F) Weight loss of WTIEC (n = 7) and DDX5ΔIEC (n = 9) mice challenged with 2% DSS in their drinking water. This experiment was repeated twice with similar results. Error bars represent SD. ***P < 0.001 (multiple t test). (G) Colonic length in mice from (F) on day 15 post-DSS challenge. Each dot represents one mouse. Results are means ± SD. *P < 0.05 (t test). Source data are available for this figure.
Figure S2.
Figure S2.. Generation of the pan-epithelial DDX5-knockout mouse line.
(A) Genotypes of WTIEC and DDX5ΔIEC littermates. (B) Growth curves of WTIEC and DDX5ΔIEC littermates. (C) Representative Ddx5 expression, as detected by qRT-PCR, in intestinal epithelial cells (IECs) from WTIEC and DDX5ΔIEC littermates showing effective depletion of the target mRNA in cells from DDX5ΔIEC animals. Data shown are means ± SD of two technical repeats. Experiments were repeated three times using independent biological samples with similar results. (D) Representative Western blots showing the depletion of DDX5 protein in IECs from DDX5ΔIEC mice. Experiments were repeated three times using independent biological samples with similar results.
Figure S3.
Figure S3.. DSS histology and inflammatory gene expression.
(A) Representative images of H&E-stained sections of colons from WT and DDX5ΔIEC mice on day 15 post-DSS treatment. Scale bar represents 250 μm. (B) Overall histology scores of distal colons from WT (n = 4) and DDX5ΔIEC (n = 6) mice 15 d post-DSS treatment. (C) Distal colons from WT (n = 4) and DDX5ΔIEC (n = 6) mice challenged with 2% DSS scored by immune infiltrate, submucosal inflammation, crypt density, crypt hyperplasia, and muscle thickening. (D) RNAs from the colonic lamina propria mononuclear cells from mice treated with 2% DSS in their drinking water for 7 d were evaluated for the expression of inflammatory genes. Each dot represents one mouse.
Figure S4.
Figure S4.. DDX5 expression is linked to human IBD.
(A) RNA expression of Ddx5 in healthy or ulcerative colitis or Crohn’s disease patients. ** P-value < 0.01 (t test). (B) RNA expression of Ddx5 in healthy or ulcerative colitis patients under infliximab therapy (43). Active disease (A), infliximab non-responders (nr), infliximab responders (r). ** P-value < 0.01 (t test).
Figure 2.
Figure 2.. DDX5 promotes colonic tumorigenesis in Apc-mutant mice.
(A) Representative bright-field images of tumor-bearing colons from APCΔcIECDDX5WT and APCΔcIECDDX5ΔIEC animals. Scale bar equals 1 cm. (B) Anal prolapse incidents recorded in mice described in (A). (C) Percent weight change of each mice in (A) on day 110 and 120 compared to day 100. Each dot represents one mouse. Weight change from DDX5-sufficient samples are shown in black (n = 15). Weight change from DDX5 knockouts are shown in red (n = 9). Data shown are means ± SD. *P < 0.05 (t test). (D) Colonic tumor counts from APCΔcIECDDX5WT (n = 17) and APCΔcIECDDX5ΔcIEC (n = 12) tumor-bearing animals. Each dot represents one mouse. Data shown are means ± SD. **** P-value < 0.0001 (t test). (E) Average colonic tumor diameter (mm) from APCΔcIECDDX5WT (n = 17) and APCΔcIEC DDX5ΔcIEC (n = 9) tumor-bearing animals. Each dot represents one mouse. Data shown are means ± SD. n.s., not significant (t test). (F) Expression of the DDX5-dependent colonic gene signature predicts clinical outcome in colorectal cancer patients. Top 20 genes were selected based on criteria listed in the Materials and Methods section. Kaplan–Meier analysis of disease-free survival in cohort 1 (GSE13067, GSE14333, GSE17538, GSE31595, GSE37892, and GSE33113), cohort 2 (GSE87211), and progression-free survival in cohort 3 (GSE5851). Source data are available for this figure.
Figure S5.
Figure S5.. DDX5 protein expression in healthy tissues and in colonic tumors from Apc mutant mice.
(A) Representative images from Periodic Acid-Schiff stained section of adjacent normal colonic epithelium and one adenoma lesion. (B) Western blot analysis of DDX5 and β-tubulin in normal and tumor tissues from the colon of WTIEC and APCΔcIEC mouse. Experiments were repeated three times using independent biological samples with similar results. (C) Representative images from periodic acid-Schiff staining and immunohistochemical analysis of DDX5 and Ki67 in the colon of APCΔIECDDX5WT and APCΔIECDDX5ΔcIEC mice.
Figure S6.
Figure S6.. eCLIPseq analysis pipeline.
(A) Western confirmation of efficient immunoprecipitation of DDX5 from two independent colonic intestinal epithelial cell lysates. (B) Workflow of the eCLIPseq analysis. (C) DDX5 binding preference as identified by eCLIPseq on the different colonic RNA regions. Background (Bkg) is defined as the RNA regions in the annotated mouse transcriptome from GENCODE.
Figure 3.
Figure 3.. Epithelial DDX5 binds C3 RNA to enhance its expression posttranscriptionally.
(A) Workflow to identify DDX5 direct targets in colonic intestinal epithelial cells (IECs) involved in tumorigenesis. (B) Integrative Genomics Viewer browser displaying RNA expression at the C3 and Ddx5 locus in colonic IECs from two independent pairs of WTIEC and DDX5ΔIEC littermates. (C) qRT-PCR validation of colonic C3 expression in additional independent pairs of WTIEC (n = 3) and DDX5ΔIEC (n = 3) animals. Data shown are means ± SD. *P < 0.05 (t test). (D) Representative Western analysis of C3 proteins in the colonic IECs from two independent pairs of WT and DDX5-deficient mice. Signal quantification was calculated as signal of C3 over signal of total protein. (E) Integrative Genomics Viewer browser displaying the DDX5 binding to C3 RNAs in WT colonic IECs as defined by eCLIPseq. eCLIPseq was performed on colonic IECs from two independent WT mice. Peaks were called by a cutoff of three for both log10 P-values and log2 (fold changes: immunoprecipitation over input). (F) DDX5-binding site on C3 promotes Renilla luciferase reporter activities in human SW480 cells. Left: reporter activity is calculated as Renilla readings over the constitutive firefly luciferase readings. Results shown are means ± SD of three independent studies. Black: cells transfected with psicheck2 luciferase reporter. Green: cells transfected with psicheck2 luciferase reporter that contains the DDX5-binding site on C3 and random siRNA. Purple: cells transfected with psicheck2 luciferase reporter that contains DDX5-binding site on C3 and Ddx5 siRNA. Right: expression of human DDX5 in SW480 cells were assessed by qRT-PCR and normalized to human GAPDH. SW480 cells under different treatment were indicated as black, green, and purple dots. *P < 0.05 (t test). (G) RNAi-mediated knockdown of human DDX5 destabilizes C3 mRNA in Caco-2 cells. Cells were transfected with 100M control (black) or 100M siRNA against human Ddx5 (red) for 48 h followed by 16 h of incubation with 2 μM flavopiridol. Left: expressions of human C3 were assessed by qRT-PCR and normalized to DMSO-treated controls. Right: expressions of human Ddx5 under different treatments were assessed by qRT-PCR and normalized with hGapdh. Results are means of three independent experiments ± SD, P-value = 0.06 (t test). Source data are available for this figure.
Figure S7.
Figure S7.. C3 expression and RNA polymerase II and H3K4 methylation levels on its promoter.
(A) Normalized RNAseq read counts of the complement gene family in ileal and colonic intestinal epithelial cells (IECs) from steady-state WT mice. RNAseq was performed on ileal and colonic IECs from two independent WT mice. Data shown are normalized read count means ± SD. (B) Chromatin immunoprecipitation-qPCR assay of RNA polymerase II and H3K4me3 in colonic IECs. Data shown are means ± SD from two independent pairs WTIEC and DDX5-deficient mice. n.s., not significant (t test). (C) RNAs from the nuclear and cytoplasmic fractions of colonic IECs harvested from WT and DDX5DIEC mice were evaluated by qRT-PCR for C3. Each dot represents one mouse. This experiment was repeated on three pairs of independent samples. *P < 0.05 (t test). (D) Left: representative bright-field images of organoids cultured from colonic crypts of WTIEC and DDX5-deficient mice. Right: IGV browser displaying RNA expression at the C3 and Ddx5 locus in cultured organoids derived from WTIEC (n = 1) and DDX5DIEC (n = 1) colonic crypts.
Figure 4.
Figure 4.. DDX5 also promotes tumorigenesis in the small intestine.
(A) Representative images from immunohistochemistry analysis of DDX5 in the ileum of WT mice. Enlarged image is shown on the right. Scale bar represents 50 μm. (B, C, D, E, F, G) Genotypes of tumor-bearing APCΔIECDDX5WT and APCΔIECDDX5ΔcIEC littermates used in (C, D, E, F, G). (C) Percent weight change of each mouse in (B) on days 100, 110, and 120. Each dot represents one mouse. Data shown are means ± SD. Each dot represents one mouse. Weight change from DDX5-sufficient samples are shown in black (n = 10). Weight change from DDX5 knockouts are shown in red (n = 13). Data shown are means ± SD. *P < 0.05 (multiple t test). (D) Macroscopic tumor counts in the colon. Each dot represents one mouse. Counts from DDX5-sufficient samples are shown in black (n = 12) and counts from DDX5 knockouts are shown in red (n = 13). Data shown are means ± SD. *P < 0.05 (t test). (E) Left: total macroscopic tumor counts in the small intestine. Right: Macroscopic tumor counts in different segments of the small intestine. Each dot represents one mouse. Counts from DDX5-sufficient samples are shown in black (n = 12) and counts from DDX5 knockouts are shown in red (n = 13). Data shown are means ± SD. n.s., not significant. ****P < 0.0001 (multiple t test). (F) Average tumor diameters in the colon. Each dot represents one mouse. Diameters from DDX5-sufficient samples are shown in black (n = 12) and diameters from DDX5 knockouts are shown in red (n = 13). Data shown are means ± SD. n.s., not significant (t test). (G) Left: Average tumor diameters in the small intestine. Right: average tumor diameters in different segments of the small intestine. Each dot represents one mouse. Diameters from DDX5-sufficient samples are shown in black (n = 12) and diameters from DDX5 knockouts are shown in red (n = 13). Data shown are means ± SD. n.s., not significant (t test). Source data are available for this figure.
Figure 5.
Figure 5.. DDX5 regulates overlapping and distinct RNA programs in the small intestine and colon.
(A) Venn diagram of the overlapping and distinct DDX5-dependent transcripts from the ileum and colon defined as log2 fold change of ≥0.5 or ≤−0.5 and P-value < 0.05. RNAseq was performed on two independent pairs of cohoused DDX5ΔIEC over WTIEC littermates. (B) Venn diagram showing the overlapping and distinct DDX5-bound transcripts in the small intestine and colonic intestinal epithelial cells (IECs). eCLIPseq was performed on small intestine IECs from two independent WT mice. Peaks were called by a cutoff of three for both log10 P-values and log2 (fold changes: immunoprecipitation over input). (C) Integrative Genomics Viewer browser displaying DDX5 binding on the fatty acid-binding protein 1 (Fabp1) locus as defined by eCLIPseq. (D) Normalized RNAseq read counts of transcripts encoding members of the FABP family in ileal IECs from WTIEC and DDX5-deficient mice. *P < 0.05 (DEseq). (E) Representative Western blots for FABP1, DDX5, β-tubulin, and fibrillarin in cytoplasmic (C) and nuclear (N) extracts of small intestine IECs from WT and DDX5ΔIEC mice. Experiments were repeated three times using independent biological samples with similar results. (F) RNAs from the nuclear and cytoplasmic fractions of small intestine IECs harvested from WT and DDX5ΔIEC mice were evaluated by qRT-PCR for Fabp1. Each dot represents one mouse. This experiment was repeated on two pairs of independent samples. *P < 0.05 (t test). (G) Engagement of Fabp1 mRNA with ribosome RPL10A in small intestine IECs. Results are means of two independent experiments ± SD. *P < 0.05 (t test). (H) Working model: DDX5 posttranscriptionally regulates the expression of tissue-specific oncogenic RNAs in IECs. Source data are available for this figure.
Figure S8.
Figure S8.. Immunoprecipitation of small intestine DDX5 for eCLIPseq analysis.
(A) Western confirmation of efficient immunoprecipitation of DDX5 from two independent small intestine intestinal epithelial cell lysates. (B) DDX5 binding preferences identified by eCLIPseq on different RNA regions in small intestine intestinal epithelial cells. Background (Bkg) is defined as the RNA regions in the annotated mouse transcriptome from GENCODE.
Figure S9.
Figure S9.. Identifying DDX5-regulated small intestine targets involved in tumorigenesis.
(A) Workflow to identify DDX5 direct targets in small intestine intestinal epithelial cells involved in tumorigenesis. (B) PROGgeneV2 view of relapse-free survival (GSE17536) in CRC patient cohort divided at median of each gene expression.
Figure S10.
Figure S10.. Quantification of protein expression in WTIEC and DDX5ΔIEC small intestine intestinal epithelial cells (IECs).
(A) Normalized RNAseq read counts of transcripts encoding C3 and members of the FABP family in the ileum and colon of steady-state WT mice. RNAseq was performed on ileal and colonic IECs from two independent WT mice. Data shown are normalized read count means ± SD. (B) Quantification (LiCoR: ImageStudio) of the Western blot signals from Fig 5E (Nucl, nuclear; Cyto, cytoplasmic fractions). Dots represent the quantification from each independent experiment. n = 3. *P < 0.05, **P < 0.01, n.s., not significant (paired t test).

References

    1. Samstad EO, Niyonzima N, Nymo S, Aune MH, Ryan L, Bakke SS, Lappegard KT, Brekke OL, Lambris JD, Damas JK, et al. (2014) Cholesterol crystals induce complement-dependent inflammasome activation and cytokine release. J Immunol 192: 2837–2845. 10.4049/jimmunol.1302484 - DOI - PMC - PubMed
    1. Mizutani N, Goshima H, Nabe T, Yoshino S (2012) Complement C3a-induced IL-17 plays a critical role in an IgE-mediated late-phase asthmatic response and airway hyperresponsiveness via neutrophilic inflammation in mice. J Immunol 188: 5694–5705. 10.4049/jimmunol.1103176 - DOI - PubMed
    1. Liu Y, Wang K, Liang X, Li Y, Zhang Y, Zhang C, Wei H, Luo R, Ge S, Xu G (2018) Complement C3 produced by macrophages promotes renal fibrosis via IL-17A secretion. Front Immunol 9: 2385 10.3389/fimmu.2018.02385 - DOI - PMC - PubMed
    1. Leon F, Contractor N, Fuss I, Marth T, Lahey E, Iwaki S, la Sala A, Hoffmann V, Strober W, Kelsall BL (2006) Antibodies to complement receptor 3 treat established inflammation in murine models of colitis and a novel model of psoriasiform dermatitis. J Immunol 177: 6974–6982. 10.4049/jimmunol.177.10.6974 - DOI - PubMed
    1. Lu F, Fernandes SM, Davis AE 3rd (2010) The role of the complement and contact systems in the dextran sulfate sodium-induced colitis model: The effect of C1 inhibitor in inflammatory bowel disease. Am J Physiol Gastrointest Liver Physiol 298: G878–G883. 10.1152/ajpgi.00400.2009 - DOI - PubMed

Publication types

MeSH terms