

Case Reports
doi: 10.3324/haematol.2020.260448.
Clonal independence of JAK2 and CALR or MPL mutations in comutated myeloproliferative neoplasms demonstrated by single cell DNA sequencing
Affiliations
- PMID: 32817290
- PMCID: PMC7776355
- DOI: 10.3324/haematol.2020.260448
Item in Clipboard
Case Reports
Clonal independence of JAK2 and CALR or MPL mutations in comutated myeloproliferative neoplasms demonstrated by single cell DNA sequencing
Haematologica.
.
No abstract available
Figures
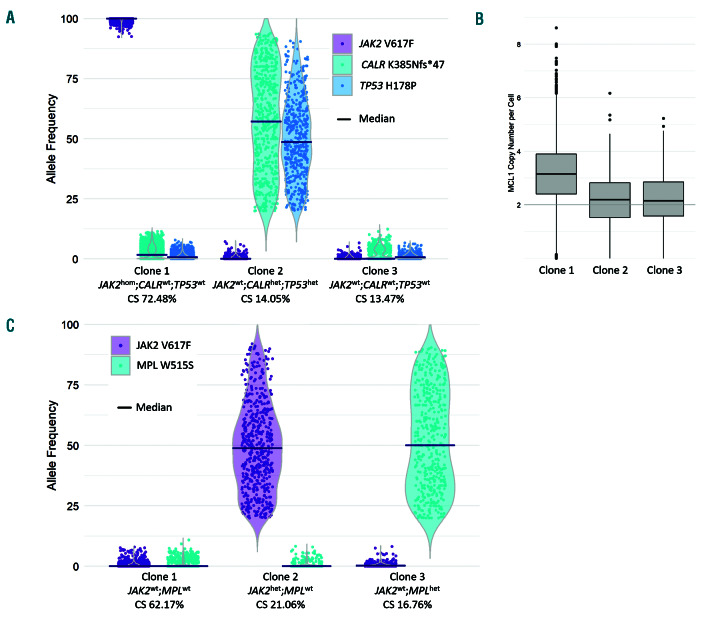
Single cell clone analysis of two myeloproliferative neoplasm patients. (A and C) Major clone analysis of patients 1 and 2, respectively, demonstrating allele frequency distribution of single cells within each of the major clones identified by the presence of JAK2 Val617Phe, CALR Lys385Asnfs*47 and TP53 His178Pro mutations in patient 1, and JAK2 Val617Phe and MPL Trp515Ser mutations in patient 2. Zygosity (wild-type [wt], heterozygous [het], homozygous [hom]) is inferred from the median allele frequency (indicated). Variant data were filtered and major clones identified as indicated in the supplementary methods. (B) MCL1 copy number in patient 1 is shown for the corresponding clones, indicating a copy number gain of chromosome 1q21.3 within the JAK2hom;CALRwt;TP53wt clone.
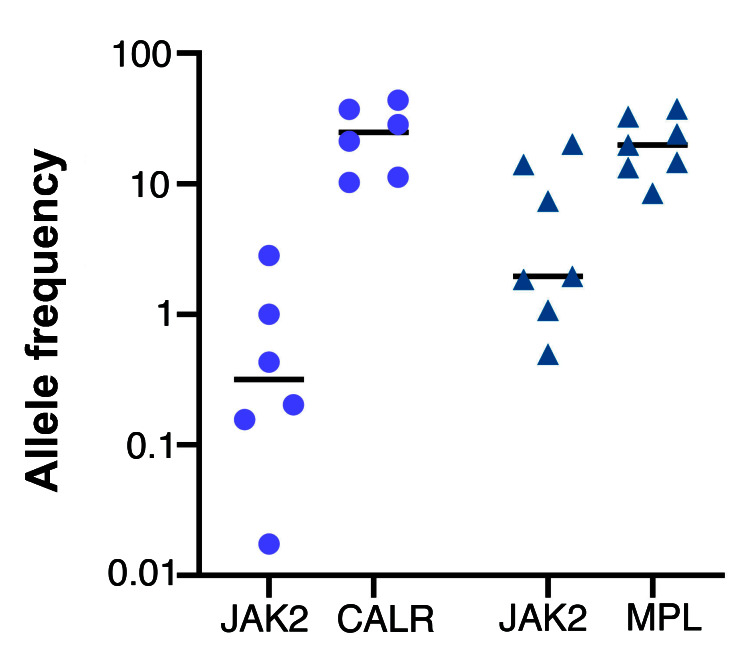
Allele frequencies in six JAK2/CALR and seven JAK2/MPL comutated patients detected among a series of 2,664 consecutive diagnostic samples assessed for myeloproliferative neoplasms. The median allele frequency for JAK2 is significantly lower than for either comutated CALR (JAK2 vs. CALR, median 0.32% [range: 0.02-2.83%] versus 24.90% [range: 10.30-43.98%]) or comutated MPL (JAK2 vs. MPL, median 1.96% [range 0.50%- 20.12%] versus 19.88% [range: 8.51-37.61%]).
References
-
- Swerdlow SH, Campo E, Harris NL, et al. WHO classification of Tumours of Haematopoietic and Lymphoid Tissues. 4th ed. Lyon, France: International Agency for Research on Cancer, 2017.
-
- Tefferi A, Pardanani A. Myeloproliferative Neoplasms: a contemporary review. JAMA Oncol. 2015;1(1):97-105. - PubMed
-
- Li S, Kralovics R, De Libero G, Theocharides A, Gisslinger H, Skoda RC. Clonal heterogeneity in polycythemia vera patients with JAK2 exon12 and JAK2-V617F mutations. Blood. 2008;111(7):3863-3866. - PubMed
-
- Beer PA, Jones AV, Bench AJ, et al. Clonal diversity in the myeloproliferative neoplasms: independent origins of genetically distinct clones. Br J Haematol. 2009;144(6):904-908. - PubMed
-
- Nomani L, Bodo J, Zhao X, Durkin L, Loghavi S, Hsi ED. CAL2 immunohistochemical staining accurately identifies CALR mutations in myeloproliferative neoplasms. Am J Clin Pathol. 2016; 146(4):431-438. - PubMed
Publication types
MeSH terms
Substances
LinkOut - more resources
Full Text Sources
Medical
Research Materials
Miscellaneous
