. 2020 Aug 14;5(50):eaba5264.
doi: 10.1126/sciimmunol.aba5264.

An IL-2 mutein engineered to promote expansion of regulatory T cells arrests ongoing autoimmunity in mice

Affiliations

An IL-2 mutein engineered to promote expansion of regulatory T cells arrests ongoing autoimmunity in mice

Liliane Khoryati et al. Sci Immunol. .

Abstract

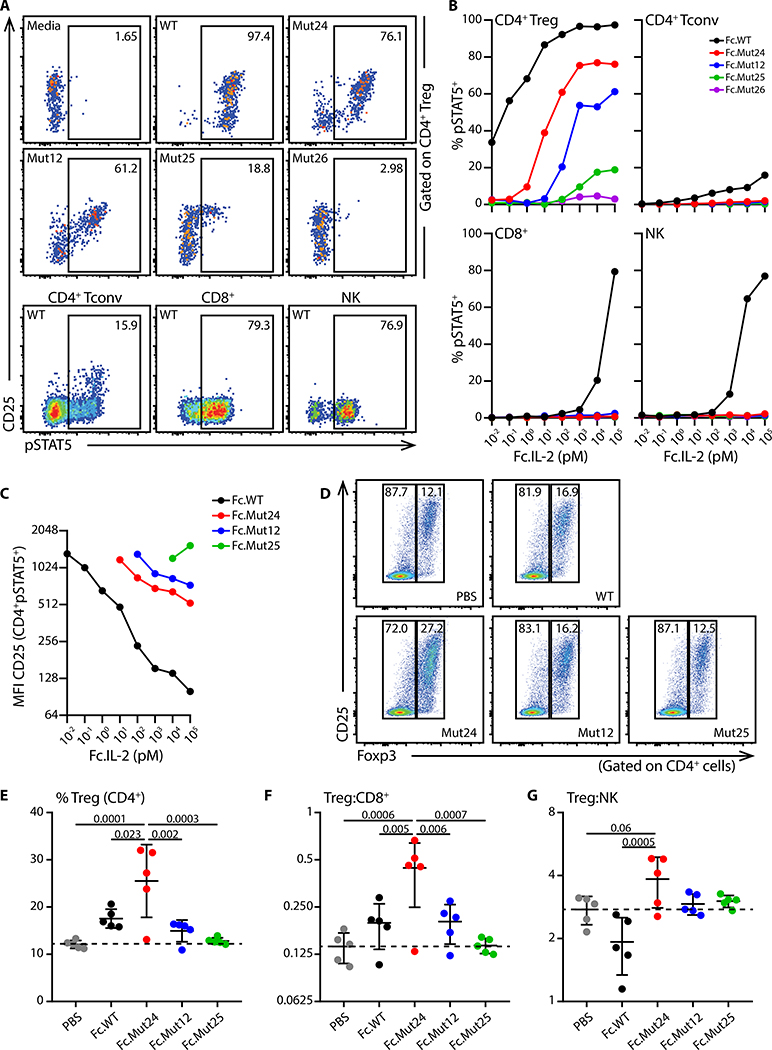
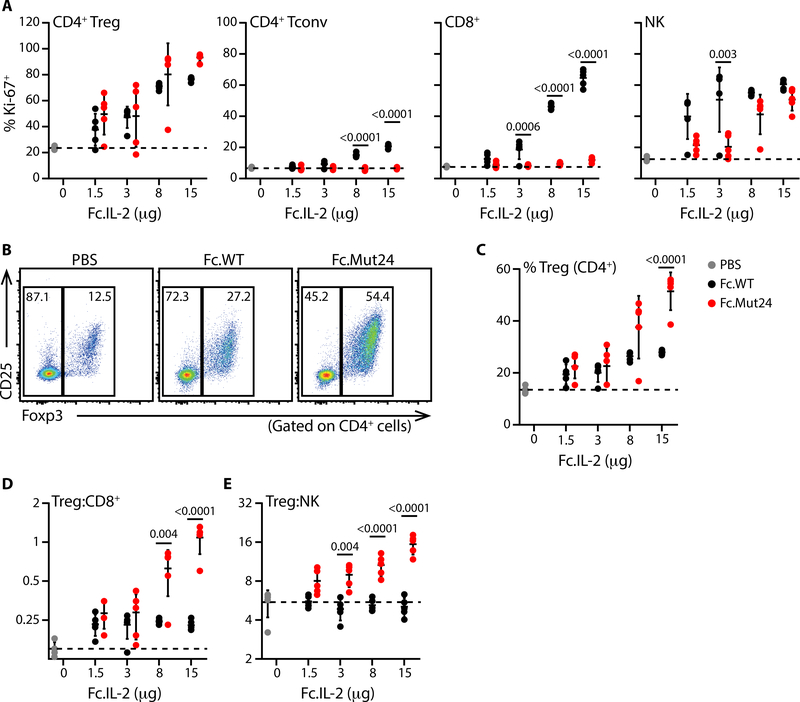
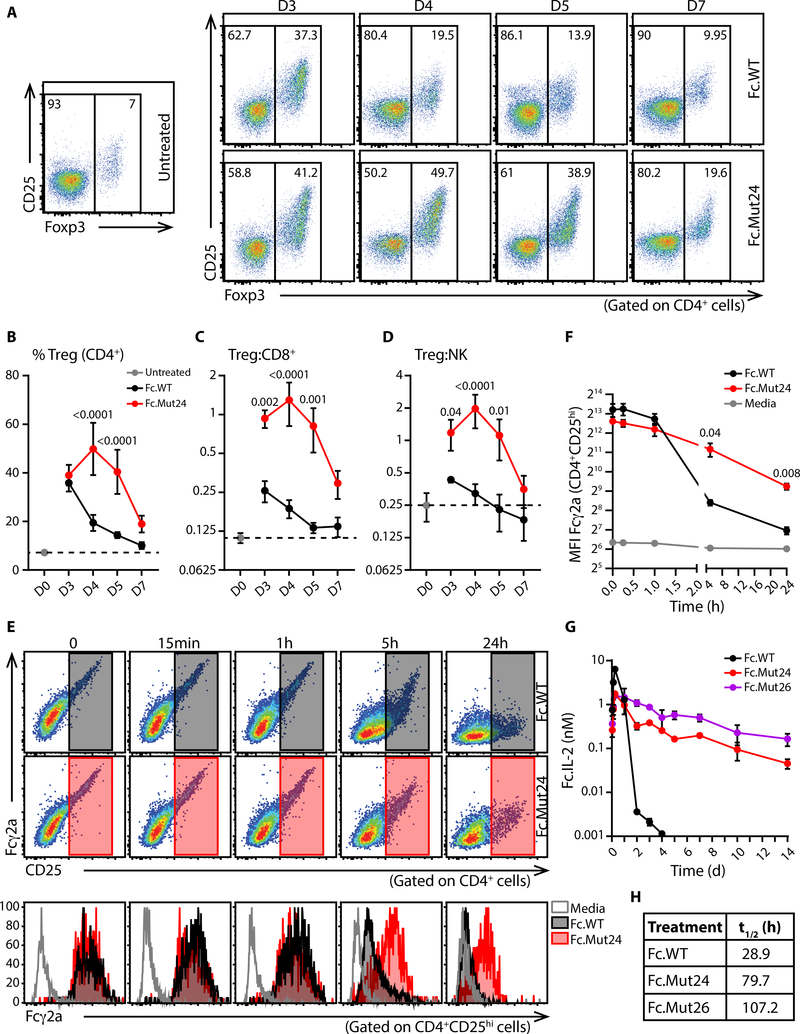
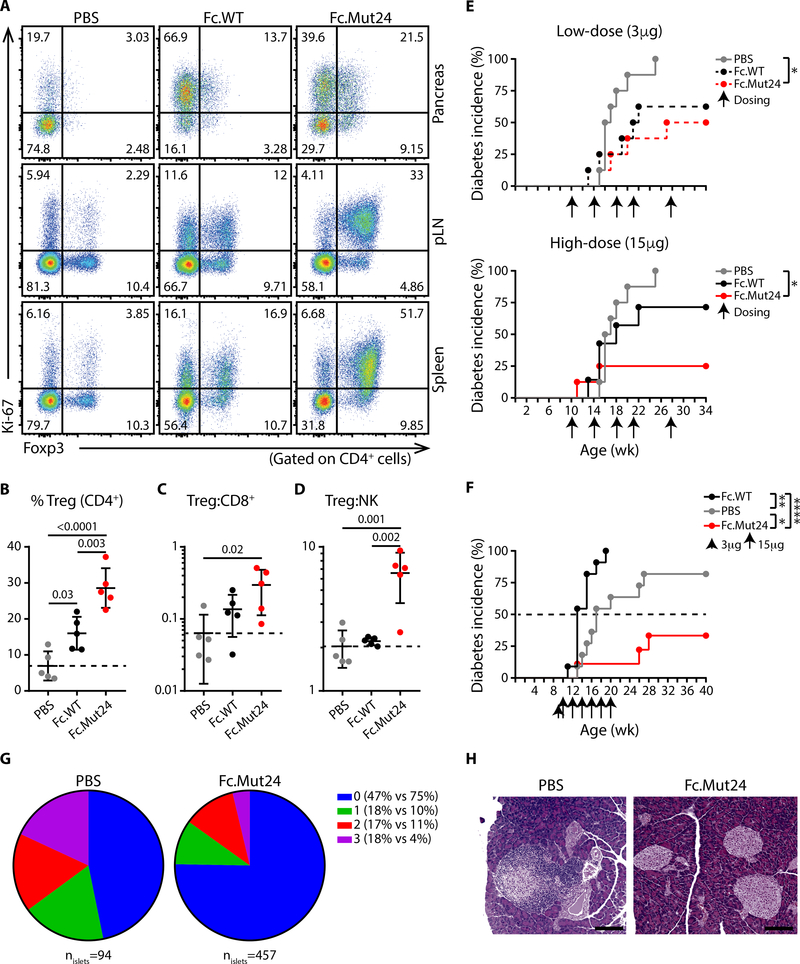
Interleukin-2 (IL-2) controls the homeostasis and function of regulatory T (Treg) cells, and defects in the IL-2 pathway contribute to multiple autoimmune diseases. Although recombinant IL-2 therapy has been efficacious in certain inflammatory conditions, the capacity for IL-2 to also activate inflammatory effector responses highlights the need for IL-2-based therapeutics with improved Treg cell specificity. From a panel of rationally designed murine IL-2 variants, we identified IL-2 muteins with reduced potency and enhanced Treg cell selectivity due to increased dependence on the IL-2 receptor component CD25. As an Fc-fused homodimer, the optimal Fc.IL-2 mutein induced selective Treg cell enrichment and reduced agonism of effector cells across a wide dose range. Furthermore, despite being a weaker agonist, overall Treg cell growth was greater and more sustained due to reduced receptor-mediated clearance of the Fc.IL-2 mutein compared with Fc-fused wild-type IL-2. Preferential Treg cell enrichment was also observed in the presence of activated pathogenic T cells in the pancreas of nonobese diabetic (NOD) mice, despite a loss of Treg cell selectivity in an IL-2R proximal response. These properties facilitated potent and extended resolution of NOD diabetes with infrequent dosing schedules.


Conflict of interest statement

Competing interests: M.A.G., K.C. and J.P. own stock in Amgen, Inc. M.A.G has served as a consultant to Amgen, Inc. All other authors declare that they have no competing interests.

Figures

Fig. 1.
Fig. 1.. Fc.muteins show a weak signaling potency but a high Treg cell-selectivity.
(A to C) B6 splenocytes were stimulated with the indicated purified Fc.IL-2 fusion proteins for 15 min. (A) Representative flow cytometric analyses of Treg cells, Foxp3CD4+ conventional T cells (Tconv), CD8+ T cells, and NK cells, at 100nM dose of the indicated Fc.IL-2. (B) pSTAT5 dose-response curves for the indicated populations in response to each Fc.mutein. (C) CD25 median fluorescence intensity on CD4+pSTAT5+ cells stimulated with the indicated doses of each Fc.mutein. Data are representative of at least two independent experiments. (D to G) B6 mice were treated with PBS or the indicated Fc.IL-2 (8μg), and inguinal lymph nodes were harvested four days later. (D) Representative flow cytometric analyses of Treg cell frequency. (E) Frequencies of Treg cells and ratios of (F) Treg:CD8+ and (G) Treg:NK are summarized. Data shown as mean ± SD, significance determined by one-way ANOVA followed by Tukey post-test. Representative of at least two independent experiments with n=5 mice/group.
Fig. 2.
Fig. 2.. Fc.Mut24 remains Treg cell-selective across a wide dose range in vivo.
(A) Percentages of Ki-67+ cells in the indicated populations 4d after PBS or Fc.IL-2 treatment are plotted. (B) Representative flow cytometry analyses of Foxp3 and CD25 expression for mice given PBS or Fc.IL-2 (15μg). (C) Graphical summary of Treg cell frequencies and ratios of (D) Treg:CD8+ and (E) Treg:NK in PBS or Fc.IL-2 treated mice. Data shown as mean ± SD, significance determined by two-way ANOVA followed by Tukey post-test. Representative of at least two independent experiments with n=5 mice/group.
Fig. 3.
Fig. 3.. Sustained Treg cell enrichment in vivo and lower target mediated clearance of Fc.Mut24.
(A) Representative flow cytometry analyses of Foxp3 and CD25 expression in gated CD4+ T cells at the indicated times after treatment with Fc.IL-2 (15μg). Graphical summaries of (B) Treg cell frequencies, and ratios of (C) Treg:CD8+ and (D) Treg:NK. Data shown as mean ± SD, significance determined by two-way ANOVA followed by Tukey post-test. Representative of two independent experiments with n=4–5 mice/group. (E and F) Anti-CD3/CD28 activated B6 splenocytes were coated with Fc.WT or Fc.Mut24 and cultured for the indicated times. (E) Upper and middle: Representative staining for surface Fc.IL-2 and CD25 on CD4+ cells. Bottom: Analysis of Fcγ2a staining on gated CD4+CD25hi cells. (F) Graphical analysis of median fluorescence intensity of Fcγ2a on gated CD4+CD25hi cells. Data shown as mean ± SD, significance determined by repeated-measures two-Way ANOVA with the Geisser-Greenhouse correction followed by Tukey post-test. Data representative of three biological replicates. (G) Serum levels and (H) calculated in vivo half-life of the indicated Fc.IL-2 molecules in B6 mice after a single 4μg dose. Data shown as mean ± SD, n=2–3 mice/time point.
Fig. 4.
Fig. 4.. Fc.Mut24 induces selective Treg cell enrichment and arrests ongoing autoimmunity in NOD mice.
(A) Representative analyses of Foxp3 and Ki-67 expression in the indicated tissues of female NOD mice 4 days after treatment with PBS, Fc.WT or Fc.Mut24 (15μg). Graphical summaries of (B) Treg cell frequencies and ratios of (C) Treg:CD8+ and (D) Treg:NK in the pancreas after the indicated treatments. Data shown as mean ± SD, significance determined by one-way ANOVA followed by Tukey post-test. Representative of two independent experiments with n=5 mice/group. (E and F) Diabetes incidence in female NOD mice treated with PBS, Fc.WT or Fc.Mut24. Arrows indicate time of dosing. Significance determined by Log-rank (Mantel-Cox) test, *p<0.05, **p<0.01, ****p<0.0001, n=7–8 in (E) and n=9–11 in (F). (G) Pie chart representing the severity of insulitis in disease free mice at the end of the experiment shown in (F) on a severity scale of 0–3. (H) Representative H&E staining of a grade 3 islet from a PBS-treated mouse and three grade 0 islets from an Fc.Mut24-treated mouse (scale bar 100μm).

References

    1. Malek TR, The biology of interleukin-2. Annu. Rev. Immunol 26, 453–479 (2008). - PubMed
    1. Abbas AK, Trotta E, Simeonov DR, Marson A, Bluestone JA, Revisiting IL-2: Biology and therapeutic prospects. Sci. Immunol 3, eaat1482 (2018). - PubMed
    1. Wang X, Rickert M, Garcia KC, Structure of the quaternary complex of interleukin-2 with its α, β and γc receptors. Science. 310, 1159–1163 (2005). - PubMed
    1. Sakaguchi S, Sakaguchi N, Asano M, Itoh M, Toda M, Immunologic self-tolerance maintained by activated T cells expressing IL-2 receptor alpha-chains (CD25). Breakdown of a single mechanism of self-tolerance causes various autoimmune diseases. J. Immunol 155, 1151–1164 (1995). - PubMed
    1. Fontenot JD, Rasmussen JP, Gavin MA, Rudensky AY, A function for interleukin 2 in Foxp3-expressing regulatory T cells. Nat Immunol 6, 1142–1151 (2005). - PubMed

Publication types

MeSH terms