. 2020 Oct 16;295(42):14445-14457.
doi: 10.1074/jbc.RA120.015292. Epub 2020 Aug 14.

Atypical TRAV1-2- T cell receptor recognition of the antigen-presenting molecule MR1

Affiliations

Atypical TRAV1-2- T cell receptor recognition of the antigen-presenting molecule MR1

Wael Awad et al. J Biol Chem. .

Abstract

MR1 presents vitamin B-related metabolites to mucosal associated invariant T (MAIT) cells, which are characterized, in part, by the TRAV1-2+ αβ T cell receptor (TCR). In addition, a more diverse TRAV1-2- MR1-restricted T cell repertoire exists that can possess altered specificity for MR1 antigens. However, the molecular basis of how such TRAV1-2- TCRs interact with MR1-antigen complexes remains unclear. Here, we describe how a TRAV12-2+ TCR (termed D462-E4) recognizes an MR1-antigen complex. We report the crystal structures of the unliganded D462-E4 TCR and its complex with MR1 presenting the riboflavin-based antigen 5-OP-RU. Here, the TRBV29-1 β-chain of the D462-E4 TCR binds over the F'-pocket of MR1, whereby the complementarity-determining region (CDR) 3β loop surrounded and projected into the F'-pocket. Nevertheless, the CDR3β loop anchored proximal to the MR1 A'-pocket and mediated direct contact with the 5-OP-RU antigen. The D462-E4 TCR footprint on MR1 contrasted that of the TRAV1-2+ and TRAV36+ TCRs' docking topologies on MR1. Accordingly, diverse MR1-restricted T cell repertoire reveals differential docking modalities on MR1, thus providing greater scope for differing antigen specificities.

Keywords: : Antigen presentation; MAIT; MHC-related molecule (MR1); T-cell receptor (TCR); atypical MAIT TCR; crystal structure; immunology; major histocompatibility complex (MHC); protein structure; receptor structure-function.


Conflict of interest statement

Conflict of interest—J. R., J. M., L. L., and D. P. F. are named inventors on patent applications (PCT/AU2013/000742, WO2014005194) (PCT/AU2015/050148, WO2015149130) involving MR1 ligands for MR1-restricted MAIT cells owned by University of Queensland, Monash University, and University of Melbourne.

Figures

Figure 1.
Figure 1.
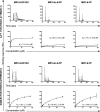
An atypical TRAV12-2+ T cell clone is activated by MR1–5-OP-RU. a, staining of T cell lineage markers, TRAV1-2 TCR, with MR1 tetramers loaded with either 6-FP or 5-OP-RU on two T cell clones: D462-E4 (top) and D426-G11 (bottom). Geometric mean fluorescence intensity (MFI) of the MR1-tetramer staining is shown in the inset in the overlaid histograms. b, TCR αβ gene names and CDR3 amino acid sequences of the D462-E4 T cell clone. c, T cell clone IFN-γ responses to MR1-6FP (open squares) or MR1-5-OP-RU tetramer (black circles) dilutions at concentrations listed on the x axis. MR1 blocking antibody (open circles) or its isotype control (black squares) was also added to MR1-5-OP-RU Tetraspot wells as indicated. IFN-γ response is quantified by spot forming units of ELISPOT assay. The EC50 for each clone's response to MR1-5-OP-RU is listed under the graph. Error bars represent the mean and S.D. from technical replicates.
Figure 2.
Figure 2.
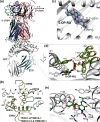
Steady-state affinity measurements of MR1-restricted TCRs. The affinity of TCR-MR1-Ag interactions were determined using SPR, by measuring the binding of various concentrations of soluble TRAV1-2+ A-F7 TCR (100–0.024 μm) and TRAV1-2 D426-E4 TCR (140–0.024 μm) against human MR1 refolded with 5-OP-RU, Ac-6-FP, and 6-FP. SPR runs were conducted as duplicate in three independent experiments using different batches of proteins. The SPR sensograms, equilibrium curves, and steady state KD values (µm) were prepared in GraphPad Prism 7.
Figure 3.
Figure 3.
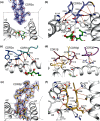
Structural comparison of ternary complexes of TRAV1-2+ and TRAV1-2 TCRs with MR1-5-OP-RU. Crystal structures of ternary complexes. a–c, A-F7 (TRAV1-2/TRBV6-1) TCR-MR1-5-OP-RU (PDB ID: 4NQC). d–f, D426-E4 (TRAV12-2/TRBV29-1) TCR-MR1-5-OP-RU. g–i, MAV36 (TRAV36/TRBV28) TCR-MR1-5-OP-RU (PDB ID: 5D7L). a, d, and g, top panels, depict ribbon diagrams of the ternary complexes and pie charts representing the contribution of each TCR segment toward the MR1-5-OP-RU complex. The MR1 and β2-microglobulin molecules are colored white and pale cyan, respectively, and 5-OP-RU is presented as green sticks. A-F7 TCRα, olive; A-F7 TCRβ, orange; D426-E4 TCRα, blue; D426-E4 TCRβ, light-pink; MAV36 TCRα, violet-purple; MAV36 TCRβ, light brown. b, e, and h, middle panels, show the TCRs and their CDR loops docking into MR1. The center of mass of the respective TRAV and TRBV variable domains are shown as a sphere colored consistent with chain colors in the upper panels. The CDR loops are colored as follows: CDR1α, teal; CDR2α, sky-blue; CDR3α, light-blue; frameworks of α-chain, dark-green; CDR1β, maroon; CD2β, violet; CDR3β, yellow-orange; frameworks of β-chain, dark-gray. c, f, and i, lower panels, illustrate the TCR footprints on the molecular surface of MR1-5-OP-RU. The atomic footprint is colored according to the TCR segment making contact.
Figure 4.
Figure 4.
MR1 conformational changes upon interactions with D426-E4 TCR. a, comparison of TRAV1-2 D426-E4 ternary complex relative to the TRAV1-2+ TCR docking positions. Arrows illustrate TCR rotation around the center of mass of the MR1, as well as displacement of β-chain along the MR1 binding cleft. The colors of the TCR chains are consistent with Fig. 3a. b, superposition of the CDR loops of A-F7 (yellow) and D426-E4 (green) TCRs sitting atop MR1. c, working (2FoFc) map of 5-OP-RU inside MR1 pocket, showing two alternate conformations of the antigen. d, comparison of the MR1 antigen binding pocket and the position of Tyr-152 in both of A-F7 (yellow) and D426-E4 (green) ternary structures. e, interactions of 5-OP-RU and the residues of MR1 A′ portal in the D426-E4 TCR-MR1-5-OP-RU structure.
Figure 5.
Figure 5.
Molecular contacts of the D426-E4 TCR-MR1 complex. a–f, interactions between MR1 and (a and b) the CDR3α, (c) CDR1α and CDR2α, (d) CDR1β and CDR2β, and (e and f) CDR3β. The working (2FoFc) map of CDR3α and CDR3β is shown in panels a and e, respectively. The colors of all loops are consistent with Fig. 3. The interacting residues are represented as sticks. Hydrogen bonds, and van der Waals interactions are represented by black, orange dashes, respectively. See also Table 3.
Figure 6.
Figure 6.
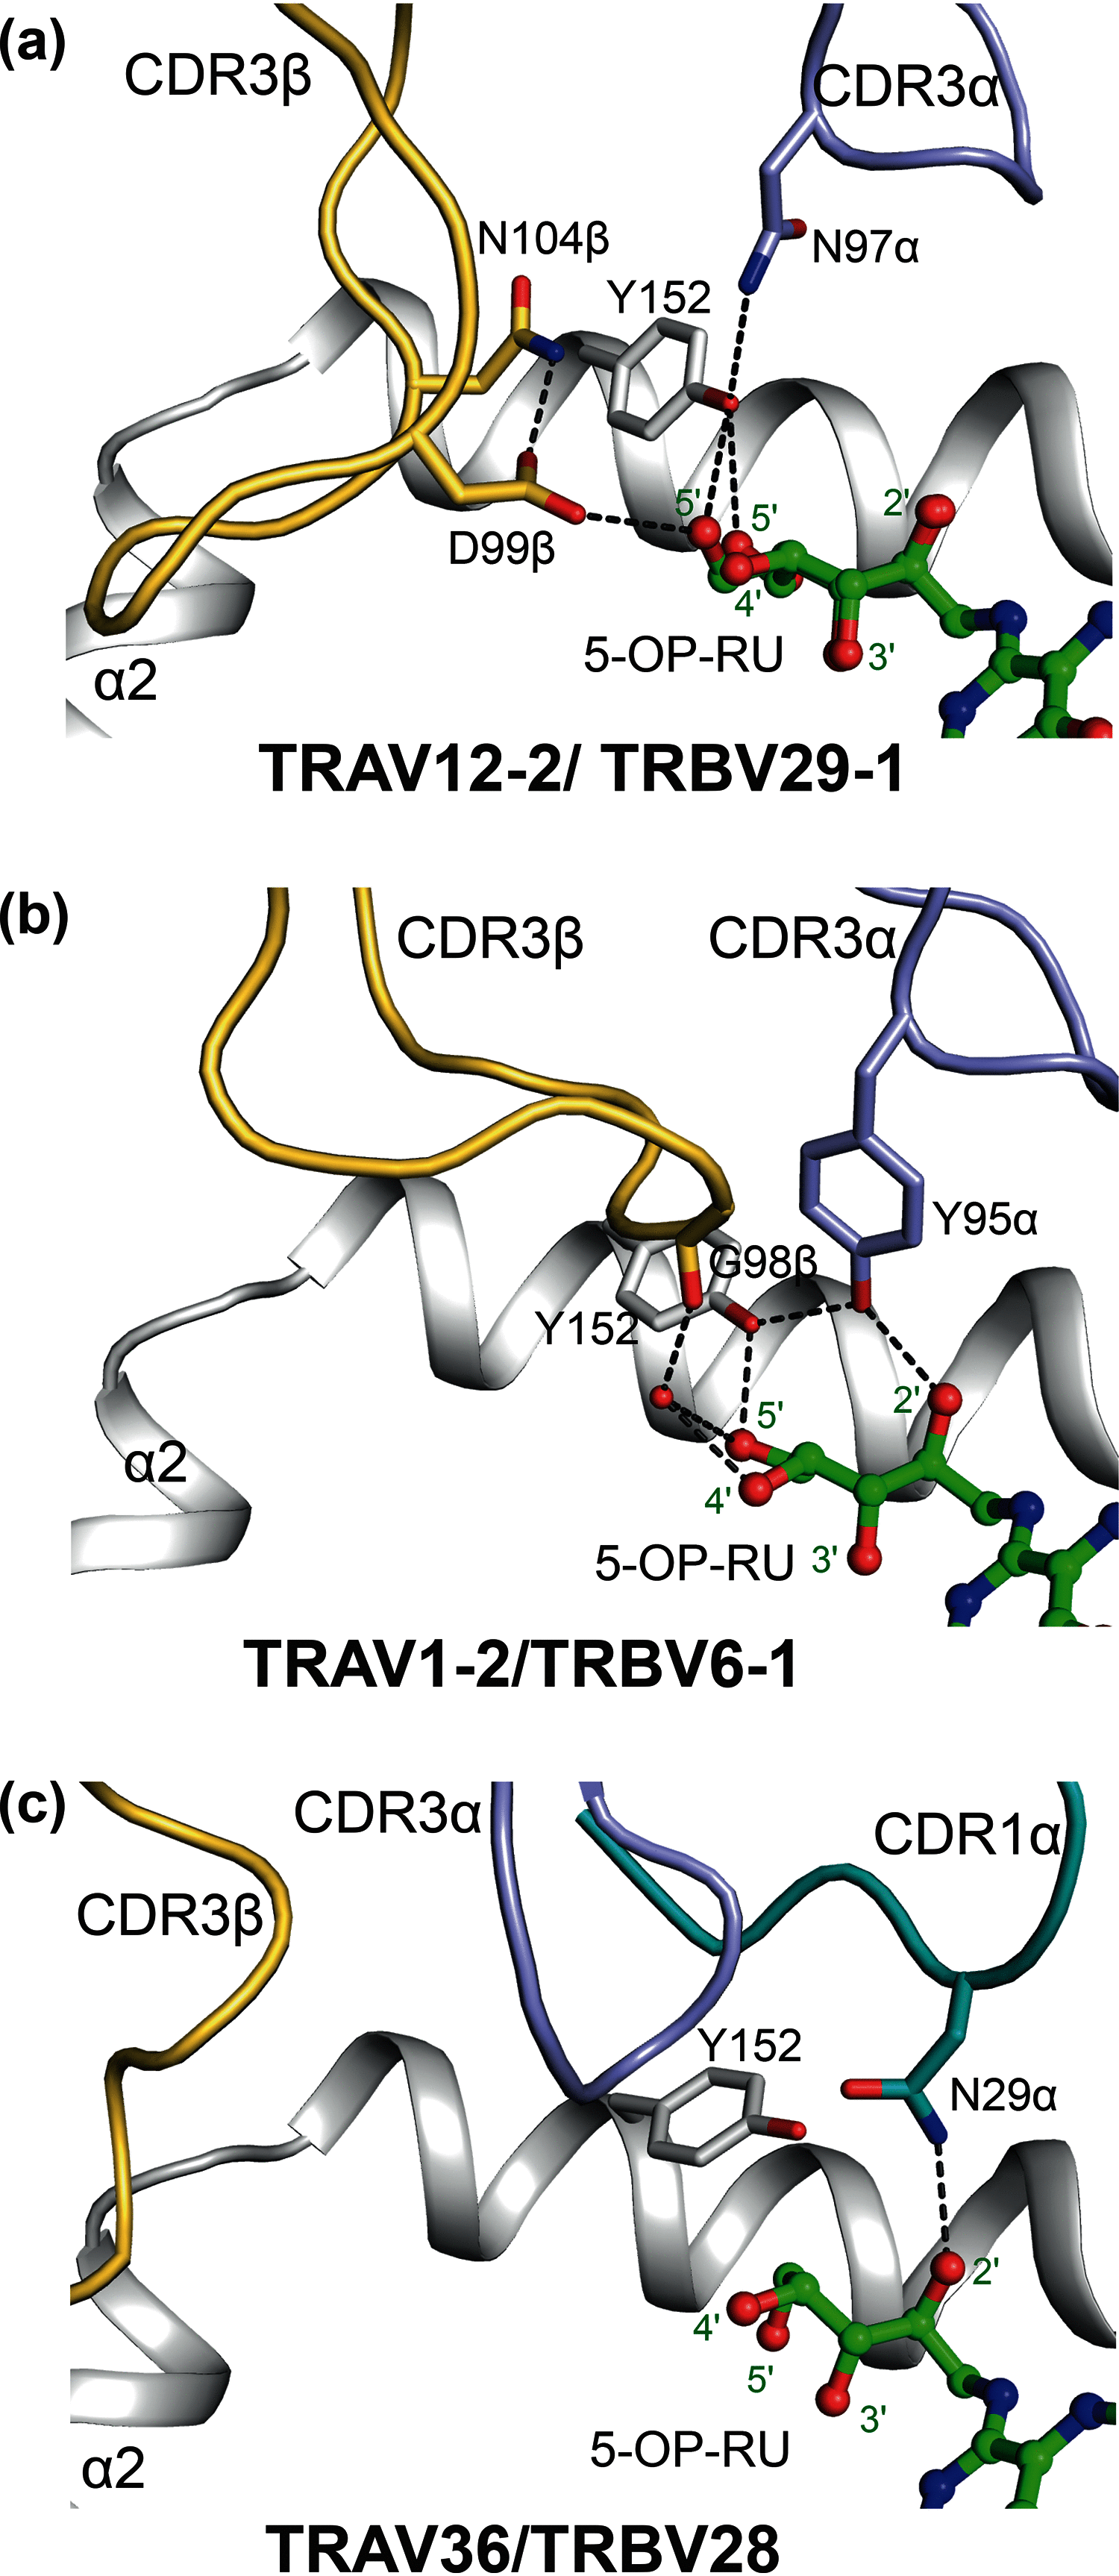
Recognition of riboflavin metabolite by TRAV1-2+ and TRAV1-2 TCRs. a, interactions of the CDR3β of the D426-E4 TCR, depicting the direct and indirect polar contacts with 5-OP-RU ligand. b, interactions of CDR3α of TRAV1-2+ A-F7 TCR with 5-OP-RU, showing the interaction triad between Tyr-152 of MR1, Tyr-95α of CDR3α, and 5-OP-RU. c, polar contacts of CDR1α of MAV36 TCR with 5-OP-RU, including the locations of CDR3α and CDR3β. The color coding is consistent with Figs. 3 and 5.
Figure 7.
Figure 7.
Comparison of free and liganded D426-E4 TCR structures. a, superposition of the variable domains (Vα and Vβ) of the free (pink) and bound to MR1 (light-blue) D426-E4 TCR. Vα and Vβ domains are shown as ribbon, and arrows show molecular adjustments of the variable domains upon complexation with MR1. The right panel shows the bottom view of various CDR loops. The TCRs were aligned via the variable domains of the two TCRs in PyMOL. b, the side chain residues of the CDR1α, CDR2α, and CDR3α loops of the aligned domains are shown as sticks. c and d, the side chain residues of CDR3β (c) and CDR1β and CDR2β (d) of the aligned structures are shown as sticks.

References

    1. Kjer-Nielsen L., Patel O., Corbett A. J., Le Nours J., Meehan B., Liu L., Bhati M., Chen Z., Kostenko L., Reantragoon R., Williamson N. A., Purcell A. W., Dudek N. L., McConville M. J., O'Hair R. A. J., et al. (2012) MR1 presents microbial vitamin B metabolites to MAIT cells. Nature 491, 717–723 10.1038/nature11605 - DOI - PubMed
    1. Corbett A. J., Eckle S. B. G., Birkinshaw R. W., Liu L., Patel O., Mahony J., Chen Z., Reantragoon R., Meehan B., Cao H., Williamson N. A., Strugnell R. A., Van Sinderen D., Mak J. Y. W., Fairlie D. P., et al. (2014) T-cell activation by transitory neo-antigens derived from distinct microbial pathways. Nature 509, 361–365 10.1038/nature13160 - DOI - PubMed
    1. Eckle S. B. G., Birkinshaw R. W., Kostenko L., Corbett A. J., McWilliam H. E. G., Reantragoon R., Chen Z., Gherardin N. A., Beddoe T., Liu L., Patel O., Meehan B., Fairlie D. P., Villadangos J. A., Godfrey D. I., et al. (2014) A molecular basis underpinning the T cell receptor heterogeneity of mucosal-associated invariant T cells. J. Exp. Med. 211, 1585–1600 10.1084/jem.20140484 - DOI - PMC - PubMed
    1. Lars K.-N., Corbett A. J., Chen Z., Liu L., Mak J. Y., Godfrey D. I., Rossjohn J., Fairlie D. P., McCluskey J., and Eckle S. B. (2018) An overview on the identification of MAIT cell antigens. Immunol. Cell Biol. 96, 573–587 10.1111/imcb.12057 - DOI - PubMed
    1. Harriff M. J., McMurtrey C., Froyd C. A., Jin H., Cansler M., Null M., Worley A., Meermeier E. W., Swarbrick G., Nilsen A., Lewinsohn D. A., Hildebrand W., Adams E. J., and Lewinsohn D. M. (2018) MR1 displays the microbial metabolome driving selective MR1-restricted T cell receptor usage. Sci. Immunol. 3, eaao2556 10.1126/sciimmunol.aao2556 - DOI - PMC - PubMed

Publication types

MeSH terms

Substances