. 2020 Aug 19;12(557):eaay8798.
doi: 10.1126/scitranslmed.aay8798.

Targeting acid ceramidase inhibits YAP/TAZ signaling to reduce fibrosis in mice

Affiliations

Targeting acid ceramidase inhibits YAP/TAZ signaling to reduce fibrosis in mice

Sarah Alsamman et al. Sci Transl Med. .

Abstract

Hepatic stellate cells (HSCs) drive hepatic fibrosis. Therapies that inactivate HSCs have clinical potential as antifibrotic agents. We previously identified acid ceramidase (aCDase) as an antifibrotic target. We showed that tricyclic antidepressants (TCAs) reduce hepatic fibrosis by inhibiting aCDase and increasing the bioactive sphingolipid ceramide. We now demonstrate that targeting aCDase inhibits YAP/TAZ activity by potentiating its phosphorylation-mediated proteasomal degradation via the ubiquitin ligase adaptor protein β-TrCP. In mouse models of fibrosis, pharmacologic inhibition of aCDase or genetic knockout of aCDase in HSCs reduces fibrosis, stromal stiffness, and YAP/TAZ activity. In patients with advanced fibrosis, aCDase expression in HSCs is increased. Consistently, a signature of the genes most down-regulated by ceramide identifies patients with advanced fibrosis who could benefit from aCDase targeting. The findings implicate ceramide as a critical regulator of YAP/TAZ signaling and HSC activation and highlight aCDase as a therapeutic target for the treatment of fibrosis.


Figures

Fig. 1.
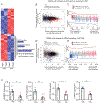
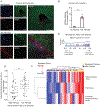
Fig. 1.. Ceramide regulates the Hippo signaling pathway in human hepatic stellate cells.
(A) Heatmap of genes profiled by RNASeq induced (red) or repressed (blue) at ≥1.5-log fold change (false discovery rate (FDR) < 0.05) in HSCs treated with ceramide-C6 (25 μM, Cer) compared to ethanol vehicle (Veh). Canonical pathways downregulated by ceramide are shown to the right. (B) The genes most up- (red, n=97) and downregulated (blue, n=48) in activated as compared to quiescent human HSCs (33) overlaid on the mean difference plot for all genes (additional genes: black) profiled in HSCs treated with ceramide versus vehicle (downregulated below x-axis). Genes downregulated with HSC activation are enriched amongst genes upregulated by ceramide (blue points mostly above the x-axis, GSEA P < 0.01). Genes upregulated with HSC activation are enriched amongst genes downregulated by ceramide (red points mostly below the x-axis, GSEA P < 0.0001). (C) A barcode plot in which the vertical lines represent the same genes most up- (red) and downregulated (blue) after HSC activation positioned by rank amongst all genes in ceramide-treated HSCs ordered from least to most upregulated with ceramide (light blue to pink in the underlying color bar). Red lines are clustered to the left and the enrichment score line plot below crosses the dashed line once, showing enrichment of genes upregulated with HSC activation amongst genes downregulated by ceramide. Blue lines are clustered to the right, showing enrichment of genes downregulated with HSC activation amongst genes upregulated by ceramide. Similar (D) mean difference and (E) barcode plots as in (B and C) but using genes most up- (red, n=61) and downregulated (blue, n=92) after YAP/TAZ depletion by siRNAs in HepG2 cells (35) at FDR < 0.05 for the comparison to genes up- and downregulated with ceramide treatment in HSCs. Genes downregulated with YAP/TAZ depletion are enriched amongst genes downregulated by ceramide (P < 0.0001). (F) qRT-PCR quantified expression (mean ± s.e.m.) of the indicated genes after treatment with ethanol vehicle or ceramide-C6 (25 μM) for 48 hours, compared using unpaired two-sided student t-tests. Samples are normalized to GAPDH. n = 6 biologically independent samples and results are representative of 3 independent experiments. Data are expressed as mean ± s.e.m. For GSEA, statistical analysis was performed with CAMERA. (* P < 0.05; ** P < 0.01, *** P < 0.001, **** P < 0.0001).
Fig. 2.
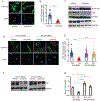
Fig. 2.. Ceramide inhibits YAP/TAZ nuclear localization and promotes β-TrCP-mediated proteasomal degradation of YAP/TAZ.
(A, B) Human HSCs were treated with ethanol vehicle (left) or ceramide-C6 (25 μM, right) for 6 hours. (A) Immunofluorescence (IF) with anti-YAP/TAZ antibody (top, green) and DAPI (bottom, blue). Scale bar: 10 μm. (B) Quantification of YAP/TAZ mean fluorescence nucleocytoplasmic intensity ratio (N/C ratio) was performed for 50 cells per condition. (C) Expression of Phospho-YAP (Ser397), TAZ, and GAPDH were quantified by Western blot from HSCs treated with ethanol vehicle (left) or ceramide-C6 (25 μM, right) for 6 hours. Expression of YAP and GAPDH were quantified by Western blot after treatment for 72 hours. Cropped gel images are shown. (D-G) HSCs were transfected with a nontargeting (control) siRNA or siRNA targeting BTRC (β-TrCP). After 48 hours, cells were treated with ethanol vehicle or ceramide-C6 (25 μM) for 6 hours. (D) IF with anti-YAP/TAZ antibody (top, green) and DAPI (bottom, blue). Scale bar: 10 μm. (E) Quantification of IF staining showing YAP/TAZ N/C ratio measured in 50 cells for each condition. (F) Expression of TAZ and GAPDH were quantified by Western blot. Cropped gel images are shown. (G) The ratio of TAZ to GAPDH is shown.n = 3 biologically independent samples and results are representative of 3 independent experiments. Data are expressed as mean ± s.e.m. Subsequent statistical analysis was performed with unpaired two-sided student t-tests or one-way ANOVA with Tukey’s method for multiple comparisons. (* P < 0.05; ** P < 0.01, *** P < 0.001, **** P < 0.0001).
Fig. 3.
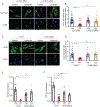
Fig. 3.. Ceramide regulation of YAP/TAZ localization and HSC activation is mediated by LATS1/2.
(A, B) HSCs were transfected with nontargeting siRNAs (control) or siRNAs targeting LATS1 and LATS2. After 72 hours, cells were treated with ethanol vehicle or ceramide-C6 (25 μM) for 6 hours. (A) IF with anti-YAP/TAZ antibody (top, green) and DAPI (bottom, blue). Scale bar: 10 μm. (B) Quantification of YAP/TAZ N/C ratio was performed for 50 cells per condition. (C-F) HSCs were nucleofected with FLAG-tagged hYAP or hYAPS397A. After 24 hours, cells were treated with ethanol vehicle or ceramide-C6 (25 μM) for 6 hours. (C) IF with anti-FLAG antibody (top, green) and DAPI (bottom, blue). Scale bar: 10 μm. (D) Quantification of FLAG N/C ratio was performed for 50 cells per condition. (E, F) qRT-PCR was performed to quantify expression of the indicated genes. Samples were normalized to GAPDH. n = 8 biologically independent samples and results are representative of 3 independent experiments. Data are expressed as mean ± s.e.m. Subsequent statistical analysis was performed with one-way ANOVA with Tukey’s method for multiple comparisons. (* P < 0.05, ** P < 0.01, **** P < 0.0001).
Fig. 4.
Fig. 4.. aCDase deficiency in HSCs reduces CCl4-induced liver fibrosis in mice.
(A) Olive oil (OO) or CCl4 was administered three times a week by IP injection for 6 weeks to control (Ctrl) and cACKO mice. (B) Hepatic hydroxyproline was measured in mice from each treatment group. (C) Representative images of liver tissues with Sirius-red staining. Scale bar: 100 μm. (D) Morphometric assessment of the collagen proportional area (CPA) on Sirius-red stained slides. n=6 in each group. (E) Representative IF images of liver tissues for α-SMA (ACTA2, green), DAPI (blue), and YAP (red). Scale bar: 30 μm. (F) Quantification of YAP N/C ratio was performed for at least 200 α-SMA positive cells per mouse. n=3 Ctrl+OO, n=3 cACKO+ OO, n=5 Ctrl+CCl4, n=7 cACKO+CCl4. (G) Images of liver tissues stained with picrosirius red and Weigert's hematoxylin viewed under brightfield (left) and orthogonal polarizing filters (right). Scale bar: 100 μm. White box (50x50 μm) area is representative of an area where an AFM Force Map indentation of 8x8 points was performed. (H) Scatter plot of elastic modulus (a measure of stiffness) values in Pascals (Pa) measured by AFM in tissue sections of livers of Ctrl and cACKO mice treated with CCl4 (n = 3 mice per group and 2 tissue sections from each mouse, 3 to 4 50 x 50 μm regions per section, 64 indentations per map). Mean ± SD. (I) Histograms of elastic modulus values from (F) from livers of Ctrl and cACKO mice treated with CCl4. Data are expressed as mean ± s.e.m unless indicated and results are representative of 2 independent experiments. Subsequent statistical analysis was performed with one-way ANOVA with Tukey’s method for multiple comparisons or nonparametric two-sided Mann-Whitney test. (* P < 0.05; ** P < 0.01, **** P < 0.0001).
Fig. 5.
Fig. 5.. aCDase deficiency in HSCs reduces NASH fibrosis in mice.
(A) Ctrl or cACKO mice were fed normal diet (ND) or choline-deficient, L-amino acid-defined, high-fat diet (CDAHFD) for 14 weeks. (B) Hepatic hydroxyproline was measured in mice from each treatment group. (C) Representative images of liver sections with Sirius-red staining. Scale bar: 100 μm. (D) Morphometric assessment of CPA on Sirius-red stained slides. n=10 Ctrl+ND, n=7 cACKO+ND, n=10 Ctrl+CDAHFD, n=7 cACKO+CDAHFD. (E) Representative images of liver sections with H&E staining. Scale bar: 300 μm. (F, G) Histologic evaluation of steatosis and lobular inflammation. n=11 in Ctrl+ND, n=7 cACKO+ND, n=10 Ctrl+CDAHFD, n=7 cACKO+CDAHFD. (H) Liver weight to body weight ratio. n=11 in Ctrl+ND, n=10 cACKO+ND, n=8 Ctrl+CDAHFD, n=8 cACKO+CDAHFD. (I) Serum alanine aminotransferase (ALT). n=11 Ctrl+ND, n=10 cACKO+ND, n=11 Ctrl+ CDAHFD, n=10 cACKO+CDAHFD. (J) Quantitative hepatic triglycerides. n=5 Ctrl+ND, n=5 cACKO+ND, n=11 Ctrl+CDAHFD, n=10 cACKO+CDAHFD. Data are expressed as mean ± s.e.m and results are representative of 2 independent experiments. Subsequent statistical analysis was performed with one-way ANOVA with Tukey’s method for multiple comparisons or Kruskal-Wallis test with Dunn’s multiple comparisons test. (** P < 0.01, *** P < 0.001, **** P < 0.0001).
Fig. 6.
Fig. 6.. aCDase inhibition ameliorates liver fibrosis.
(A) C57BL/6J mice received olive oil (OO) or CCl4 three times a week by IP injection for a total of 9 weeks. B13 (50 mg/kg) or vehicle (Veh) were concomitantly administered by IP injection five times per week for the last 3 weeks of OO or CCl4 treatment. (B) Hepatic hydroxyproline was measured in mice from each treatment group. n=9 OO+Veh, n=7 OO+B13, n=9 CCl4+Veh, and n=8 CCl4+B13.(C) Representative images of liver sections with Sirius-red staining. Scale bar: 100 μm. (D) Morphometric assessment of CPA on Sirius-red stained slides. n=9 OO+Veh, n=7 OO+B13, n=9 CCl4+Veh, and n=7 CCl4+B13. (E) Rats were fed CDAHFD for 18 weeks, and precision cut liver slices (PCLS) were prepared. Rat PCLS were treated with ethanol vehicle (Veh), B13 150 μM, or B13 450 μM; or DMSO vehicle (Veh), Ceranib1 5 μM, or Ceranib1 50 μM for 48 hours. (F, G) Gene expression assessment using nCounter technology was performed to quantify expression of the indicated genes. mRNA counts were normalized to housekeeping genes (Hprt1, Polr1b, Rplp0, Srfs4, Ubc and Gusb), and expression relative to the appropriate vehicle control group from the same rat liver is reported. n = 4 rats per treatment group, and three slices from each rat were included in each treatment group. (H) PCLS were prepared from the livers of 2 patients with cirrhosis undergoing liver transplantation, one with alcoholic cirrhosis and one with primary biliary cirrhosis. Human cirrhotic PCLS were treated with DMSO vehicle (Veh) or Ceranib1 50 uM for 48 hours. (I) Gene expression assessment using nCounter technology was performed to quantify expression of the indicated genes. mRNA counts were normalized to housekeeping genes (HPRT1, POLR1B, RPLP0, SRFS4, UBC, and GUSB), and expression relative to the appropriate vehicle control group from the same patient is reported. n = 2 patients per treatment group, and three slices from each patient were included in each treatment group. Data are expressed as mean ± s.e.m. Subsequent statistical analysis was performed with unpaired two-sided student t-tests or one-way ANOVA with Tukey’s method for multiple comparisons. (* P < 0.05; ** P < 0.01, *** P < 0.001, **** P < 0.0001).
Fig. 7.
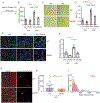
Fig. 7.. aCDase and the ceramide responsiveness score are increased in patients with advanced liver fibrosis.
(A) Representative IF images for albumin (ALB), α-SMA (ACTA2), aCDase (ASAH1), and DAPI in liver sections from patients with chronic hepatitis C virus (HCV) infection and no fibrosis (top) and those with chronic HCV and advanced fibrosis (bottom). Scale bar: 150 μm (top), 50 μm (bottom)μm. (B) Quantification of aCDase staining among activated HSCs. n = 5 in no fibrosis and n = 5 in advanced fibrosis. (C) The barcode plot represents the 100 genes most downregulated by ceramide as blue vertical lines positioned by rank amongst all genes profiled by microarray in an NAFLD dataset ordered by genes most downregulated to most upregulated by log fold change in participants with advanced fibrosis (stage 3-4, n=32) as compared to mild fibrosis (Stage 0-1, n=40) (54). Blue lines are clustered to the right and the enrichment score line plot below crosses the dashed line once, indicating enrichment of genes downregulated by ceramide amongst genes upregulated in advanced fibrosis (GSEA P <0.0001). (D) A ceramide responsiveness score was generated by combining the 100 genes most downregulated by ceramide treatment into one metric using gene set variation analysis (GSVA). The boxplots compare this score between NAFLD patients with mild fibrosis (left) and advanced fibrosis (right). (E) Heatmap of gene signature scores for the specified biologic pathways generated in GSVA (rows) clustered by participants in the NAFLD dataset (columns), with high signature expression in red and low in blue. Participants with advanced and mild fibrosis are indicated by yellow and purple, respectively, in the above color bar. Clustering is by Euclidean distance with average linkage. Statistical analysis was performed with unpaired two-sided student t-tests or with CAMERA for GSEA. (*** P < 0.001, **** P < 0.0001).

References

    1. Wynn TA, Fibrotic disease and the T(H)1/T(H)2 paradigm. Nat Rev Immunol 4, 583–594 (2004). - PMC - PubMed
    1. Liu F, Mih JD, Shea BS, Kho AT, Sharif AS, Tager AM, Tschumperlin DJ, Feedback amplification of fibrosis through matrix stiffening and COX-2 suppression. J Cell Biol 190, 693–706 (2010). - PMC - PubMed
    1. Arora PD, Narani N, McCulloch CA, The compliance of collagen gels regulates transforming growth factor-beta induction of alpha-smooth muscle actin in fibroblasts. Am J Pathol 154, 871–882 (1999). - PMC - PubMed
    1. Li Z, Dranoff JA, Chan EP, Uemura M, Sevigny J, Wells RG, Transforming growth factor-beta and substrate stiffness regulate portal fibroblast activation in culture. Hepatology 46, 1246–1256 (2007). - PubMed
    1. Georges PC, Hui JJ, Gombos Z, McCormick ME, Wang AY, Uemura M, Mick R, Janmey PA, Furth EE, Wells RG, Increased stiffness of the rat liver precedes matrix deposition: implications for fibrosis. Am J Physiol Gastrointest Liver Physiol 293, G1147–1154 (2007). - PubMed

Publication types

Substances