Immune profiling of plasma-derived extracellular vesicles identifies Parkinson disease
- PMID: 32817412
- PMCID: PMC7428368
- DOI: 10.1212/NXI.0000000000000866
Immune profiling of plasma-derived extracellular vesicles identifies Parkinson disease
Abstract
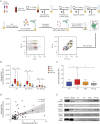
Objective: To develop a diagnostic model based on plasma-derived extracellular vesicle (EV) subpopulations in Parkinson disease (PD) and atypical parkinsonism (AP), we applied an innovative flow cytometric multiplex bead-based platform.
Methods: Plasma-derived EVs were isolated from PD, matched healthy controls, multiple system atrophy (MSA), and AP with tauopathies (AP-Tau). The expression levels of 37 EV surface markers were measured by flow cytometry and correlated with clinical scales. A diagnostic model based on EV surface markers expression was built via supervised machine learning algorithms and validated in an external cohort.
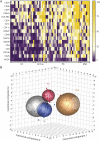
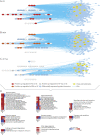
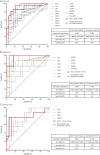
Results: Distinctive pools of EV surface markers related to inflammatory and immune cells stratified patients according to the clinical diagnosis. PD and MSA displayed a greater pool of overexpressed immune markers, suggesting a different immune dysregulation in PD and MSA vs AP-Tau. The receiver operating characteristic curve analysis of a compound EV marker showed optimal diagnostic performance for PD (area under the curve [AUC] 0.908; sensitivity 96.3%, specificity 78.9%) and MSA (AUC 0.974; sensitivity 100%, specificity 94.7%) and good accuracy for AP-Tau (AUC 0.718; sensitivity 77.8%, specificity 89.5%). A diagnostic model based on EV marker expression correctly classified 88.9% of patients with reliable diagnostic performance after internal and external validations.
Conclusions: Immune profiling of plasmatic EVs represents a crucial step toward the identification of biomarkers of disease for PD and AP.
Copyright © 2020 The Author(s). Published by Wolters Kluwer Health, Inc. on behalf of the American Academy of Neurology.
Figures

Similar articles
-
Profiling Inflammatory Extracellular Vesicles in Plasma and Cerebrospinal Fluid: An Optimized Diagnostic Model for Parkinson's Disease.Biomedicines. 2021 Feb 25;9(3):230. doi: 10.3390/biomedicines9030230. Biomedicines. 2021. PMID: 33669043 Free PMC article.
-
α-Synuclein in blood exosomes immunoprecipitated using neuronal and oligodendroglial markers distinguishes Parkinson's disease from multiple system atrophy.Acta Neuropathol. 2021 Sep;142(3):495-511. doi: 10.1007/s00401-021-02324-0. Epub 2021 May 15. Acta Neuropathol. 2021. PMID: 33991233 Free PMC article.
-
Plasma biomarkers of decreased vesicular storage distinguish Parkinson disease with orthostatic hypotension from the parkinsonian form of multiple system atrophy.Clin Auton Res. 2015 Feb;25(1):61-7. doi: 10.1007/s10286-015-0268-z. Epub 2015 Feb 1. Clin Auton Res. 2015. PMID: 25638582 Free PMC article.
-
Extracellular Vesicle Surface Markers as a Diagnostic Tool in Transient Ischemic Attacks.Stroke. 2021 Oct;52(10):3335-3347. doi: 10.1161/STROKEAHA.120.033170. Epub 2021 Aug 4. Stroke. 2021. PMID: 34344167
-
Different diagnostic criteria for Parkinson disease: what are the pitfalls?J Neural Transm (Vienna). 2013 Apr;120(4):619-25. doi: 10.1007/s00702-013-1007-z. Epub 2013 Mar 15. J Neural Transm (Vienna). 2013. PMID: 23494196 Review.
Cited by
-
Extracellular vesicles in the study of Alzheimer's and Parkinson's diseases: Methodologies applied from cells to biofluids.J Neurochem. 2022 Nov;163(4):266-309. doi: 10.1111/jnc.15697. Epub 2022 Oct 22. J Neurochem. 2022. PMID: 36156258 Free PMC article. Review.
-
Profiling Inflammatory Extracellular Vesicles in Plasma and Cerebrospinal Fluid: An Optimized Diagnostic Model for Parkinson's Disease.Biomedicines. 2021 Feb 25;9(3):230. doi: 10.3390/biomedicines9030230. Biomedicines. 2021. PMID: 33669043 Free PMC article.
-
Risk stratification of patients with SARS-CoV-2 by tissue factor expression in circulating extracellular vesicles.Vascul Pharmacol. 2022 Aug;145:106999. doi: 10.1016/j.vph.2022.106999. Epub 2022 May 18. Vascul Pharmacol. 2022. PMID: 35597450 Free PMC article.
-
Extracellular Vesicles for the Diagnosis and Treatment of Parkinson's Disease.Aging Dis. 2021 Sep 1;12(6):1438-1450. doi: 10.14336/AD.2021.0516. eCollection 2021 Sep. Aging Dis. 2021. PMID: 34527420 Free PMC article. Review.
-
Surface protein profiling of milk and serum extracellular vesicles unveils body fluid-specific signatures.Sci Rep. 2023 May 30;13(1):8758. doi: 10.1038/s41598-023-35799-w. Sci Rep. 2023. PMID: 37253799 Free PMC article.
