. 2020 Sep 1;117(35):21403-21412.
doi: 10.1073/pnas.2008645117. Epub 2020 Aug 19.

Phosphorylated CtIP bridges DNA to promote annealing of broken ends

Affiliations

Phosphorylated CtIP bridges DNA to promote annealing of broken ends

Robin Öz et al. Proc Natl Acad Sci U S A. .

Abstract

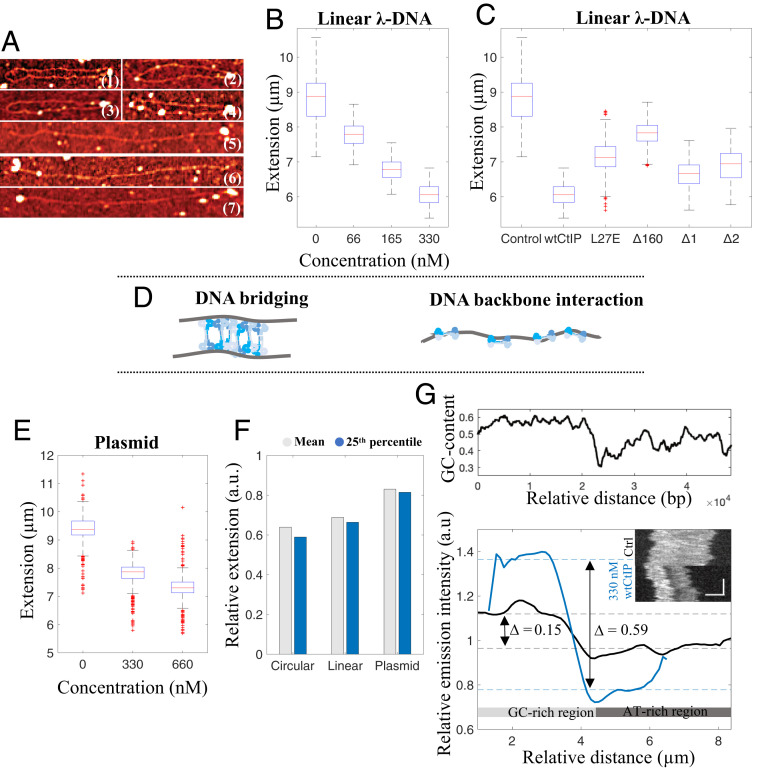
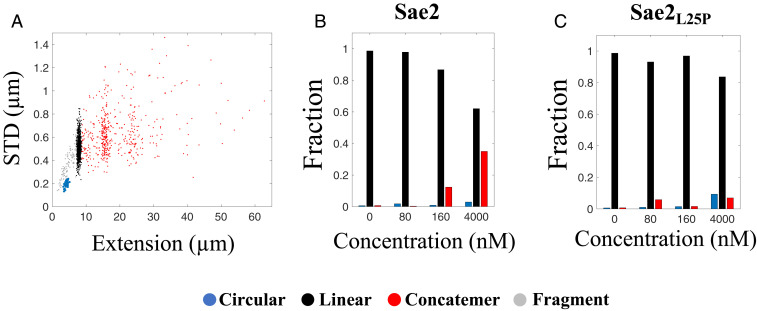
The early steps of DNA double-strand break (DSB) repair in human cells involve the MRE11-RAD50-NBS1 (MRN) complex and its cofactor, phosphorylated CtIP. The roles of these proteins in nucleolytic DSB resection are well characterized, but their role in bridging the DNA ends for efficient and correct repair is much less explored. Here we study the binding of phosphorylated CtIP, which promotes the endonuclease activity of MRN, to single long (∼50 kb) DNA molecules using nanofluidic channels and compare it to the yeast homolog Sae2. CtIP bridges DNA in a manner that depends on the oligomeric state of the protein, and truncated mutants demonstrate that the bridging depends on CtIP regions distinct from those that stimulate the nuclease activity of MRN. Sae2 is a much smaller protein than CtIP, and its bridging is significantly less efficient. Our results demonstrate that the nuclease cofactor and structural functions of CtIP may depend on the same protein population, which may be crucial for CtIP functions in both homologous recombination and microhomology-mediated end-joining.

Keywords: CtIP; DNA repair; homologous recombination; nanofluidics; single DNA molecule biophysics.


Conflict of interest statement

The authors declare no competing interest.

Figures

Fig. 1.
Fig. 1.
Linearization of a confined circular DNA molecule in a nanofluidic channel. (A) Schematic illustration of a nanofluidic device with four loading reservoirs, two horizontal microchannels, and multiple vertical nanochannels. The magnification of the nanochannels visualizes the spontaneous unfolding of a schematic circular DNA molecule with time (in the direction of the arrow). (B) Representative kymograph showing the characteristic unfolding of a confined circular λ-DNA–CtIP complex, where the boxed regions highlight the circular (Left) and linear (Right) conformations of the molecule with time elapsing in the direction of the arrow. The vertical and horizontal scale bars correspond to 5 µm and 5 s, respectively. (C) The change in DNA extension with time upon unfolding of DNA from the circular to the linear conformation. The circular conformation has a mean extension of 3.6 µm (bottom red line) with an STD of 0.2 µm (bottom gray patch). The linear conformation has a mean extension of 6.0 µm (top red line) with a corresponding STD of 0.5 µm (top gray patch). (D) Scatterplot of molecule extension vs. STD for a control sample of λ-DNA (n = 1,512). The circular fraction is shown in blue (marked by a gray circle), full-size linear λ-DNA molecules are in black, concatemers are in red, and linear DNA fragments are in gray.
Fig. 2.
Fig. 2.
The tetrameric structure of CtIP is important for circularization of λ-DNA. (A) Schematic illustration of the CtIP derivatives used in this study, with color-coded regions highlighting different domains of interest. The numbers correspond to the position in the protein sequence. (B) Scatterplot of molecule extension vs. STD for λ-DNA (4 µM bp) incubated with wtCtIP (330 nM), equivalent to 500 tetramers per DNA end (n = 3,886). Clustering of the datasets was performed to distinguish the circularized λ-DNA molecules (blue) from the full-size linear λ-DNA molecules (black), concatemers (red), and linear fragments (gray). (C and D) Relative fractions of circular and linear complexes and concatemers at a DNA concentration of 4 µM bp for different concentrations of wtCtIP (C) and different derivatives of the protein at a constant protein concentration of 330 nM (D). (E and F) Size histograms for wtCtIP (n = 3,886; bin size = 0.5 µm) (E) and CtIPL27E (n = 1,541; bin size = 0.5 µm) (F) at 330 nM protein and 4 µM bp DNA (concentration equivalent to 500 tetramers or 1,000 dimers per DNA end, respectively). The high frequency of concatemers for CtIPL27E compared with wtCtIP is denoted by arrows in the histogram. (G) Relative fractions of circular and linear complexes and concatemers at different concentrations of λ-DNA in the presence of CtIPL27E at a constant DNA:protein ratio corresponding to 1,000 dimers per DNA end. Increasing the DNA concentration promotes concatemer formation.
Fig. 3.
Fig. 3.
Local compactions reveal accumulation of tetrameric CtIP on the DNA. (A) Boxplot of the distribution of extensions for the circular fraction of λ-DNA–wtCtIP complexes at different protein concentrations and a constant DNA concentration of 4 µM bp. (B) Boxplot of the distribution of extensions for the circular fraction of λ-DNA–CtIP complexes for different protein derivatives at a protein concentration of 330 nM and a DNA concentration of 4 µM, corresponding to 500 tetramers per λ-DNA end. The blue boxes show the interquartile range (Q2 = 25th percentile, Q3 = 75th percentile) with the median extension (red). Whiskers represent ranges for minimum and maximum, and outliers are represented by red crosses. Datapoints deviating by 1.5 times the interquartile range are considered outliers. (C) Representative kymographs of circular λ-DNA molecules at different wtCtIP concentrations. The vertical and horizontal axes correspond to time and molecule extension, respectively. The normalized fluorescence emission graph to the right shows the heterogenous emission along the molecule extension due to the local DNA compaction by wtCtIP. (DF) Representative kymographs showing (D) a circularized λ-DNA molecule with two dynamic local compactions along the molecule extension (330 nM wtCtIP n = 35 [Ntot = 3,886], 330 nM CtIPΔ1 n = 25 [Ntot = 2,835]), (E) a circularized concatemer of two λ-DNA molecules with two dynamic local compactions along the molecule extension (330 nM wtCtIP n = 41 [Ntot = 3,886], 330 nM CtIPΔ1 n = 56 [Ntot = 2,835]), and (F) two circularized λ-DNA molecules joined through a central static local compaction (330 nM wtCtIP n = 44 [Ntot = 3,886], 330 nM CtIPΔ1 n = 64 [Ntot = 2,835]). Schematic illustrations to the right visualize the suggested configuration of each complex. Additional kymographs are presented in SI Appendix, Figs. S8–S10. The vertical and horizontal scale bars correspond to 3 s and 3 µm, respectively.
Fig. 4.
Fig. 4.
CtIP dissociates from circular complexes upon DNA unfolding. (A) Kymographs displaying the unfolding of three circularized λ-DNA–CtIP complexes with local compactions upon photoinduced breaking of the DNA. Arrows indicate where the DSB occurs, which corresponds to the position from where the DNA starts to unfold. Upon unfolding, the local compaction disappears. (B) Schematic illustration showing the unfolding event, where the proteins causing a local compaction dissociate as the DNA is unfolding. (C) Kymographs of unfolding of five λ-DNA–CtIP complexes, in which two circles are joined through a central static local compaction. The arrows indicate the initiation of DNA unfolding upon photoinduced breaking. As the broken DNA end unfolds, the local compaction disappears once the end has reached the center and the linear molecule is separated from the other circular DNA (clearly discernible in kymographs 1 and 2). The extensive illumination generates additional breaks causing fragmentation of the linearized DNA (3), as well as breaking and unfolding of the remaining circular molecule (4 and 5). (D) Schematic illustration showing the unfolding of two circularized λ-DNA–CtIP complexes joined through a local compaction. Upon breaking, the proteins causing the local compaction will dissociate, and the DNA molecules will separate. The vertical and horizontal scale bars correspond to 5 s and 3 µm, respectively.
Fig. 5.
Fig. 5.
CtIP binds specifically to DNA ends and nonspecifically to the DNA backbone. (A) AFM images, showing circular (1 to 4) and linear (5 to 7) DNA-wtCtIP complexes, where features are reflected through the height difference. wtCtIP forms clusters (bright spots) along the contour of both circular and linear DNA molecules as well as at the ends of the linear molecules, suggesting two possible binding modes of CtIP to DNA. Noncropped images are presented in SI Appendix, Fig. S9. (B and C) Boxplots of the distribution of extensions for the nanoconfined linear fraction of λ-DNA–CtIP complexes at different protein concentrations of wtCtIP (B) and at a constant protein concentration of 330 nM for different protein variants (C). (D) Schematic illustration of the proposed DNA-binding mechanisms of CtIP, bridging and binding along the DNA backbone, respectively. (E) Boxplot of the extension of a nanoconfined 97-kbp circular plasmid at different concentrations of wtCtIP and a constant total DNA concentration of 4 µM bp. The blue box shows the interquartile range (Q2 = 25th percentile, Q3 = 75th percentile) with the median extension (red). Whiskers represent ranges for minimum and maximum, and outliers are represented by red crosses. Datapoints deviating by 1.5 times of the interquartile range are considered outliers. (F) Bar diagram showing the molecule extension relative to control DNA (no protein) for nanoconfined circularized and linear λ-DNA molecules (Circular and Linear, respectively) and for the 97-kbp circular plasmid (Plasmid) at a total DNA concentration of 4 µM bp in the presence of 330 nM wtCtIP. The gray bar represents the mean value for the whole population, whereas the blue bar takes into account only the 25th percentile. The plasmid DNA displays less compaction compared with circularized and linear λ-DNA. (G, Top) The local GC-content along nanoconfined λ-DNA where a moving average filter has been applied with a step size of 1,000 bp. (G, Bottom) Emission intensity variation along the molecule extension for bare λ-DNA (black; n = 50) and λ-DNA in the presence of 330 nM wtCtIP (blue; n = 96), with corresponding representative kymographs as inserts. Color-coded dashed lines mark the median emission values for the first and second halves of the molecule extension, representing the GC-rich (higher emission) and AT-rich (lower emission) regions, respectively. The vertical and horizontal scale bars correspond to 3 s and 3 µm, respectively.
Fig. 6.
Fig. 6.
Sae2 promotes concatemer formation of λ-DNA. (A) Scatterplot of molecule extension vs. STD for λ-DNA (4 µM bp) incubated with Sae2 (4 µM; n = 1,440). Clustering of the datasets was performed to distinguish the circularized λ-DNA molecules (blue) from the full-size linear λ-DNA molecules (black), concatemers (red), and linear fragments (gray). (B and C) Relative fractions of circular and linear complexes and concatemers for different concentrations of Sae2 (B) and Sae2L25P (C) at 4 µM bp λ-DNA.

References

    1. Lieber M. R., The mechanism of double-strand DNA break repair by the nonhomologous DNA end-joining pathway. Annu. Rev. Biochem. 79, 181–211 (2010). - PMC - PubMed
    1. Jackson S. P., Bartek J., The DNA-damage response in human biology and disease. Nature 461, 1071–1078 (2009). - PMC - PubMed
    1. Ranjha L., Howard S. M., Cejka P., Main steps in DNA double-strand break repair: An introduction to homologous recombination and related processes. Chromosoma 127, 187–214 (2018). - PubMed
    1. Miller H., Zhou Z., Shepherd J., Wollman A. J. M., Leake M. C., Single-molecule techniques in biophysics: A review of the progress in methods and applications. Rep. Prog. Phys. 81, 024601 (2018). - PubMed
    1. Nyberg L., Persson F., Åkerman B., Westerlund F., Heterogeneous staining: A tool for studies of how fluorescent dyes affect the physical properties of DNA. Nucleic Acids Res. 41, e184 (2013). - PMC - PubMed

Publication types

LinkOut - more resources