. 2020 Aug 25;117(34):20672-20680.
doi: 10.1073/pnas.1919039117. Epub 2020 Aug 12.

Estimating the genome-wide contribution of selection to temporal allele frequency change

Affiliations

Estimating the genome-wide contribution of selection to temporal allele frequency change

Vince Buffalo et al. Proc Natl Acad Sci U S A. .

Abstract

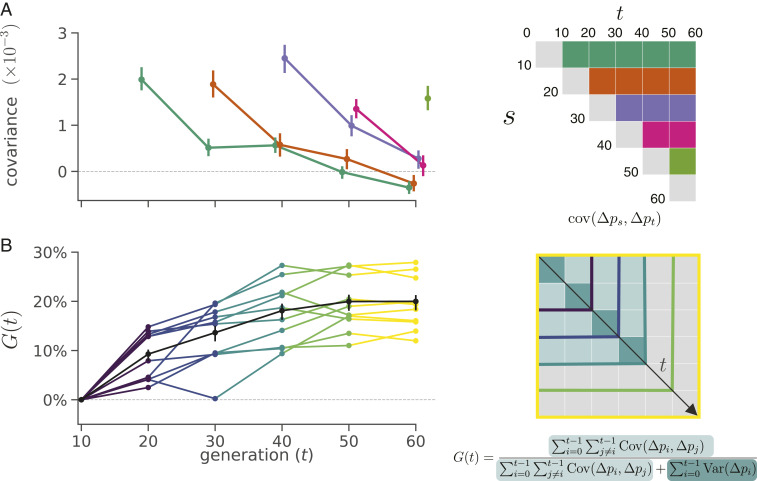
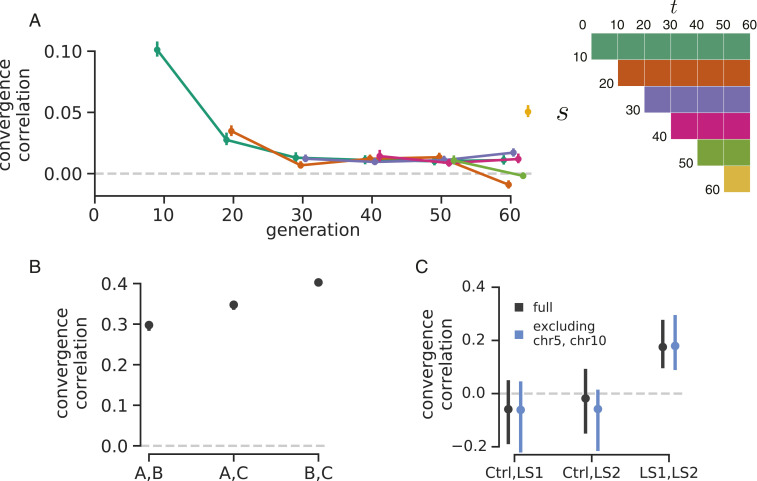
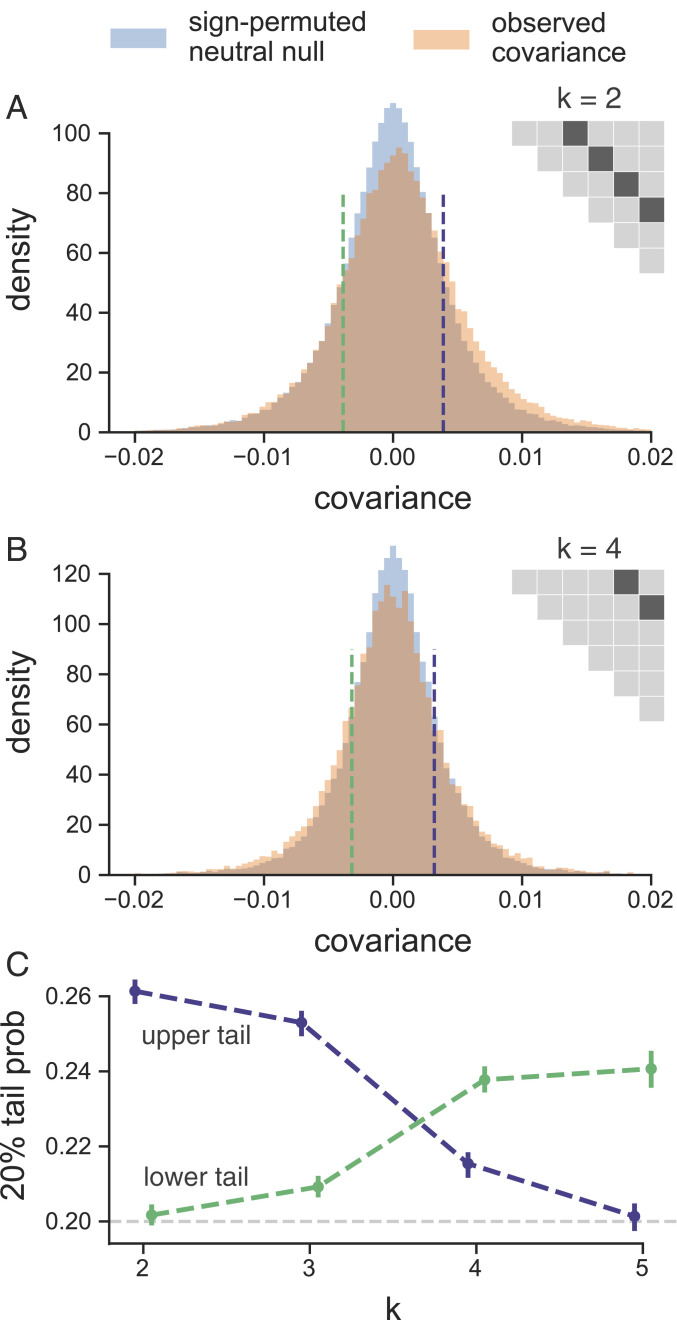
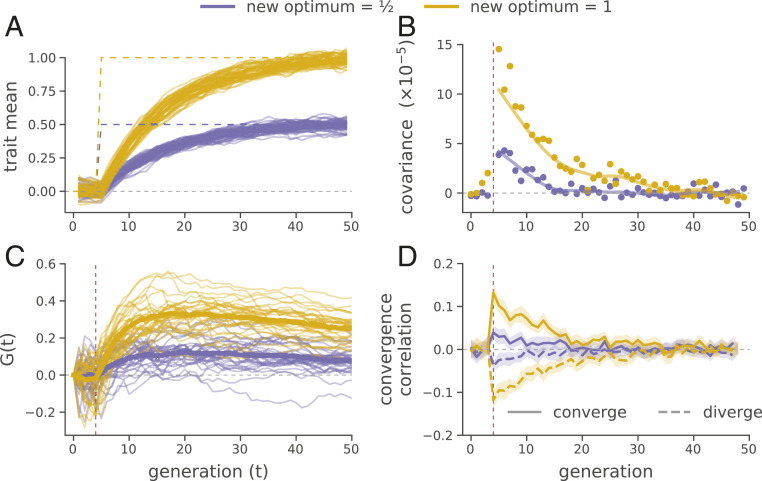
Rapid phenotypic adaptation is often observed in natural populations and selection experiments. However, detecting the genome-wide impact of this selection is difficult since adaptation often proceeds from standing variation and selection on polygenic traits, both of which may leave faint genomic signals indistinguishable from a noisy background of genetic drift. One promising signal comes from the genome-wide covariance between allele frequency changes observable from temporal genomic data (e.g., evolve-and-resequence studies). These temporal covariances reflect how heritable fitness variation in the population leads changes in allele frequencies at one time point to be predictive of the changes at later time points, as alleles are indirectly selected due to remaining associations with selected alleles. Since genetic drift does not lead to temporal covariance, we can use these covariances to estimate what fraction of the variation in allele frequency change through time is driven by linked selection. Here, we reanalyze three selection experiments to quantify the effects of linked selection over short timescales using covariance among time points and across replicates. We estimate that at least 17 to 37% of allele frequency change is driven by selection in these experiments. Against this background of positive genome-wide temporal covariances, we also identify signals of negative temporal covariance corresponding to reversals in the direction of selection for a reasonable proportion of loci over the time course of a selection experiment. Overall, we find that in the three studies we analyzed, linked selection has a large impact on short-term allele frequency dynamics that is readily distinguishable from genetic drift.

Keywords: adaptation; experimental evolution; linked selection.


Conflict of interest statement

The authors declare no competing interest.

Figures

Fig. 1.
Fig. 1.
(A) Temporal covariance, averaged across all 10 replicate populations, through time from the Barghi et al. (33) study. Each line depicts the temporal covariance Cov(Δps,Δpt) from some reference generation s to a later time t, which varies along the x axis; each line corresponds to a row of the triangle of the temporal covariance matrix with the same color (Right). The ranges around each point are 95% block bootstrap CIs. (B) A lower bound on the proportion of the total variance in allele frequency change explained by linked selection, G(t), as it varies through time t along the x axis. The black line is the G(t) averaged across replicates, with the 95% block bootstrap CI. The other lines are the G(t) for each individual replicate, with colors indicating what subset of the temporal covariance matrix in Right is being included in the calculation of G(t).
Fig. 2.
Fig. 2.
(A) The convergence correlations, averaged across Barghi et al. (33) replicate pairs, through time. Each line represents the convergence correlation cor(Δps,Δpt) from a starting reference generation s to a later time t, which varies along the x axis; each line corresponds to a row of the temporal convergence correlation matrix depicted on Right (where the diagonal elements represent the convergence correlations between the same time points across replicate populations). We note that convergent correlation for the last time point is an outlier; we are unsure as to the cause of this (e.g., it does not appear to be driven by a single pair of replicates). (B) The convergence correlations between individual pairs of replicates in the Kelly and Hughes (38) data (note that the CIs are plotted but are small on this y-axis scale). (C) The convergence correlations between individual pairs of replicates in the data from Castro et al. (39) for the two selection lines (LS1 and LS2) and the control (Ctrl); gray CIs are those using the complete dataset, and blue CIs exclude chromosome 5 (chr5) and chr10, which harbor the two regions Castro et al. (39) found to have signals of parallel selection between LS1 and LS2. Through simulations, we have found that the differences in convergence correlation CI widths between these Drosophila studies and the Longshanks study are due to the differing population sizes.
Fig. 3.
Fig. 3.
(A and B) The distribution of temporal covariances calculated in 100-kb genomic windows from the Barghi et al. (33) study plotted alongside an empirical neutral null distribution created by recalculating the windowed covariances on 1,000 sign permutations of allele frequency changes within tiles. The number of histogram bins is 88, chosen by cross-validation (SI Appendix, Fig. S25). In A, windowed covariances Cov(Δpt,Δpt+k) are separated by k=2×10 generations, and in A, the covariances are separated by k=4×10 generations; each k is an off diagonal from the variance diagonal of the temporal covariance matrix (cartoon of upper triangle of covariance matrix in A and B, where the first diagonal is the variance, and the dark gray indicates which off diagonal of the covariance matrix is plotted in the histograms). (C) The lower and upper tail probabilities of the observed windowed covariances, at 20 and 80% quintiles of the empirical neutral null distribution, for varying time between allele frequency changes (i.e., which off diagonal k). The CIs are 95% block bootstrap CIs, and the light gray dashed line indicates the 20% tail probability expected under the neutral null. Similar figures for different values of k are in SI Appendix, Fig. S27.
Fig. 4.
Fig. 4.
Forward-in-time simulations demonstrate how temporal covariance, G(t) trajectories, and convergence correlations arise during optima shifts of two different magnitudes, under GSS. (A) Trait means across 30 replicates before and after optima shifts (solid lines) for two different magnitudes (indicated by color). The new optimal trait values are indicated by the purple and yellow dashed lines. (B) Mean temporal covariance Cov(Δp5,Δpt) across 30 simulation replicates, where t varies along the x axis (points), with a loess-smoothed average (solid lines). (C) G(t) trajectories through time for 30 replicate simulations across two optima shifts. The solid lines are loess-smoothed averages. (D) The convergence correlations between two populations (each 1,000 diploids) split from a common population that underwent an optima shift in either the same direction (converge) or opposite directions (diverge) at generation 5. In B–D, directional selection begins at generation 5, when the optima shifts; this is indicated by the vertical dashed red lines (SI Appendix, section S8.2 has details on these simulations).

References

    1. Smith J. M., Haigh J., The hitch-hiking effect of a favourable gene. Genet. Res. 23, 23–35 (1974). - PubMed
    1. Charlesworth B., Morgan M. T., Charlesworth D., The effect of deleterious mutations on neutral molecular variation. Genetics 134, 1289–1303 (1993). - PMC - PubMed
    1. Nordborg M., Charlesworth B., Charlesworth D., The effect of recombination on background selection. Genet. Res. 67, 159–174 (1996). - PubMed
    1. Neher R. A., Kessinger T. A., Shraiman B. I., Coalescence and genetic diversity in sexual populations under selection. Proc. Natl. Acad. Sci. U.S.A., 110, 15836–15841 (2013). - PMC - PubMed
    1. Barton N. H., Genetic hitchhiking. Philos. Trans. R. Soc. Lond. B Biol. Sci. 355, 1553–1562 (2000). - PMC - PubMed

Publication types