. 2020 Sep 1;117(35):21546-21556.
doi: 10.1073/pnas.2003339117. Epub 2020 Aug 17.

Immune signatures of prodromal multiple sclerosis in monozygotic twins

Affiliations

Immune signatures of prodromal multiple sclerosis in monozygotic twins

Lisa Ann Gerdes et al. Proc Natl Acad Sci U S A. .

Abstract

The tremendous heterogeneity of the human population presents a major obstacle in understanding how autoimmune diseases like multiple sclerosis (MS) contribute to variations in human peripheral immune signatures. To minimize heterogeneity, we made use of a unique cohort of 43 monozygotic twin pairs clinically discordant for MS and searched for disease-related peripheral immune signatures in a systems biology approach covering a broad range of adaptive and innate immune populations on the protein level. Despite disease discordance, the immune signatures of MS-affected and unaffected cotwins were remarkably similar. Twinship alone contributed 56% of the immune variation, whereas MS explained 1 to 2% of the immune variance. Notably, distinct traits in CD4+ effector T cell subsets emerged when we focused on a subgroup of twins with signs of subclinical, prodromal MS in the clinically healthy cotwin. Some of these early-disease immune traits were confirmed in a second independent cohort of untreated early relapsing-remitting MS patients. Early involvement of effector T cell subsets thus points to a key role of T cells in MS disease initiation.

Keywords: autoimmunity; biomarker; immune phenotyping; monozygotic twins; multiple sclerosis.


Conflict of interest statement

The authors declare no competing interest.

Figures

Fig. 1.
Fig. 1.
In-depth characterization of monozygotic twins discordant for MS. (A) Twin study set-up of monozygotic twin pairs (n = 43) discordant for MS: Healthy (TWINHD, gray) and MS (TWINMS, red) twin. Sample processing; cryoconserved PBMC of study participants were processed via flow cytometry in 13 panels of 10 colors each. For unbiased nonlinear dimensionality reduction via bh-SNE, LMDs were transformed, normalized, and merged per panel and randomly subsampled in viSNE, an implementation in Matlab. For visual representation of single-cell data and identification of population clusters, a PhenoGraph algorithm was used; fold-change was calculated per cluster comparing compiled data from all TwinHD to TwinMS; a regulation greater than twofold (up-regulation in red, down-regulation in green) is visualized in a heatmap. (B) Hierarchical illustration of the defined populations (n = 141) analyzed within this study. Red dots illustrate the respective main populations within the adaptive and innate compartment, further subpopulations are indicated by blue dots.
Fig. 2.
Fig. 2.
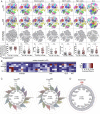
Frequencies of immune cell populations and functional properties in monozygotic twins discordant for MS. (A) PhenoGraph-maps compare single cell clusters of major immune cell populations of compiled TWINHD (row 1) to TWINMS (row 2) data indicated by black circles (basic panel n = 43 pairs; ILC panel n = 34 pairs). Heatmap (row 3) illustrates the fold-change per cluster between TWINMS and TWINHD; >twofold up-regulation (red) and >twofold down-regulation (green) would be indicated within the black circles. Corresponding conventional flow cytometry data comparing TWINHD to TWINMS are depicted in row 4. (B) Illustration of pairwise differences within individual twin pairs for all major immune populations based on conventional flow cytometry data; heatmap illustrates the difference in percentage. Immune therapy of MS twins (if applicable) is indicated below, IFN-β, natalizumab (NAT), and glatiramer acetate (GLAT), or no treatment (untreated). (C) Unbiased single-cell analysis of flow cytometry data via viSNE for each individual panel (panels = 13); PhenoGraph algorithm identified in total 352 clusters of compiled data from TWINHD and TWINMS groups (basic-, Th1-, Th17-, stimulation 2 panel n = 43; B cell panel n = 41 pairs; CD8+ panel n = 39 pairs; DC panel n = 30 pairs; ILC panel n = 34 pairs; monocyte panel 1+2 n = 25 pairs; Tdev panel n = 37 pairs; stimulation 1 panel n = 31 pairs; Treg panel n = 42 pairs); illustrations display the frequency per cluster within each panel. (D) Corresponding heatmap illustrates the fold-change between TWINMS and TWINHD groups for each individual cluster; twofold change line (dotted red line), no change line (dotted gray line) are indicated, Graph values represent mean ± SD. Statistical significance was evaluated by Wilcoxon matched-pairs signed rank test; n.s.: not significant.
Fig. 3.
Fig. 3.
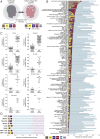
Effects of age, sex, CMV, MS status, and twinship on the variation of immune cell traits in monozygotic twins. (A) Illustration of our approach of quantification of the proportion of variance explained (R2) by fixed factors age, sex, CMV, and MS defined as the marginal R2 and additional incorporation of twinship as random effect (conditional R2) in a linear mixed model. (B) Bar graph illustrates the proportion of variance explained by the marginal effects age (brown), sex (yellow), CMV (red), and MS (blue) and random-effect “twinship” (light blue) for each immune cell trait in TWINMS and TWINHD cohorts (n = 43 pairs). (C) Dot plot graphs demonstrate the marginal versus conditional R2 for each individual immune trait within the respective major immune cell population. (D) Bar graphs illustrate the mean proportions of variance (R2) explained by the different factors age, sex, CMV, and twinship for all major immune cell populations; residual unexplained variance is displayed in violet.
Fig. 4.
Fig. 4.
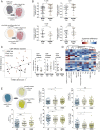
SCNI analysis identifies effector CD4 populations as differentially regulated populations in the initiation of MS. (A) Illustration of cohort division into SCNI-MS twin pairs (n = 10, beige) and HD-MS twin pairs (n = 14, gray) as described in Materials and Methods. (B) Calculation of the ICC for each immune trait in SCNI-MS twin pairs (n = 10, beige) and HD-MS twin pairs (n = 14, gray) based on linear mixed model adjusted for MS. To account for hierarchical dependencies between immune cell populations, analyses incorporate corrections using correlation matrixes per sub collective, as described in Materials and Methods. (C) Representative example of t-SNE dimensionality reduction of conventionally analyzed flow cytometry populations comparing the biological distance (gray line) between HD-cotwins (gray rectangle, n = 10) and SCNI cotwins (beige circle, n = 9) to their respective MS cotwin (red circle), for CD4+ effector subset (n = 13 parameters). (D) Hierarchically clustered heatmap represent the difference in percent for each individual immune cell trait between HD-MS twin compared to SCNI-MS twin within each pair for the CD4+ effector subset. (E) Independent validation cohort consisting of healthy controls (HD, n = 71; turquoise), CIS (n = 55, light olive) and treatment naïve MS patients (MS, n = 60; olive) of selected CD4+ effector parameters. Statistical significance was evaluated by linear mixed models, as described in Materials and Methods and Mann–Whitney U test or unpaired t test; *P ≤ 0.05; **P ≤ 0.01; ns: not significant.

Comment in

References

    1. Engelhardt B., Vajkoczy P., Weller R. O., The movers and shapers in immune privilege of the CNS. Nat. Immunol. 18, 123–131 (2017). - PubMed
    1. Sospedra M., Martin R., Immunology of multiple sclerosis. Semin. Neurol. 36, 115–127 (2016). - PubMed
    1. Thompson A. J., Baranzini S. E., Geurts J., Hemmer B., Ciccarelli O., Multiple sclerosis. Lancet 391, 1622–1636 (2018). - PubMed
    1. Ben-Nun A., Wekerle H., Cohen I. R., Pillars article: The rapid isolation of clonable antigen-specific T lymphocyte lines capable of mediating autoimmune encephalomyelitis. Eur J Immunol. 1981.11: 195-199. J. Immunol. 198, 3384–3388 (2017). - PubMed
    1. Zamvil S. S., Steinman L., The T lymphocyte in experimental allergic encephalomyelitis. Annu. Rev. Immunol. 8, 579–621 (1990). - PubMed

Publication types