. 2020 Sep 1;117(35):21108-21117.
doi: 10.1073/pnas.2005492117. Epub 2020 Aug 17.

The motley drivers of heat and cold exposure in 21st century US cities

Affiliations

The motley drivers of heat and cold exposure in 21st century US cities

Ashley Mark Broadbent et al. Proc Natl Acad Sci U S A. .

Abstract

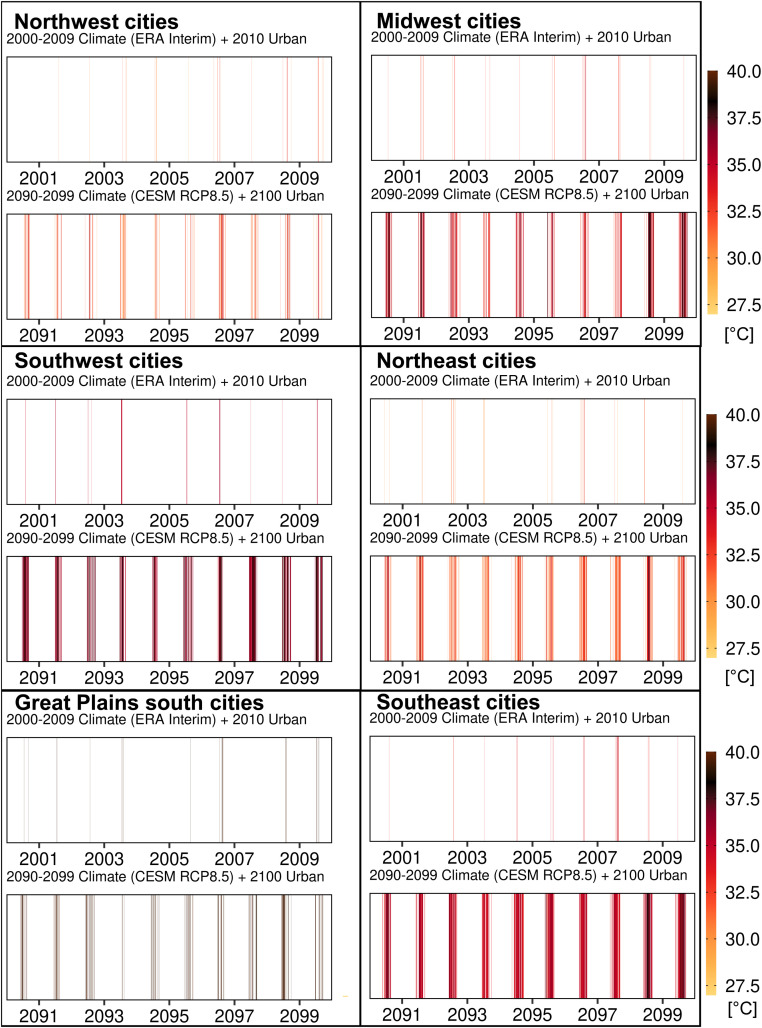
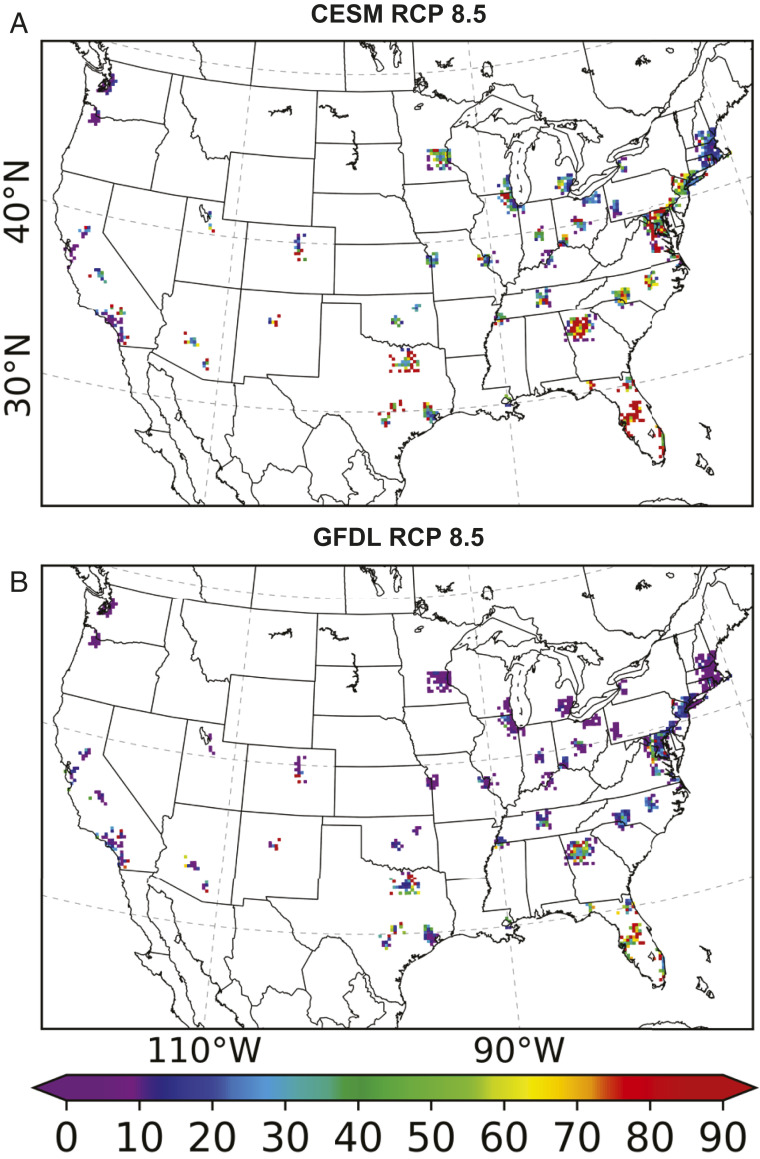
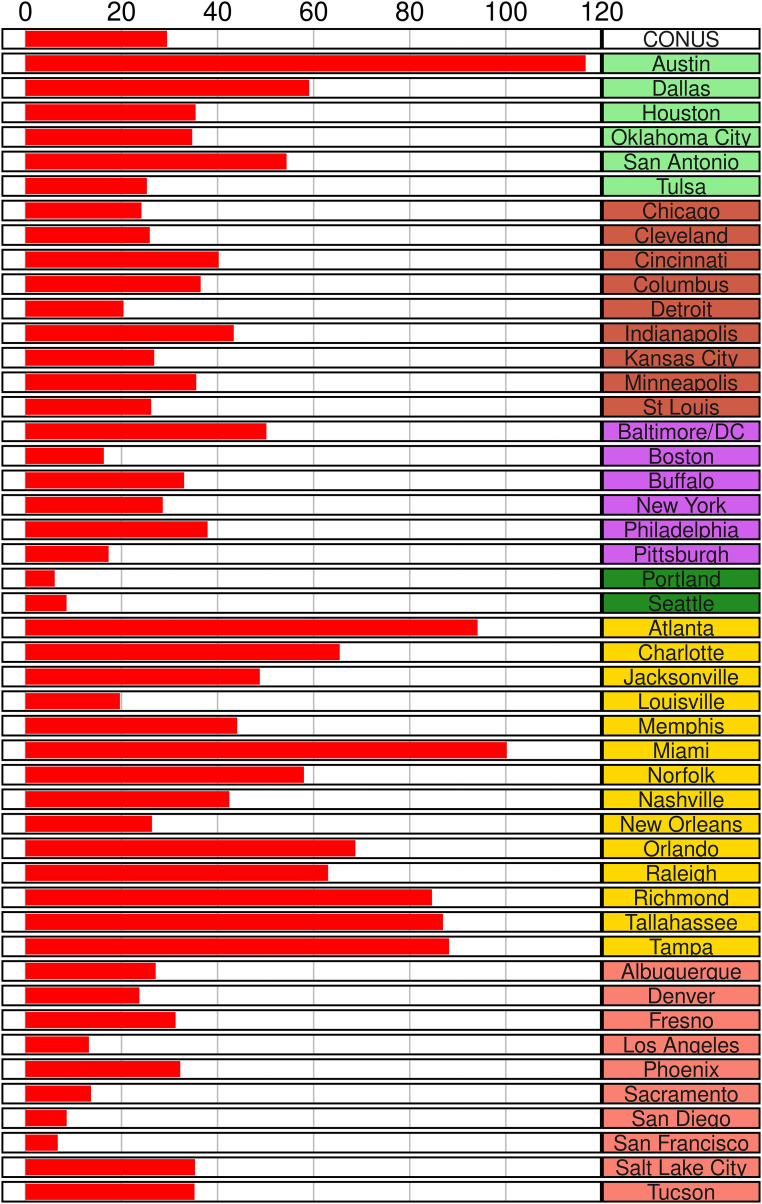
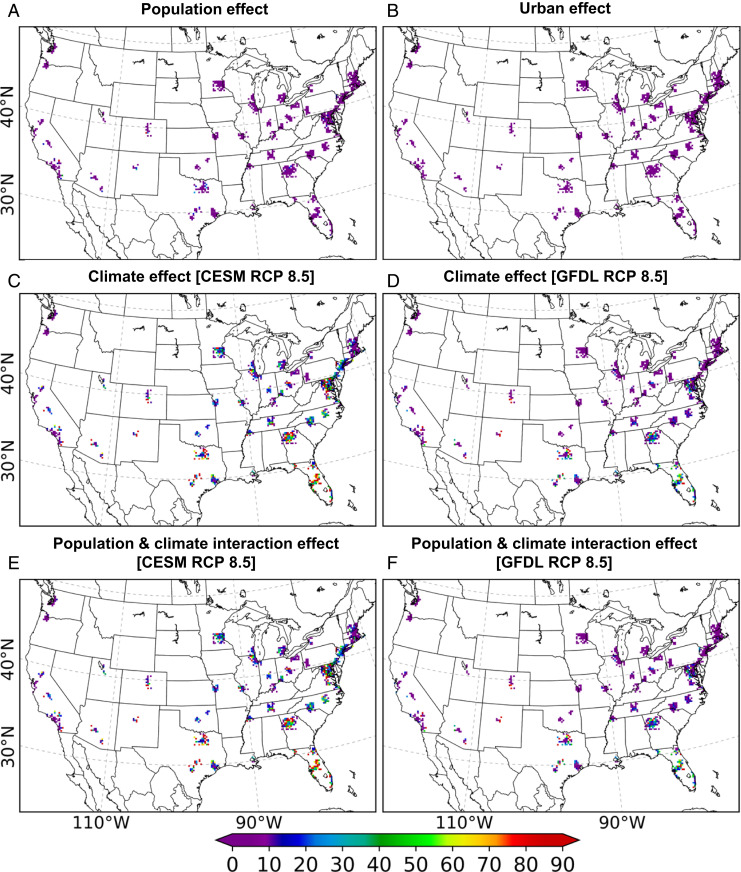
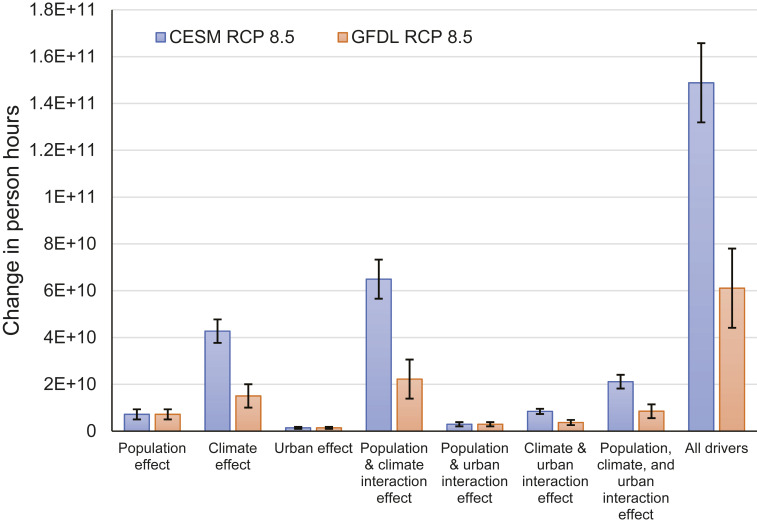
We use a suite of decadal-length regional climate simulations to quantify potential changes in population-weighted heat and cold exposure in 47 US metropolitan regions during the 21st century. Our results show that population-weighted exposure to locally defined extreme heat (i.e., "population heat exposure") would increase by a factor of 12.7-29.5 under a high-intensity greenhouse gas (GHG) emissions and urban development pathway. Additionally, end-of-century population cold exposure is projected to rise by a factor of 1.3-2.2, relative to start-of-century population cold exposure. We identify specific metropolitan regions in which population heat exposure would increase most markedly and characterize the relative significance of various drivers responsible for this increase. The largest absolute changes in population heat exposure during the 21st century are projected to occur in major US metropolitan regions like New York City (NY), Los Angeles (CA), Atlanta (GA), and Washington DC. The largest relative changes in population heat exposure (i.e., changes relative to start-of-century) are projected to occur in rapidly growing cities across the US Sunbelt, for example Orlando (FL), Austin (TX), Miami (FL), and Atlanta. The surge in population heat exposure across the Sunbelt is driven by concurrent GHG-induced warming and population growth which, in tandem, could strongly compound population heat exposure. Our simulations provide initial guidance to inform the prioritization of urban climate adaptation measures and policy.

Keywords: climate adaptation; climate change; cold exposure; heat exposure; urban climate.


Conflict of interest statement

The authors declare no competing interest.

Figures

Fig. 1.
Fig. 1.
Occurrence and intensity of hot days across US NCA regions derived from dynamical downscaling. Hot days are those that exceed the NCA region contemporary (2000–2009) 99th percentile of 3 PM LMST air temperature. The x axis represents a 10-y period. In each panel the top row represents 2000–2009 climate forcing with 2010 urban development and the bottom row represents 2090–2099 CESM RCP 8.5 climate forcing with 2100 urban development. Only urban areas from SI Appendix, Fig. S1 within each NCA region (SI Appendix, Fig. S2) are included. Occurrence of hot days for GFDL RCP 8.5 climate forcing is shown in SI Appendix, Fig. S3.
Fig. 2.
Fig. 2.
The relative increase in population heat exposure during the 21st century (i.e., 2090–2099 divided by 2000–2009 person hours) derived from dynamical downscaling that combines 90 y of projected GHG-induced climate change, urban development, and population growth, with both (A) CESM RCP 8.5 (Top) and (B) GFDL RCP 8.5 (Bottom) climate forcings shown. Person hours are calculated based on exposure to locally defined start-of-century 99th percentile of 1500 LMST air temperature. Only urban grid squares from the 47 cities included in our analysis (SI Appendix, Fig. S2) are shown.
Fig. 3.
Fig. 3.
The relative increase in population heat exposure during the 21st century (i.e., 2090–2099 divided by 2000–2009 person hours) resulting from a combination of 90 y of projected GHG-induced climate change, urban development, and population growth. Projections are derived from dynamical downscaling of the CESM RCP 8.5 forcing. Note that the city names used are principally intended as identifiers for the bounding boxes used (SI Appendix, Fig. S1), which extend (in many cases) beyond traditional municipal or city boundaries. The color coding (Right) corresponds to NCA climate regions (SI Appendix, Fig. S2). Results for the GFDL RCP 8.5 forcing are shown in SI Appendix, Fig. S6.
Fig. 4.
Fig. 4.
Relative increase in population heat exposure during the 21st century (i.e., 2090–2099 divided by 2000–2009 person hours) resulting from individual drivers: (A) population growth (“population effect”), (B) urban development (“urban effect”), (C) GHG warming with CESM RCP 8.5 forcing (“climate effect”), (D) GHG-warming with GFDL RCP 8.5 forcing (climate effect), (E) the interaction effect of simultaneous population growth and GHG-induced warming with CESM RCP 8.5 forcing (“population and climate interaction effect”) and (F) the interaction effect of simultaneous population growth and GHG-induced warming with GFDL RCP 8.5 forcing (population and climate interaction effect). Drivers of heat exposure are derived from dynamical downscaling. Additional drivers not shown here and provided in SI Appendix, Fig. S8.
Fig. 5.
Fig. 5.
CONUS annual average change in population heat exposure during the 21st century (2090–2099 compared with 2000–2009) resulting from individual drivers and their interactions. Projections are derived from dynamical downscaling of CESM and GFDL RCP 8.5 climate forcing in combination with ICLUS urban development and population projections. Uncertainty (±1 SD) due to annual variability is shown.

References

    1. Bierwagen B. G. et al. ., National housing and impervious surface scenarios for integrated climate impact assessments. Proc. Natl. Acad. Sci. U.S.A. 107, 20887–20892 (2010). - PMC - PubMed
    1. Wu J., Urban ecology and sustainability: The state-of-the-science and future directions. Landsc. Urban Plan. 125, 209–221 (2014).
    1. Seto K. C., Güneralp B., Hutyra L. R., Global forecasts of urban expansion to 2030 and direct impacts on biodiversity and carbon pools. Proc. Natl. Acad. Sci. U.S.A. 109, 16083–16088 (2012). - PMC - PubMed
    1. Middel A., Krayenhoff E. S., Micrometeorological determinants of pedestrian thermal exposure during record-breaking heat in Tempe, Arizona: Introducing the MaRTy observational platform. Sci. Total Environ. 687, 137–151 (2019). - PubMed
    1. Myers S. S., Planetary health: Protecting human health on a rapidly changing planet. Lancet 390, 2860–2868 (2018). - PubMed

Publication types

LinkOut - more resources