. 2020 Aug 20;15(8):e0237901.
doi: 10.1371/journal.pone.0237901. eCollection 2020.

Spatial and temporal regularization to estimate COVID-19 reproduction number R(t): Promoting piecewise smoothness via convex optimization

Affiliations

Spatial and temporal regularization to estimate COVID-19 reproduction number R(t): Promoting piecewise smoothness via convex optimization

Patrice Abry et al. PLoS One. .

Abstract

Among the different indicators that quantify the spread of an epidemic such as the on-going COVID-19, stands first the reproduction number which measures how many people can be contaminated by an infected person. In order to permit the monitoring of the evolution of this number, a new estimation procedure is proposed here, assuming a well-accepted model for current incidence data, based on past observations. The novelty of the proposed approach is twofold: 1) the estimation of the reproduction number is achieved by convex optimization within a proximal-based inverse problem formulation, with constraints aimed at promoting piecewise smoothness; 2) the approach is developed in a multivariate setting, allowing for the simultaneous handling of multiple time series attached to different geographical regions, together with a spatial (graph-based) regularization of their evolutions in time. The effectiveness of the approach is first supported by simulations, and two main applications to real COVID-19 data are then discussed. The first one refers to the comparative evolution of the reproduction number for a number of countries, while the second one focuses on French departments and their joint analysis, leading to dynamic maps revealing the temporal co-evolution of their reproduction numbers.


Conflict of interest statement

The authors have declared that no competing interests exist.

Figures

Fig 1
Fig 1. Serial interval function Φ modeled as a Gamma distribution with mean and standard deviation of 6.6 and 3.5 days, following [17].
Fig 2
Fig 2. Estimated reproduction numbers R(t) on synthetic data, produced by the Poisson model (1) (left) and by a SIR model (right).
The true R(t) (blue line) is piecewise linear: constant till day 45, decreasing till day 90 and increasing for the last 10 days. The proposed estimate (red) performs better than the naive estimate (black) (cf. Eq (2)) and detects well the changes, notably it quickly reacts to the increase of the last 10 days.
Fig 3
Fig 3. Daily new confirmed cases for France, from three different sources.
Top row: raw data (symbols) and sliding median preprocessed data (connected lines) from Source1(JHU) (blue) and Source2(ECDPC)(red) and Source3(SPF) (black). Bottom row: corresponding estimates of R(t).
Fig 4
Fig 4. Number of daily new confirmed cases for France, reproduction numbers and local trends, using data from Source2(ECDPC) (left) and Source3(SPF) (right) (reconstructed proxy from hospital counts).
Top: time series. Middle: fast (red) and slowly (blue) evolving estimates of R(t). Bottom: fast (red) and slowly (blue) evolving estimates of local trends β(t). The title of the plots reports the slow and fast estimates of R for the current day.
Fig 5
Fig 5. Number of daily new confirmed cases for Europe, reproduction numbers and local trends.
Top: time series. Middle: fast (red) and slowly evolving (blue) estimates of R(t). Bottom: fast (red) and slowly evolving (blue) estimates of local trends β(t). The title of the plots reports the slow and fast estimates of R for the current day. Data from Source2(ECDPC).
Fig 6
Fig 6. Number of daily new confirmed cases for American countries, reproduction numbers and local trends.
Top: time series. Middle: fast (red) and slowly evolving (blue) estimates of R(t). Bottom: fast (red) and slowly evolving (blue) estimates of local trends β(t). The title of the plots reports the slow and fast estimates of R for the current day. Data from Source2(ECDPC).
Fig 7
Fig 7. Number of daily new confirmed cases for Asian countries, reproduction numbers and local trends.
Top: time series. Middle: fast (red) and slowly evolving (blue) estimates of R(t). Bottom: fast (red) and slowly evolving (blue) estimates of local trends β(t). The title of the plots reports the slow and fast estimates of R for the current day. Data from Source2(ECDPC).
Fig 8
Fig 8. Number of daily new confirmed cases for African countries, reproduction numbers and local trends.
Top: time series. Middle: fast (red) and slowly evolving (blue) estimates of R(t). Bottom: fast (red) and slowly evolving (blue) estimates of local trends β(t). The title of the plots report estimates for the current day. Data from Source2(ECDPC).
Fig 9
Fig 9. Phase-space evolution reconstructed from averaged slowly varying estimates of R and β, per continent.
The name of the country is written at the last day of the trajectory, also marked by larger size empty symbol. Data from Source2(ECDPC).
Fig 10
Fig 10. Reproduction numbers and trends for continental France départements.
Fast varying estimates of reproduction numbers R (top) and trends β (bottom) for independent (left) and spatial graph-based regularized estimates (right). Hospital-based data from Source3(SPF). MapData©OpenStreetMap contributors.
Fig 11
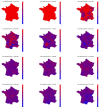
Fig 11. Graph-based spatially regularized estimates of the reproduction number R for the 94 continental France départments, as a function of days.
Movie animations for the whole period are made available at perso.ens-lyon.fr/patrice.abry/DeptRegul.mp4 or barthes.enssib.fr/coronavirus/IXXI-SiSyPhe/, and updated on a regular basis. Hospital-based data from Source3 (SPF). MapData©OpenStreetMap contributors.

References

    1. Coccia M. Factors determining the diffusion of COVID-19 and suggested strategy to prevent future accelerated viral infectivity similar to COVID. Science of the Total Environment. 2020; p. 138474 10.1016/j.scitotenv.2020.138474 - DOI - PMC - PubMed
    1. Petkova E, Antman EM, Troxel AB. Pooling Data From Individual Clinical Trials in the COVID-19 Era. JAMA. - PubMed
    1. Di Domenico L, Pullano G, Sabbatini CE, Boëlle PY, Colizza V. Expected impact of lockdown in Ile-de-France and possible exit strategies; 2020. medRxiv:2020.04.13.20063933. Available from: https://www.medrxiv.org/content/early/2020/04/17/2020.04.13.20063933. - PMC - PubMed
    1. Salje et al H. Estimating the burden of SARS-CoV-2 in France. Science. 2020. - PMC - PubMed
    1. Guzzetta et al G. The impact of a nation-wide lockdown on COVID-19 transmissibility in Italy; 2020. arXiv:2004.12338 [q-bio.PE].