[Preprint]. 2020 Aug 15:2020.08.14.20174490.
doi: 10.1101/2020.08.14.20174490.

Detection, prevalence, and duration of humoral responses to SARS-CoV-2 under conditions of limited population exposure

Affiliations

Detection, prevalence, and duration of humoral responses to SARS-CoV-2 under conditions of limited population exposure

Tyler J Ripperger et al. medRxiv. .

Update in

  • Orthogonal SARS-CoV-2 Serological Assays Enable Surveillance of Low-Prevalence Communities and Reveal Durable Humoral Immunity.
    Ripperger TJ, Uhrlaub JL, Watanabe M, Wong R, Castaneda Y, Pizzato HA, Thompson MR, Bradshaw C, Weinkauf CC, Bime C, Erickson HL, Knox K, Bixby B, Parthasarathy S, Chaudhary S, Natt B, Cristan E, El Aini T, Rischard F, Campion J, Chopra M, Insel M, Sam A, Knepler JL, Capaldi AP, Spier CM, Dake MD, Edwards T, Kaplan ME, Scott SJ, Hypes C, Mosier J, Harris DT, LaFleur BJ, Sprissler R, Nikolich-Žugich J, Bhattacharya D. Ripperger TJ, et al. Immunity. 2020 Nov 17;53(5):925-933.e4. doi: 10.1016/j.immuni.2020.10.004. Epub 2020 Oct 14. Immunity. 2020. PMID: 33129373 Free PMC article.

Abstract

We conducted an extensive serological study to quantify population-level exposure and define correlates of immunity against SARS-CoV-2. We found that relative to mild COVID-19 cases, individuals with severe disease exhibited elevated authentic virus-neutralizing titers and antibody levels against nucleocapsid (N) and the receptor binding domain (RBD) and the S2 region of spike protein. Unlike disease severity, age and sex played lesser roles in serological responses. All cases, including asymptomatic individuals, seroconverted by 2 weeks post-PCR confirmation. RBD- and S2-specific and neutralizing antibody titers remained elevated and stable for at least 2-3 months post-onset, whereas those against N were more variable with rapid declines in many samples. Testing of 5882 self-recruited members of the local community demonstrated that 1.24% of individuals showed antibody reactivity to RBD. However, 18% (13/73) of these putative seropositive samples failed to neutralize authentic SARS-CoV-2 virus. Each of the neutralizing, but only 1 of the non-neutralizing samples, also displayed potent reactivity to S2. Thus, inclusion of multiple independent assays markedly improved the accuracy of antibody tests in low seroprevalence communities and revealed differences in antibody kinetics depending on the viral antigen. In contrast to other reports, we conclude that immunity is durable for at least several months after SARS-CoV-2 infection.


Conflict of interest statement

DECLARATION OF INTERESTS:

Unrelated intellectual property of D.B. and Washington University has been licensed by Sana Biotechnology. J.N.Z. is on the scientific advisory board of and receives research funding from Young Blood Inc. R.S. is a founder and chief scientific officer of Geneticure. R.W. is currently an employee of Vir Biotechnology.

Figures

Figure 1:
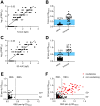
Figure 1:. Assessment of RBD-based sensitivity and specificity in serological testing.
(A) Serum samples from healthy controls and confirmed COVID-19 cases were assessed for RBD reactivity by ELISA and neutralization of live SARS-CoV-2. PRNT90 values were determined as the last dilution by which 90% neutralization occurred. Antibody titers were quantified for RBD by quantifying area under the curve (AUC) across a serial dilution curve. r values were calculated by Pearson’s Correlation Test. (B) Pre-2020 negative control samples (352) and 30 samples from SARS-CoV-2 exposed individuals were screened by ELISA at a single 1:40 dilution against RBD. The blue region indicates overlap of OD values between negative and positive control samples. % indicates frequency of negative control values in this range. Experiments were repeated 3 times. (C) RBD seroreactivity was quantified based upon time elapsed from PCR+ confirmation of SARS-CoV-2 infection. (D) Individuals recruited from the community (5882) were screened for seroreactivity to RBD. (E) PRNT90 analysis from community drawn samples that displayed indeterminate or positive RBD seroreactivity. Samples that neutralized 90% of virions at least at a 1:20 dilution were considered positive. Experiments were repeated at least once.
Figure 2:
Figure 2:. Assessment of S2 and N antibodies as secondary confirmations of seropositivity.
(A) Correlations of neutralization and N-specific IgG ELISA titers across 115 serum samples from healthy controls and COVID-19 cases. (B) A sample set of 32 pre-pandemic controls and 30 PCR+ SARS-CoV-2 samples were assayed for seroreactivity to N protein. Blue shaded region indicates overlap between negative and positive controls. Frequency of negative controls in this range is shown. (C) Correlations of neutralization and S2-specific IgG ELISA titers across 114 serum samples from healthy controls and COVID-19 cases. (D) Pre-pandemic negative control samples (272) were screened for seroreactivity against S2 and compared to 30 PCR-confirmed SARS-CoV-2-exposed sera. (E) Comparison of RBD and S2 seroreactivity across 272 pre-pandemic serum samples. (F) ELISA results from indeterminate and putative seropositive samples from community testing. Thresholds for seropositivity were defined as in (E). Red circles indicate samples that have PRNT90 titers of at least 1:20. Experiments were repeated at least once.
Figure 3:
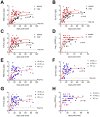
Figure 3:. Antibody responses to SARS-Cov2 as a function of disease severity and age.
(A-C) Antibody titers to RBD (A), S2 (B), and N (C), over time post-onset of SARS-CoV-2 infection symptom grouped by case severity. The negative control average was determined by calculating the average AUC value of negative control (n=25) samples. P values represent comparison of fit in nonlinear regression model between displayed groups. (D) PRNT90 values over time post-onset of SARS-CoV-2 infection symptoms. P values were calculated as in (A). (E-H) Antibody titers over time post-onset of SARS-CoV-2 infection symptoms from PCR+ confirmed patients or seropositive individuals from community wide cohort for RBD (E), N (F), and S2 (G), grouped by patient age. (H) PRNT90 values over time post-onset of SARS-CoV-2 infection symptoms grouped by patient age.
Figure 4:
Figure 4:. Antibody Responses to Spike Glycoprotein are more stable than responses to Nucleocapsid:
(A-C) Antibody titers for mild infections over time to RBD (A), S2 (B), and N (C) for PCR-confirmed subjects and seropositive samples from community serological testing. Solid lines connect data from individuals sampled serially over time. Blue line depicts smoothing splines curve fit with 4 knots. Dashed line depicts mean values from seronegative controls. (D) Subjects sampled serially were assessed for changes in antibody titers to RBD, S2, and N from the first draw to the last draw collected. Only subjects in which the last draw occurred >6 weeks from onset are shown. P values were calculated by paired 1-way ANOVA. (E) Neutralizing titers were measured for longitudinal subjects over time post-onset. Solid lines connect data from individuals sampled serially over time. Curve (blue line) was generated in using smoothing splines with 4 knots.

References

    1. Abbott R.K., Lee J.H., Menis S., Skog P., Rossi M., Ota T., Kulp D.W., Bhullar D., Kalyuzhniy O., Havenar-Daughton C., et al. (2018). Precursor Frequency and Affinity Determine B Cell Competitive Fitness in Germinal Centers, Tested with Germline-Targeting HIV Vaccine Immunogens. Immunity 48, 133–146.e6. - PMC - PubMed
    1. Amanat F., Stadlbauer D., Strohmeier S., Nguyen T.H.O., Chromikova V., McMahon M., Jiang K., Arunkumar G.A., Jurczyszak D., Polanco J., et al. (2020). A serological assay to detect SARS-CoV-2 seroconversion in humans. Nature Medicine 1–4. - PMC - PubMed
    1. Amanna I.J. (2007). Duration of Humoral Immunity to Common Viral and Vaccine Antigens. The New England Journal of Medicine 357, 1903–1915. - PubMed
    1. Atyeo C., Fischinger S., Zohar T., Slein M.D., Burke J., Loos C., McCulloch D.J., Newman K.L., Wolf C., Yu J., et al. (2020). Distinct Early Serological Signatures Track with SARS-CoV-2 Survival. Immunity 0. - PMC - PubMed
    1. Bendavid E., Mulaney B., Sood N., Shah S., Ling E., Bromley-Dulfano R., Lai C., Weissberg Z., Saavedra-Walker R., Tedrow J., et al. (2020). COVID-19 Antibody Seroprevalence in Santa Clara County, California. MedRxiv 2020.04.14.20062463. - PMC - PubMed

Publication types