

Temperature and humidity based projections of a rapid rise in global heat stress exposure during the 21st century
- PMID: 32818039
- PMCID: PMC7430505
- DOI: 10.1088/1748-9326/aaa00e
Temperature and humidity based projections of a rapid rise in global heat stress exposure during the 21st century
Abstract
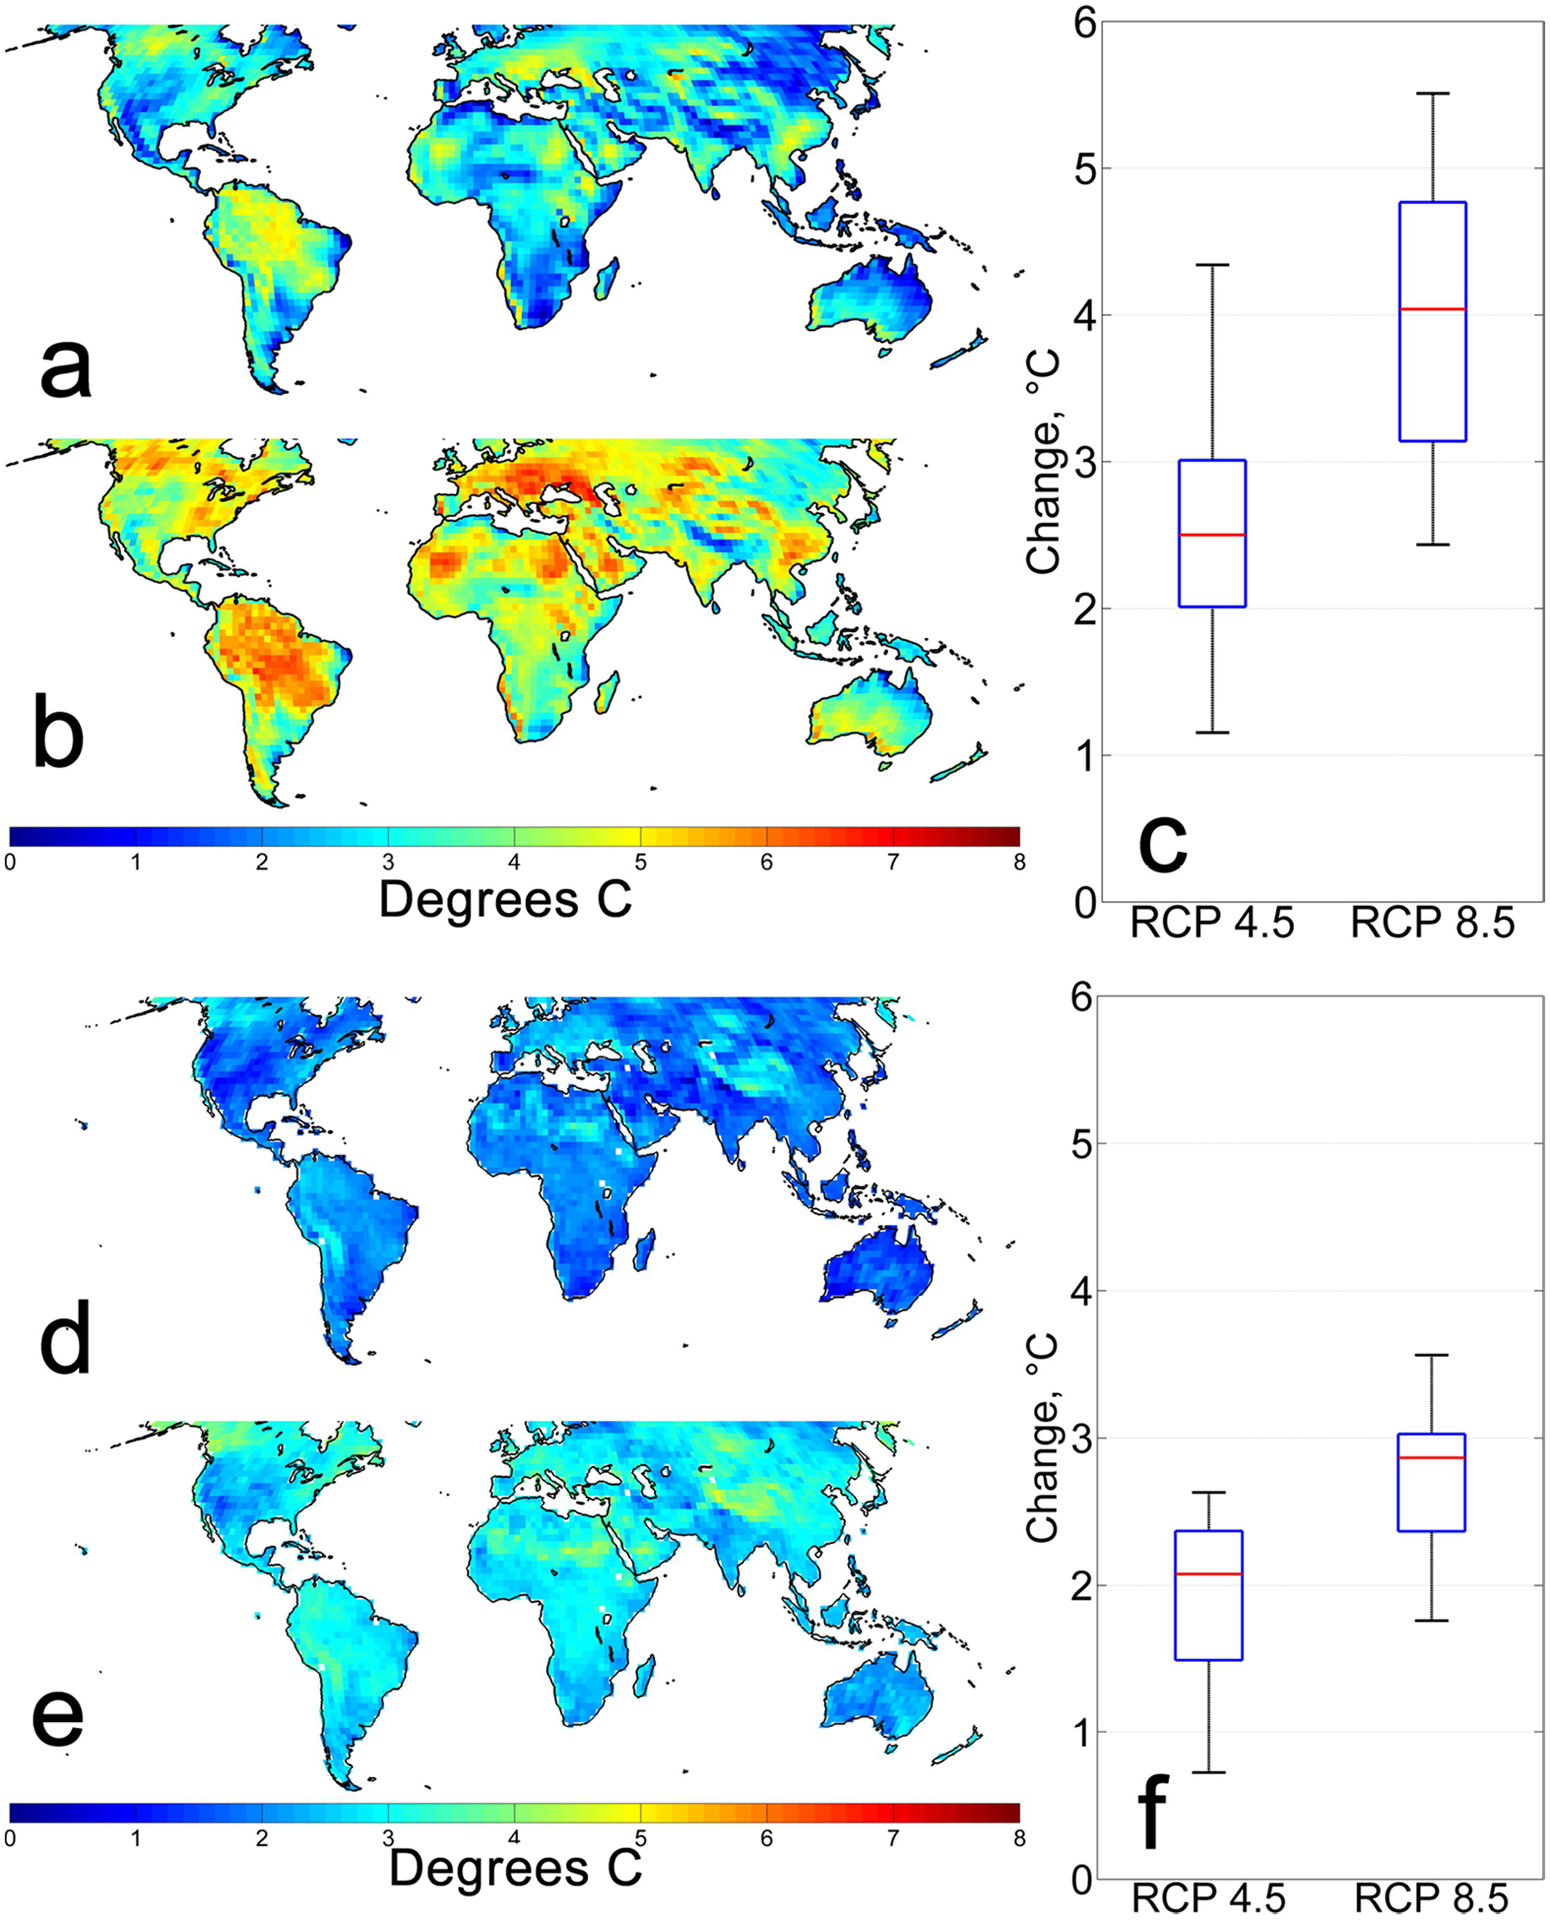
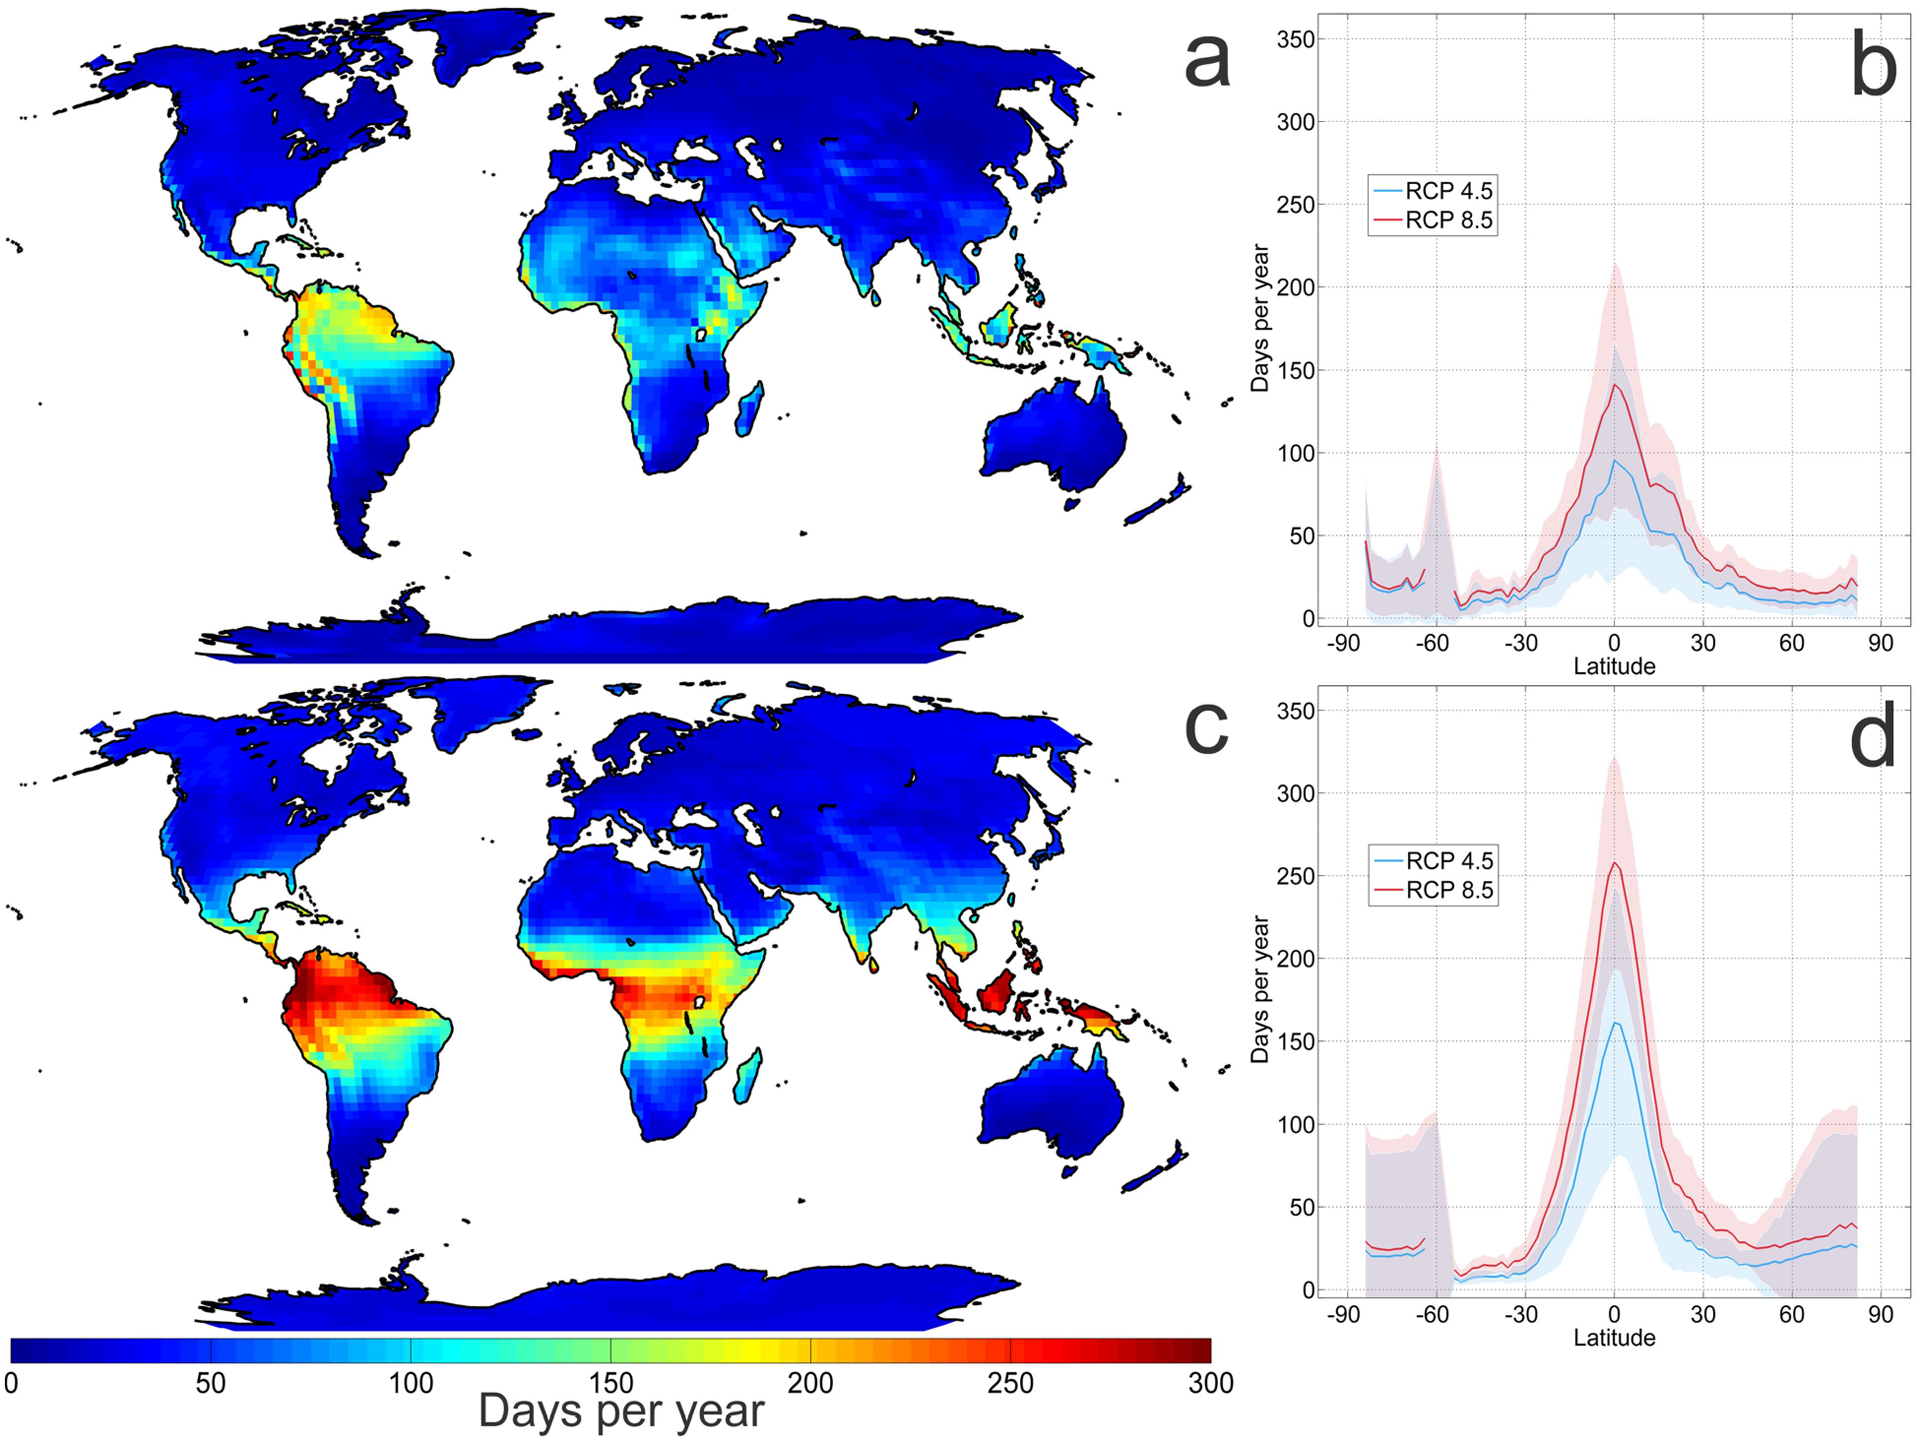
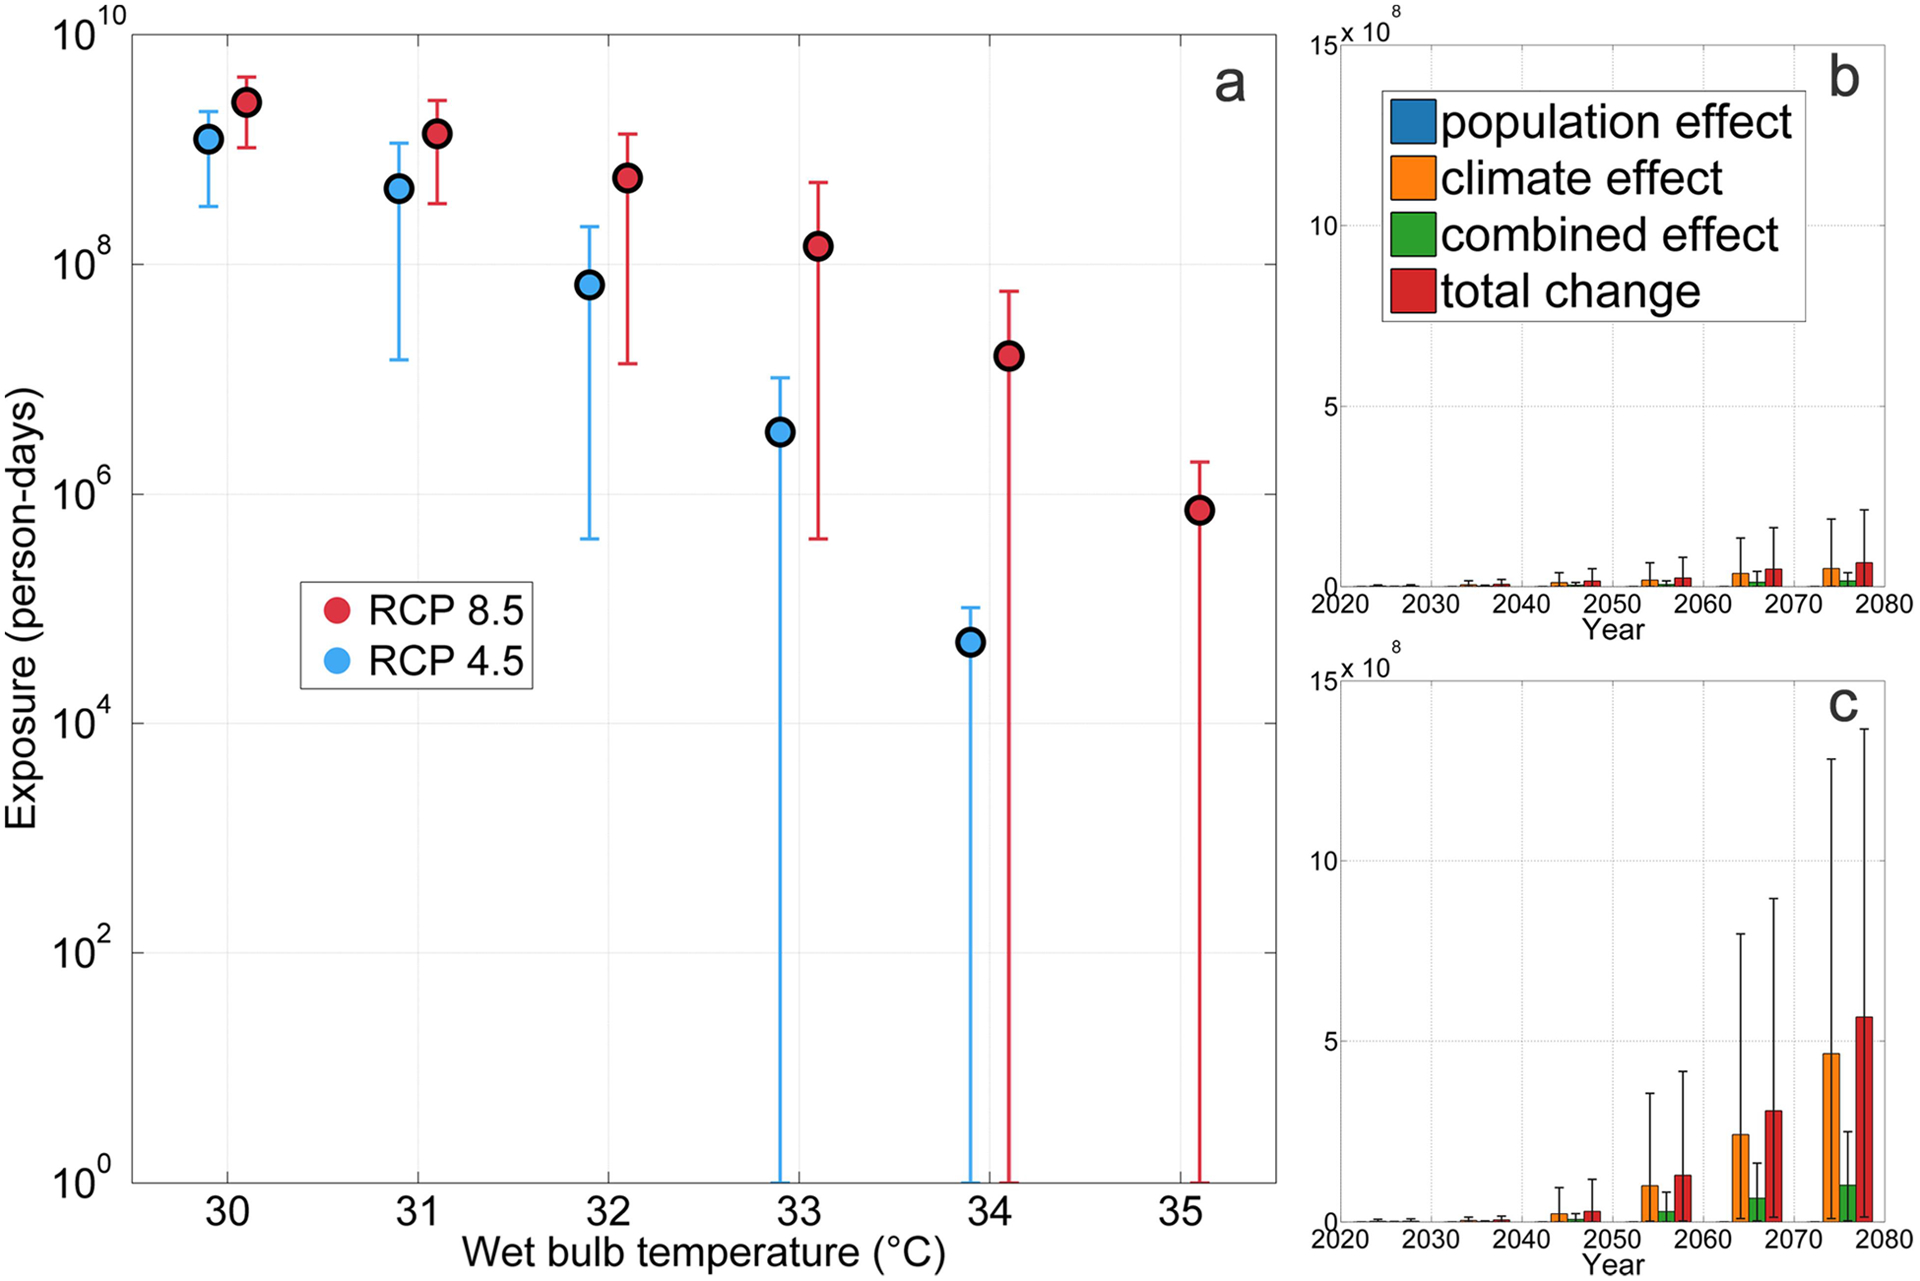
As a result of global increases in both temperature and specific humidity, heat stress is projected to intensify throughout the 21st century. Some of the regions most susceptible to dangerous heat and humidity combinations are also among the most densely populated. Consequently, there is the potential for widespread exposure to wet bulb temperatures that approach and in some cases exceed postulated theoretical limits of human tolerance by mid- to late-century. We project that by 2080 the relative frequency of present-day extreme wet bulb temperature events could rise by a factor of 100 - 250 (approximately double the frequency change projected for temperature alone) in the tropics and parts of the mid-latitudes, areas which are projected to contain approximately half the world's population. In addition, population exposure to wet bulb temperatures that exceed recent deadly heat waves may increase by a factor of five to ten, with 150 - 750 million person-days of exposure to wet bulb temperatures above those seen in today's most severe heat waves by 2070 - 2080. Under RCP 8.5, exposure to wet bulb temperatures above 35°C - the theoretical limit for human tolerance - could exceed a million person-days per year by 2080. Limiting emissions to follow RCP 4.5 entirely eliminates exposure to that extreme threshold. Some of the most affected regions, especially Northeast India and coastal West Africa, currently have scarce cooling infrastructure, relatively low adaptive capacity, and rapidly growing populations. In the coming decades heat stress may prove to be one of the most widely experienced and directly dangerous aspects of climate change, posing a severe threat to human health, energy infrastructure, and outdoor activities ranging from agricultural production to military training.
Figures
References
-
- Haines A, Kovats RS, Campbell-Lendrum D & Corvalan C Climate change and human health: Impacts, vulnerability and public health. Public Health 120, 585–596 (2006). - PubMed
-
- Dole R et al. Was there a basis for anticipating the 2010 Russian heat wave? Geophys. Res. Lett 38, (2011).
-
- Welton G The Impact of Russia’ s 2010 Grain Export Ban. Oxfam Res. Reports 32 (2011).
-
- Ghumman U & Horney J Characterizing the Impact of Extreme Heat on Mortality, Karachi, Pakistan, June 2015. Prehosp. Disaster Med 31, 263–6 (2016). - PubMed
-
- Zommers Z et al. Loss and Damage: The Role of Ecosystem Services. (United National Environment Programme, 2016).
Grants and funding
LinkOut - more resources
Full Text Sources
Research Materials