. 2020 Aug 11:6:76.
doi: 10.1038/s41420-020-00307-w. eCollection 2020.

Digestive symptoms of COVID-19 and expression of ACE2 in digestive tract organs

Affiliations

Digestive symptoms of COVID-19 and expression of ACE2 in digestive tract organs

Jiabin Xu et al. Cell Death Discov. .

Abstract

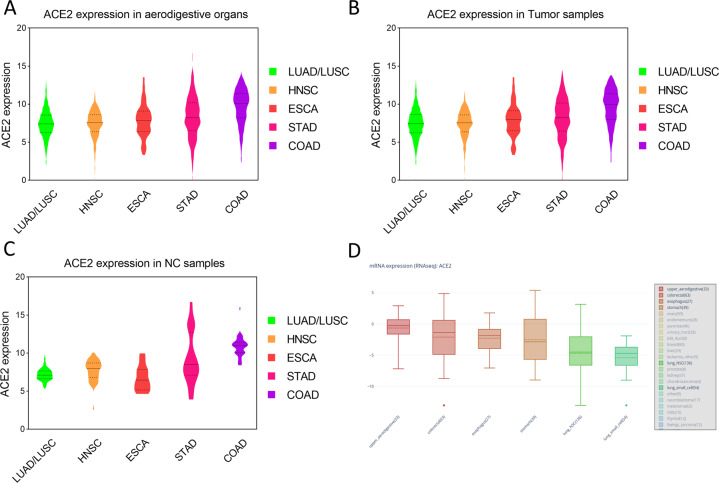
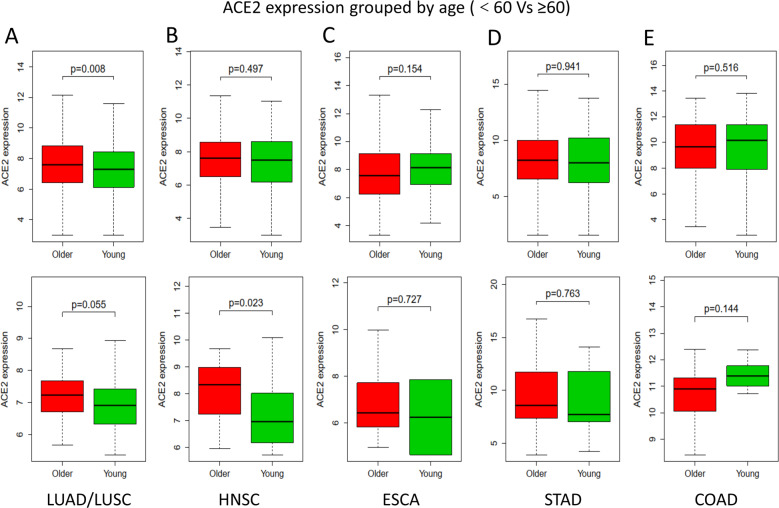
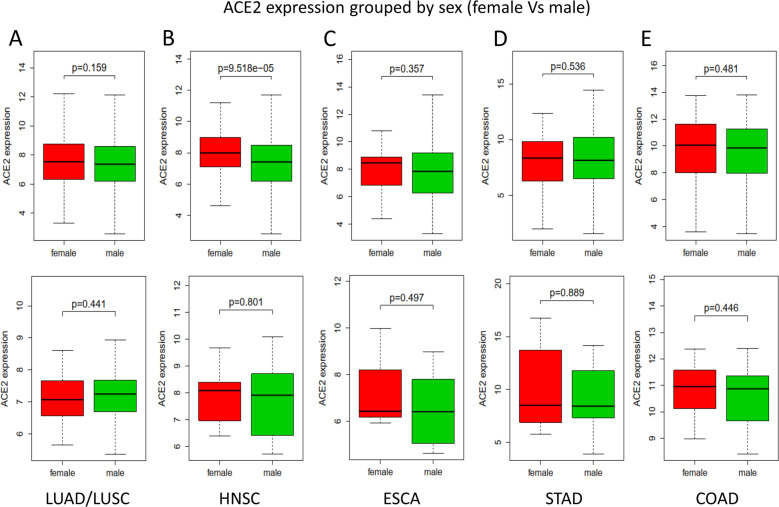
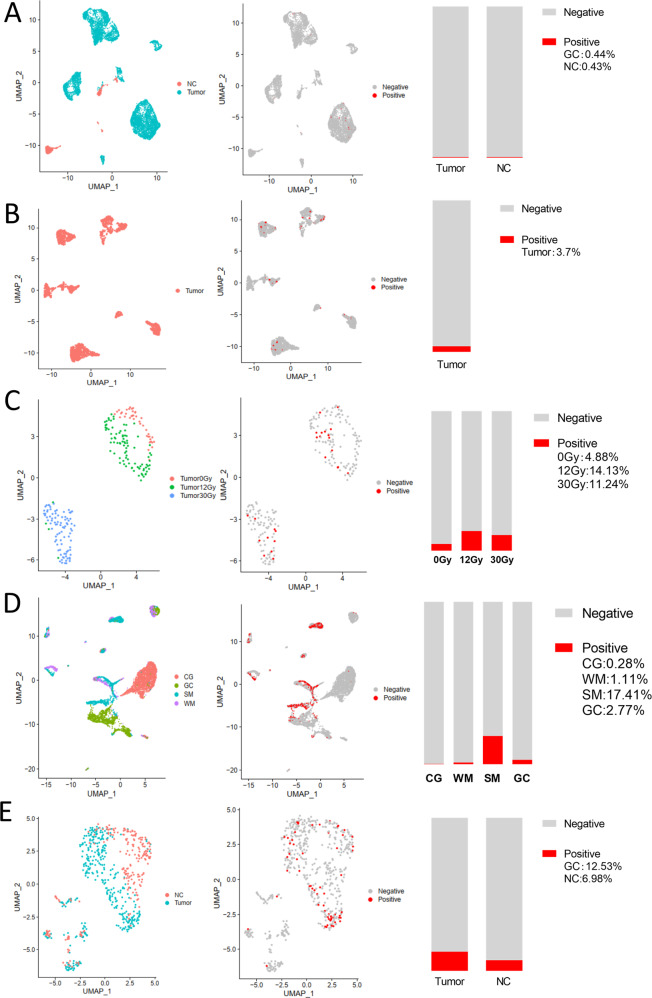
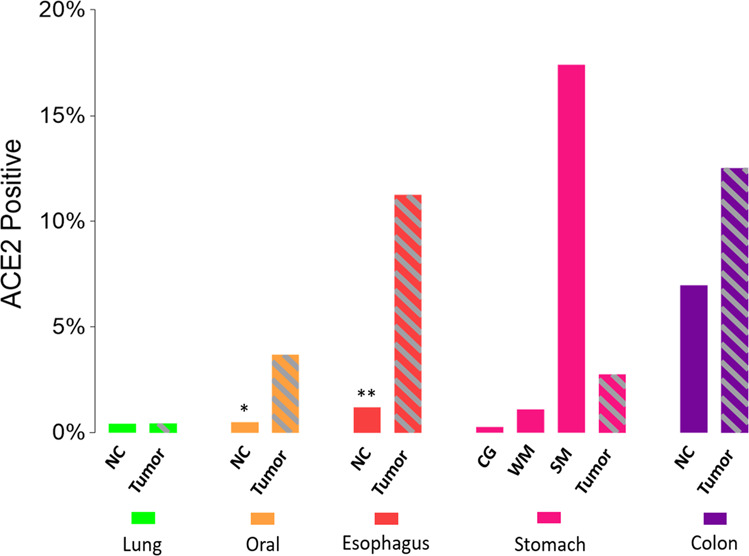
SARS-CoV-2 has resulted in numerous cases of Coronavirus Disease 2019 (COVID-19) worldwide. In addition to fever and respiratory symptoms, digestive symptoms also are observed in some patients with COVID-19. Angiotensin-converting enzyme 2 (ACE2) was reported to be the receptor for SARS-CoV-2. The aim of this study was to comprehensively investigate the digestive symptoms that occur in COVID-19 patients, and the potential pathogenic route of the SARS-CoV-2 infection in digestive tract organs (from the oral cavity to the gastrointestinal tract). We investigated the digestive symptoms of 48 patients with COVID-19 and explored ACE2 expression in digestive tract and lung cancers, based on a series of bulk and single-cell RNA sequencing data obtained from public databases. We found that 25% (12/48) of the patients with COVID-19 suffered from digestive symptoms, among which pharyngalgia (7/48) was the most common manifestation, followed by diarrhea (3/48), anorexia (3/48), and nausea (1/48). The bulk tissue RNA sequencing analysis indicated that digestive tract organs had higher ACE2 expression levels compared to the lung, and the expression of ACE2 in the lung increased with age. Single-cell RNA-Seq results showed that the ACE2-positive-cell ratio in digestive tract organs was significantly higher compared to the lung. ACE2 expression was higher in tumor cells compared to normal control (NC) tissues. While in gastric tissues, ACE2 expression gradually increased from chronic gastritis to metaplasia, to early cancer. Our data might provide a theoretical basis for screening the SARS-CoV-2 susceptible population and for the clinical classification of treatment of patients with COVID-19.

Keywords: Infectious diseases; Transcription.


Conflict of interest statement

Conflict of interestThe authors declare that they have no conflict of interest.

Figures

Fig. 1
Fig. 1. The expression of ACE2 in different tissues.
ac ACE2 expression of different tissues, downloaded from TCGA database. a ACE2 expression in all samples; b ACE2 expression in tumor samples; c ACE2 expression in NC samples. Black solid line, median value; black dotted line, interquartile range. d ACE2 expression in cancer cell lines, downloaded from CCLE database. Solid line, mean value; dotted line, median value. ACE2 Angiotensin-converting enzyme 2, TCGA The Cancer Genome Atlas, NC healthy normal control, LUAD lung adenocarcinoma, LUSC lung squamous cell carcinoma, HNSC head and neck squamous cell carcinoma, ESCA esophageal carcinoma, STAD stomach adenocarcinoma, COAD colon adenocarcinoma, CCLE Cancer Cell Line Encyclopedia.
Fig. 2
Fig. 2. The expression of ACE2 in different organs grouped by age.
ae The expression of ACE2 in different tissues downloaded from TCGA database, grouped by age. Top row, the expression of ACE2 in tumor samples; Bottom row, the expression of ACE2 in NC samples. Bold black line, median value; dotted black line, range of values. Statistical tests: Mann–Whitney U-test. ACE2 angiotensin-converting enzyme 2, TCGA The Cancer Genome Atlas, NC healthy normal control, LUAD lung adenocarcinoma, LUSC lung squamous cell carcinoma, HNSC head and neck squamous cell carcinoma, ESCA esophageal carcinoma, STAD stomach adenocarcinoma, COAD colon adenocarcinoma.
Fig. 3
Fig. 3. The expression of ACE2 in different organs grouped by sex.
ae The expression of ACE2 in different tissues downloaded from TCGA database, grouped by sex. Top row, the expression of ACE2 in tumor samples; Bottom row, the expression of ACE2 in NC samples. Bold black line, median value; dotted black line, range of values. Statistical tests: Mann–Whitney U-test. ACE2 angiotensin-converting enzyme 2, TCGA The Cancer Genome Atlas, NC healthy normal control, LUAD lung adenocarcinoma, LUSC lung squamous cell carcinoma, HNSC head and neck squamous cell carcinoma, ESCA esophageal carcinoma, STAD stomach adenocarcinoma, COAD colon adenocarcinoma.
Fig. 4
Fig. 4. Single-cell sequensing analysis of aerodigestive cancer cells.
a Single-cell analysis of lung cancer cells (tumor) in EXP0068 and NC cells in SRA878024. b Single-cell analysis of oral cancer cells in GSE103322. c Single-cell analysis of ESCC cell line KYSE-180 (tumor) treated with different doses of radiotherapy in GSE81812. d Single-cell analysis of CG, WM, SM, and GC cells in GSE134520. e Single-cell analysis of colon cancer cells (tumor) and NC cells in GSE81861. Left column, UMAP plots showing the distribution of cells, color-coded for pathology; middle column, UMAP plots showing the distribution of ACE2-positive cell (red); right column, Stacked barplot showing the proportion of ACE2-positive cells (red). EXP0068 was downloaded from the Cancer Single-cell State Atlas; SRA878024 was downloaded from the PanglaoDB; GSE103322, GSE81812, GSE134520, and GSE81861 were obtained from the Gene Expression Omnibus. NC healthy normal control, ESCC esophageal squamous cell carcinoma, CG chronic gastritis, WM wild intestinal metaplasia, SM severe intestinal metaplasia, GC gastric cancer, UMAP Uniform Manifold Approximation and Projection, ACE2 angiotensin-converting enzyme 2.
Fig. 5
Fig. 5. ACE2 expression increases along with the path of digestive tract.
ACE2-positive cell proportion in aerodigestive cancers. *ACE2-positive cell proportion in oral mucosa reported by Xu et al.; **ACE2-positive cell proportion in esophageal epithelium reported by Zou et al.. ACE2 angiotensin-converting enzyme 2, NC healthy normal control, CG chronic gastritis, WM wild intestinal metaplasia, SM severe intestinal metaplasia, GC gastric cancer.

References

    1. Coronaviridae Study Group of the International Committee on Taxonomy of Viruses. The species Severe acute respiratory syndrome-related coronavirus: classifying 2019-nCoV and naming it SARS-CoV-2. Nat. Microbiol. 2020;5:536–544. doi: 10.1038/s41564-020-0695-z. - DOI - PMC - PubMed
    1. WHO. Coronavirus Disease 2019 (Covid-19) Situation Report-101. https://www.who.int/emergencies/diseases/novel-coronavirus-2019/situatio... (WHO, 2020).
    1. Xu X, et al. Evolution of the novel coronavirus from the ongoing Wuhan outbreak and modeling of its spike protein for risk of human transmission. Sci. China Life Sci. 2020;63:457–460. doi: 10.1007/s11427-020-1637-5. - DOI - PMC - PubMed
    1. He L, et al. Expression of elevated levels of pro-inflammatory cytokines in SARS-CoV-infected ACE2+ cells in SARS patients: relation to the acute lung injury and pathogenesis of SARS. J. Pathol. 2006;210:288–297. doi: 10.1002/path.2067. - DOI - PMC - PubMed
    1. Li W, et al. The S proteins of human coronavirus NL63 and severe acute respiratory syndrome coronavirus bind overlapping regions of ACE2. Virology. 2007;367:367–374. doi: 10.1016/j.virol.2007.04.035. - DOI - PMC - PubMed