

Fast and Automated Hyperreflective Foci Segmentation Based on Image Enhancement and Improved 3D U-Net in SD-OCT Volumes with Diabetic Retinopathy
- PMID: 32818082
- PMCID: PMC7396192
- DOI: 10.1167/tvst.9.2.21
Fast and Automated Hyperreflective Foci Segmentation Based on Image Enhancement and Improved 3D U-Net in SD-OCT Volumes with Diabetic Retinopathy
Abstract
Purpose: To design a robust and automated hyperreflective foci (HRF) segmentation framework for spectral-domain optical coherence tomography (SD-OCT) volumes, especially volumes with low HRF-background contrast.
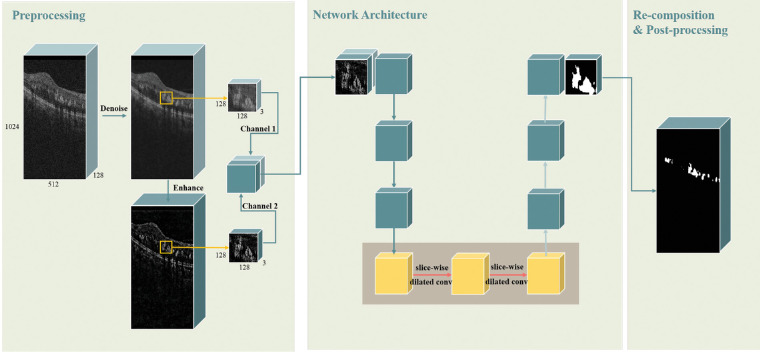
Methods: HRF in retinal SD-OCT volumes appear with low-contrast characteristics that results in the difficulty of HRF segmentation. Therefore to effectively segment the HRF we proposed a fully automated method for HRF segmentation in SD-OCT volumes with diabetic retinopathy (DR). First, we generated the enhanced SD-OCT images from the denoised SD-OCT images with an enhancement method. Then the enhanced images were cascaded with the denoised images as the two-channel input to the network against the low-contrast HRF. Finally, we replaced the standard convolution with slice-wise dilated convolution in the last layer of the encoder path of 3D U-Net to obtain long-range information.
Results: We evaluated our method using two-fold cross-validation on 33 SD-OCT volumes from 27 patients. The average dice similarity coefficient was 70.73%, which was higher than that of the existing methods with significant difference (P < 0.01).
Conclusions: Experimental results demonstrated that the proposed method is faster and achieves more reliable segmentation results than the current HRF segmentation algorithms. We expect that this method will contribute to clinical diagnosis and disease surveillance.
Translational relevance: Our framework for the automated HRF segmentation of SD-OCT volumes may improve the clinical diagnosis of DR.
Keywords: 3D U-Net; SD-OCT; hyperreflective foci segmentation; image enhancement; slice-wise dilated convolution.
Copyright 2020 The Authors.
Conflict of interest statement
Disclosure: S. Xie, None; I.P. Okuwobi, None; M. Li, None; Y. Zhang, None; S. Yuan, None; Q. Chen, None
Figures


Similar articles
-
Enhancing diabetic retinopathy diagnosis: automatic segmentation of hyperreflective foci in OCT via deep learning.Int Ophthalmol. 2025 Feb 18;45(1):79. doi: 10.1007/s10792-025-03439-z. Int Ophthalmol. 2025. PMID: 39966317 Free PMC article.
-
Automated segmentation of hyperreflective foci in OCT images for diabetic retinopathy using deep convolutional networks.Appl Opt. 2025 Apr 20;64(12):3180-3192. doi: 10.1364/AO.547758. Appl Opt. 2025. PMID: 40792842
-
Hyper-reflective foci segmentation in SD-OCT retinal images with diabetic retinopathy using deep convolutional neural networks.Med Phys. 2019 Oct;46(10):4502-4519. doi: 10.1002/mp.13728. Epub 2019 Aug 22. Med Phys. 2019. PMID: 31315159
-
Retinal Hyperreflective Foci Are Biomarkers of Ocular Disease: A Scoping Review With Evidence From Humans and Insights From Animal Models.J Ophthalmol. 2025 May 29;2025:9573587. doi: 10.1155/joph/9573587. eCollection 2025. J Ophthalmol. 2025. PMID: 40474962 Free PMC article. Review.
-
Automatic Anisotropic Diffusion Filtering and Graph-search Segmentation of Macular Spectral-domain Optical Coherence Tomographic (SD-OCT) Images.Curr Med Imaging Rev. 2019;15(3):308-318. doi: 10.2174/1573405613666171201155119. Curr Med Imaging Rev. 2019. PMID: 31989882 Review.
Cited by
-
Retinal optical coherence tomography image analysis by a restricted Boltzmann machine.Biomed Opt Express. 2022 Aug 4;13(9):4539-4558. doi: 10.1364/BOE.458753. eCollection 2022 Sep 1. Biomed Opt Express. 2022. PMID: 36187262 Free PMC article.
-
Fuzzy Logic-Based System for Identifying the Severity of Diabetic Macular Edema from OCT B-Scan Images Using DRIL, HRF, and Cystoids.Diagnostics (Basel). 2023 Jul 31;13(15):2550. doi: 10.3390/diagnostics13152550. Diagnostics (Basel). 2023. PMID: 37568913 Free PMC article.
-
Automated evaluation of retinal hyperreflective foci changes in diabetic macular edema patients before and after intravitreal injection.Front Med (Lausanne). 2023 Oct 6;10:1280714. doi: 10.3389/fmed.2023.1280714. eCollection 2023. Front Med (Lausanne). 2023. PMID: 37869163 Free PMC article.
-
Enhancing diabetic retinopathy diagnosis: automatic segmentation of hyperreflective foci in OCT via deep learning.Int Ophthalmol. 2025 Feb 18;45(1):79. doi: 10.1007/s10792-025-03439-z. Int Ophthalmol. 2025. PMID: 39966317 Free PMC article.
-
Diabetic Macular Edema Optical Coherence Tomography Biomarkers Detected with EfficientNetV2B1 and ConvNeXt.Diagnostics (Basel). 2023 Dec 28;14(1):76. doi: 10.3390/diagnostics14010076. Diagnostics (Basel). 2023. PMID: 38201384 Free PMC article.
References
-
- Bolz M, Schmidt-Erfurth U, Deak G, Mylonas G, Kriechbaum K, Scholda C. Optical coherence tomographic hyperreflective foci: a morphologic sign of lipid extravasation in diabetic macular edema. Ophthalmology. 2009; 116: 914–920. - PubMed
-
- De BU, Sacconi R, Pierro L, Lattanzio R, Bandello F. Optical coherence tomographic hyperreflective foci in early stages of diabetic retinopathy. Retina. 2014; 35: 449–453. - PubMed
-
- Cusick M, Chew EY, Chan CC,Kruth HS, Murphy RP, Ferris FL. Histopathology and regression of retinal hard exudates in diabetic retinopathy after reduction of elevated serum lipid levels. Ophthalmology. 2003; 110: 2126–2133. - PubMed
-
- Framme C, Schweizer P, Imesch M, Wolf S, Wolf-Schnurrbusch U. Behavior of SD-OCT-detected hyperreflective foci in the retina of anti-VEGF-treated patients with diabetic macular edema. Invest Ophthalmol Vis Sci. 2012; 53: 5814–5818. - PubMed
-
- Uji A, Tomoaki T, Kazuaki N, et al. .. Association between hyperreflective foci in the outer retina, status of photoreceptor layer, and visual acuity in diabetic macular edema. Am J Ophthalmol. 2012; 153: 710–717. - PubMed
Publication types
MeSH terms
LinkOut - more resources
Full Text Sources
Medical
