

Performance of Classification Systems for Age-Related Macular Degeneration in the Rotterdam Study
- PMID: 32818087
- PMCID: PMC7396180
- DOI: 10.1167/tvst.9.2.26
Performance of Classification Systems for Age-Related Macular Degeneration in the Rotterdam Study
Abstract
Purpose: To compare frequently used classification systems for age-related macular degeneration (AMD) in their abilty to predict late AMD.
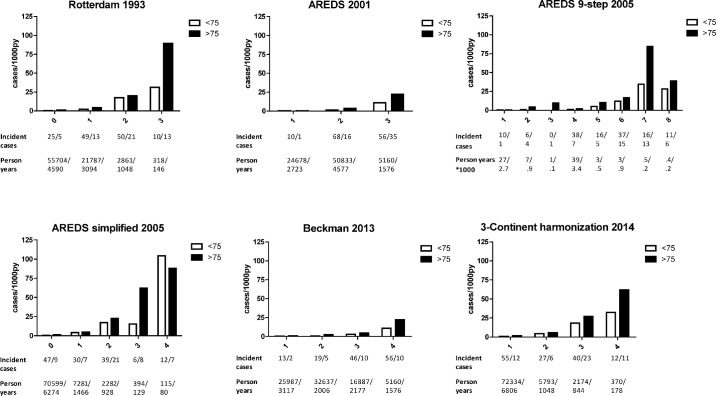
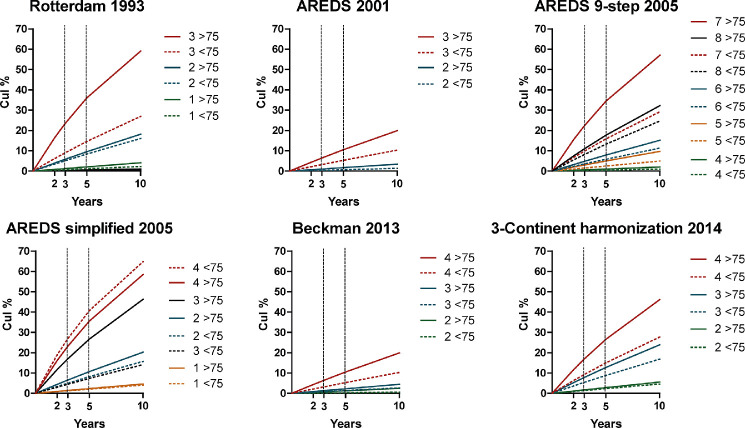
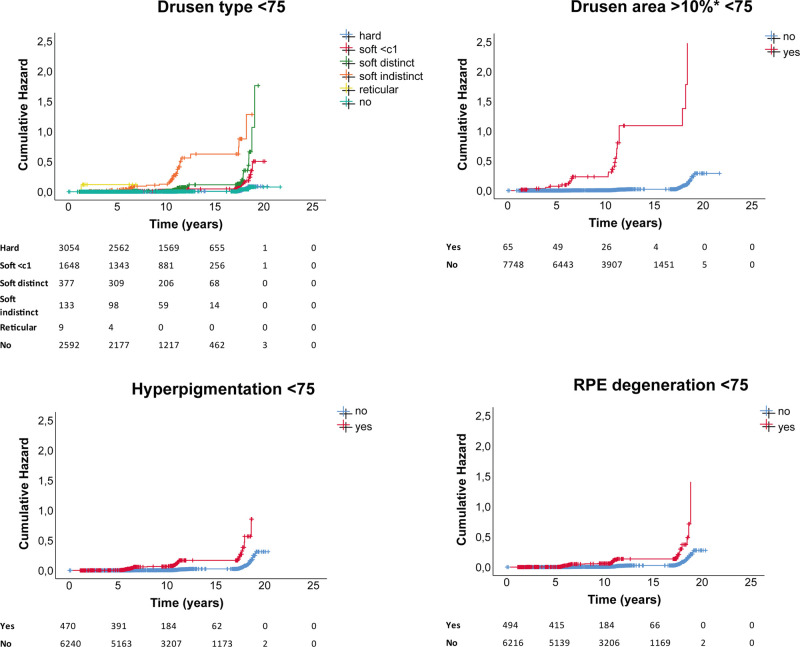
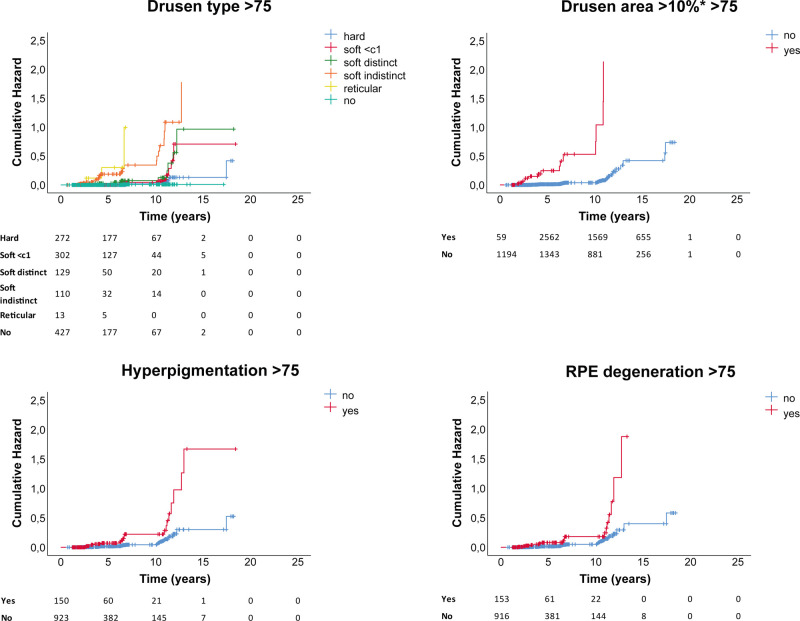
Methods: In total, 9066 participants from the population-based Rotterdam Study were followed up for progression of AMD during a study period up to 30 years. AMD lesions were graded on color fundus photographs after confirmation on other image modalities and grouped at baseline according to six classification systems. Late AMD was defined as geographic atrophy or choroidal neovascularization. Incidence rate (IR) and cumulative incidence (CuI) of late AMD were calculated, and Kaplan-Meier plots and area under the operating characteristics curves (AUCs) were constructed.
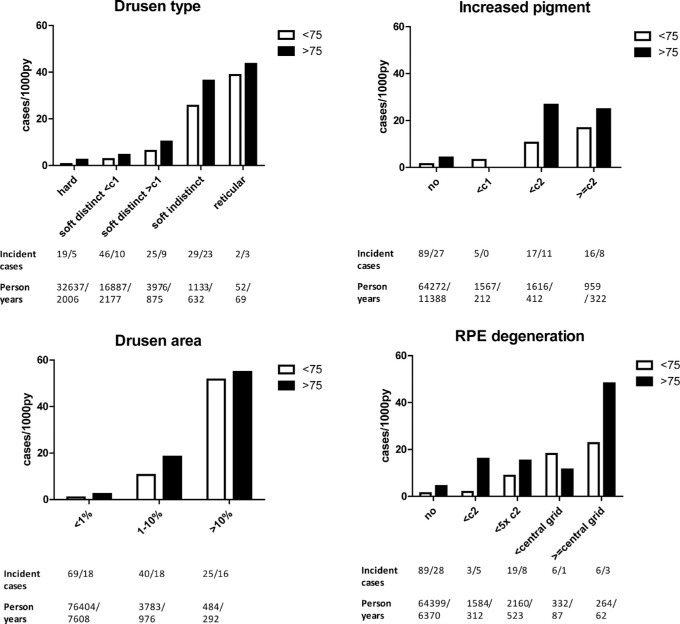
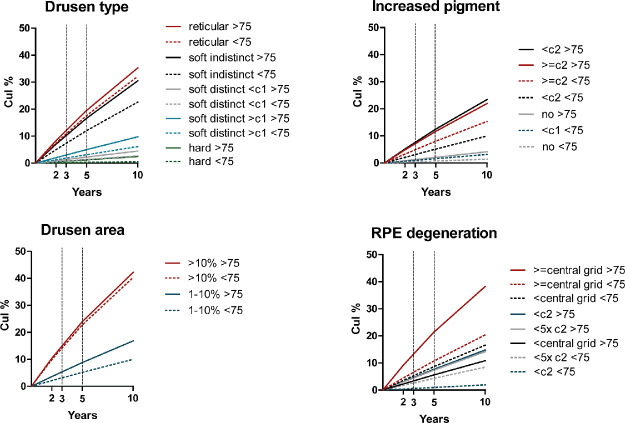
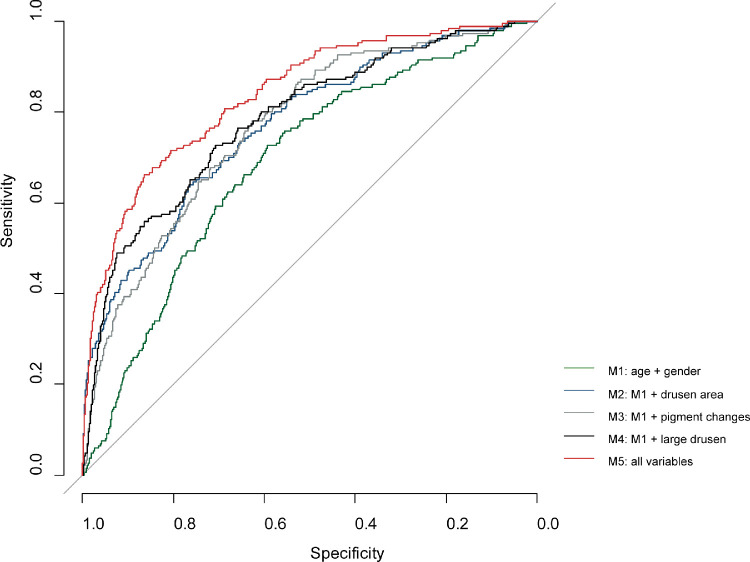
Results: A total of 186 persons developed incident late AMD during a mean follow-up time of 8.7 years. The AREDS simplified scale showed the highest IR for late AMD at 104 cases/1000 py for ages <75 years. The Rotterdam classification showed the highest IR at 89 cases/1000 py >75 years. The 3-Continent harmonization classification provided the most stable progression. Drusen area >10% ETDRS grid (hazard ratio 30.05, 95% confidence interval [CI] 19.25-46.91) was most prognostic of progression. The highest AUC of late AMD (0.8372, 95% CI: 0.8070-0.8673) was achieved when all AMD features present at baseline were included.
Conclusions: Highest turnover rates from intermediate to late AMD were provided by the AREDS simplified scale and the Rotterdam classification. The 3-Continent harmonization classification showed the most stable progression. All features, especially drusen area, contribute to late AMD prediction.
Translational relevance: Findings will help stakeholders select appropriate classification systems for screening, deep learning algorithms, or trials.
Keywords: AMD; artificial intelligence; classification systems; clinical trials; screening.
Copyright 2020 The Authors.
Conflict of interest statement
Disclosure: E.F. Thee, None; M.A. Meester-Smoor, None; D.T. Luttikhuizen, None; J.M. Colijn, None; C.A. Enthoven, None; A.E.G. Haarman, None; D. Rizopoulos, None; C.C.W. Klaver, Théa Pharma (C, R), Bayer (F, C)
Figures
Similar articles
-
Validating the AREDS Simplified Severity Scale of Age-Related Macular Degeneration with 5- and 10-Year Incident Data in a Population-Based Sample.Ophthalmology. 2016 Sep;123(9):1874-8. doi: 10.1016/j.ophtha.2016.05.043. Epub 2016 Jul 2. Ophthalmology. 2016. PMID: 27378016
-
Prediction of age-related macular degeneration in the general population: the Three Continent AMD Consortium.Ophthalmology. 2013 Dec;120(12):2644-2655. doi: 10.1016/j.ophtha.2013.07.053. Epub 2013 Oct 10. Ophthalmology. 2013. PMID: 24120328 Free PMC article.
-
DeepSeeNet: A Deep Learning Model for Automated Classification of Patient-based Age-related Macular Degeneration Severity from Color Fundus Photographs.Ophthalmology. 2019 Apr;126(4):565-575. doi: 10.1016/j.ophtha.2018.11.015. Epub 2018 Nov 22. Ophthalmology. 2019. PMID: 30471319 Free PMC article.
-
Association of 2-Year Progression Along the AREDS AMD Scale and Development of Late Age-Related Macular Degeneration or Loss of Visual Acuity: AREDS Report 41.JAMA Ophthalmol. 2020 Jun 1;138(6):610-617. doi: 10.1001/jamaophthalmol.2020.0824. JAMA Ophthalmol. 2020. PMID: 32271358 Free PMC article. Clinical Trial.
-
Geographic distributions of age-related macular degeneration incidence: a systematic review and meta-analysis.Br J Ophthalmol. 2021 Oct;105(10):1427-1434. doi: 10.1136/bjophthalmol-2020-316820. Epub 2020 Sep 9. Br J Ophthalmol. 2021. PMID: 32907810
Cited by
-
Retinal pigment epithelium-Bruch's membrane volume in grading of age-related macular degeneration.Int J Ophthalmol. 2023 Nov 18;16(11):1827-1831. doi: 10.18240/ijo.2023.11.14. eCollection 2023. Int J Ophthalmol. 2023. PMID: 38028508 Free PMC article.
-
Sodium-Iodate Injection Can Replicate Retinal Degenerative Disease Stages in Pigmented Mice and Rats: Non-Invasive Follow-Up Using OCT and ERG.Int J Mol Sci. 2022 Mar 8;23(6):2918. doi: 10.3390/ijms23062918. Int J Mol Sci. 2022. PMID: 35328338 Free PMC article.
-
Incidence, progression and risk factors of age-related macular degeneration in 35-95-year-old individuals from three jointly designed German cohort studies.BMJ Open Ophthalmol. 2022 Jan 4;7(1):e000912. doi: 10.1136/bmjophth-2021-000912. eCollection 2022. BMJ Open Ophthalmol. 2022. PMID: 35047672 Free PMC article.
-
Identifying Imaging Predictors of Intermediate Age-Related Macular Degeneration Progression.Transl Vis Sci Technol. 2023 Jul 3;12(7):22. doi: 10.1167/tvst.12.7.22. Transl Vis Sci Technol. 2023. PMID: 37490304 Free PMC article.
-
Genomewide Association Study of Retinal Traits in the Amish Reveals Loci Influencing Drusen Development and Link to Age-Related Macular Degeneration.Invest Ophthalmol Vis Sci. 2022 Jul 8;63(8):17. doi: 10.1167/iovs.63.8.17. Invest Ophthalmol Vis Sci. 2022. PMID: 35857289 Free PMC article.
References
-
- Bourne RR, Jonas JB, Flaxman SR, et al. .. Prevalence and causes of vision loss in high-income countries and in Eastern and Central Europe: 1990-2010. Br J Ophthalmol. 2014; 98: 629–638. - PubMed
-
- Wong WL, Su X, Li X, et al. .. Global prevalence of age-related macular degeneration and disease burden projection for 2020 and 2040: a systematic review and meta-analysis. Lancet Glob Health. 2014; 2: e106–116. - PubMed
-
- Schmidt-Erfurth U, Sadeghipour A, Gerendas BS, Waldstein SM, Bogunovic H. Artificial intelligence in retina. Prog Retin Eye Res. 2018; 67: 1–29. - PubMed
-
- Kapoor R, Walters SP, Al-Aswad LA. The current state of artificial intelligence in ophthalmology. Surv Ophthalmol. 2019; 64: 233–240. - PubMed
Publication types
MeSH terms
LinkOut - more resources
Full Text Sources
Medical
