. 2020 Jul 29;2(8):e485-e496.
doi: 10.1016/S2665-9913(20)30168-5. eCollection 2020 Aug.

Disease-associated and patient-specific immune cell signatures in juvenile-onset systemic lupus erythematosus: patient stratification using a machine-learning approach

Affiliations

Disease-associated and patient-specific immune cell signatures in juvenile-onset systemic lupus erythematosus: patient stratification using a machine-learning approach

George A Robinson et al. Lancet Rheumatol. .

Abstract

Background: Juvenile-onset systemic lupus erythematosus (SLE) is a rare autoimmune rheumatic disease characterised by more severe disease manifestations, earlier damage accrual, and higher mortality than in adult-onset SLE. We aimed to use machine-learning approaches to characterise the immune cell profile of patients with juvenile-onset SLE and investigate links with the disease trajectory over time.

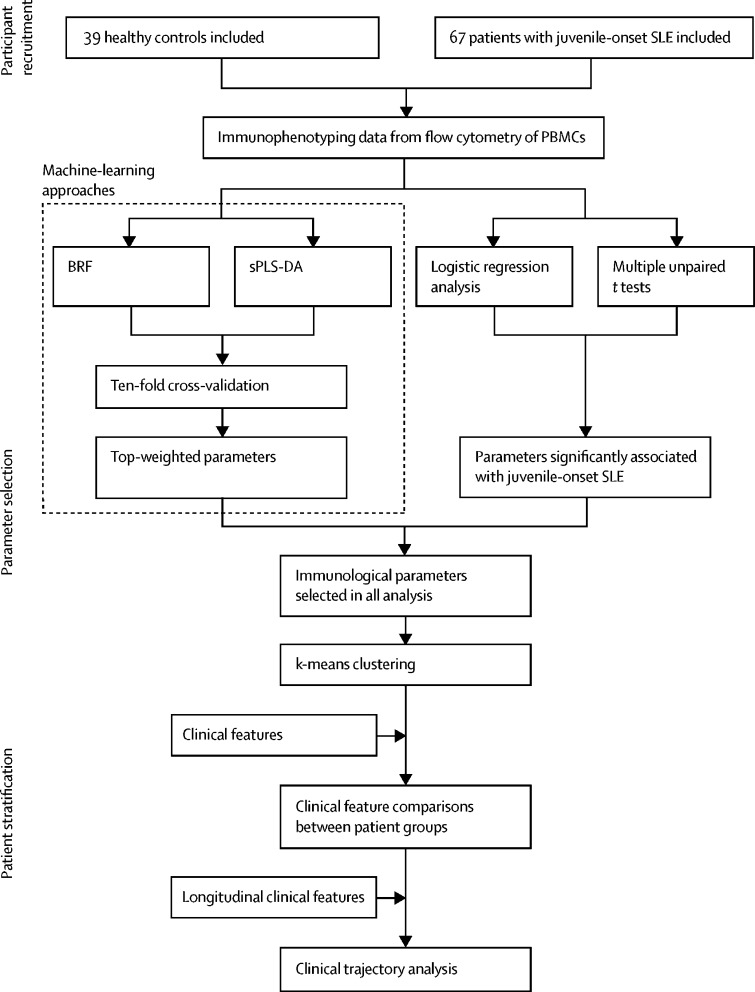
Methods: This study included patients who attended the University College London Hospital (London, UK) adolescent rheumatology service, had juvenile-onset SLE according to the 1997 American College of Rheumatology revised classification criteria for lupus or the 2012 Systemic Lupus International Collaborating Clinics criteria, and were diagnosed before 18 years of age. Blood donated by healthy age-matched and sex-matched volunteers who were taking part in educational events in the Centre for Adolescent Rheumatology Versus Arthritis at University College London (London, UK) was used as a control. Immunophenotyping profiles (28 immune cell subsets) of peripheral blood mononuclear cells from patients with juvenile-onset SLE and healthy controls were determined by flow cytometry. We used balanced random forest (BRF) and sparse partial least squares-discriminant analysis (sPLS-DA) to assess classification and parameter selection, and validation was by ten-fold cross-validation. We used logistic regression to test the association between immune phenotypes and k-means clustering to determine patient stratification. Retrospective longitudinal clinical data, including disease activity and medication, were related to the immunological features identified.

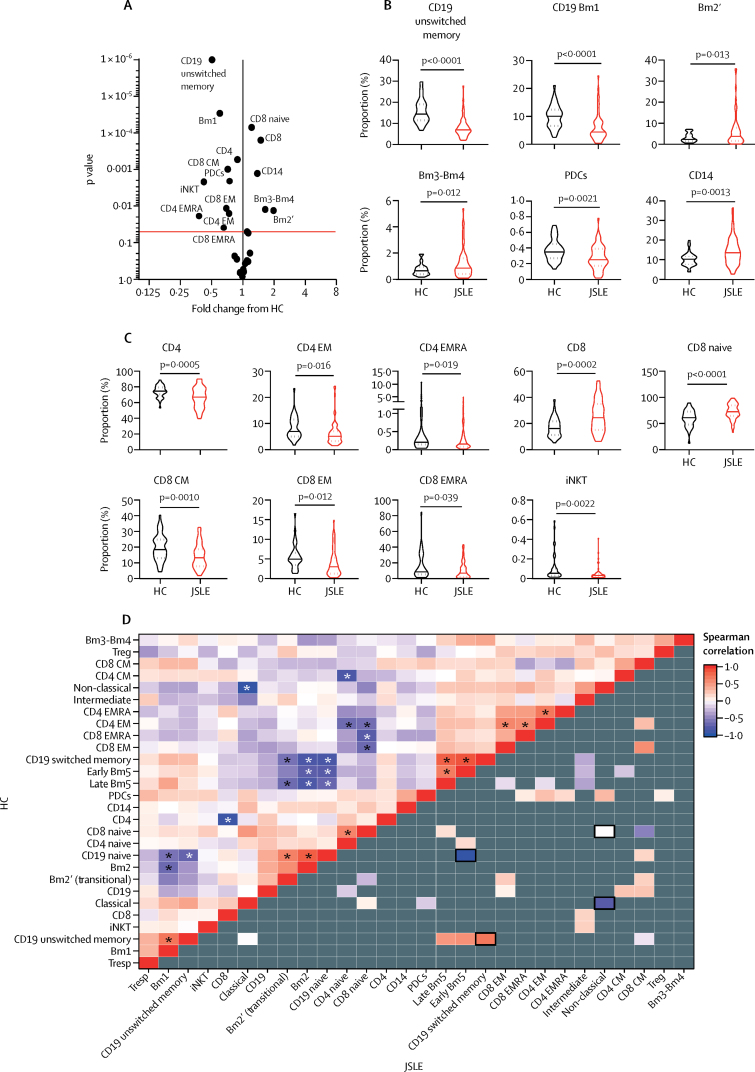
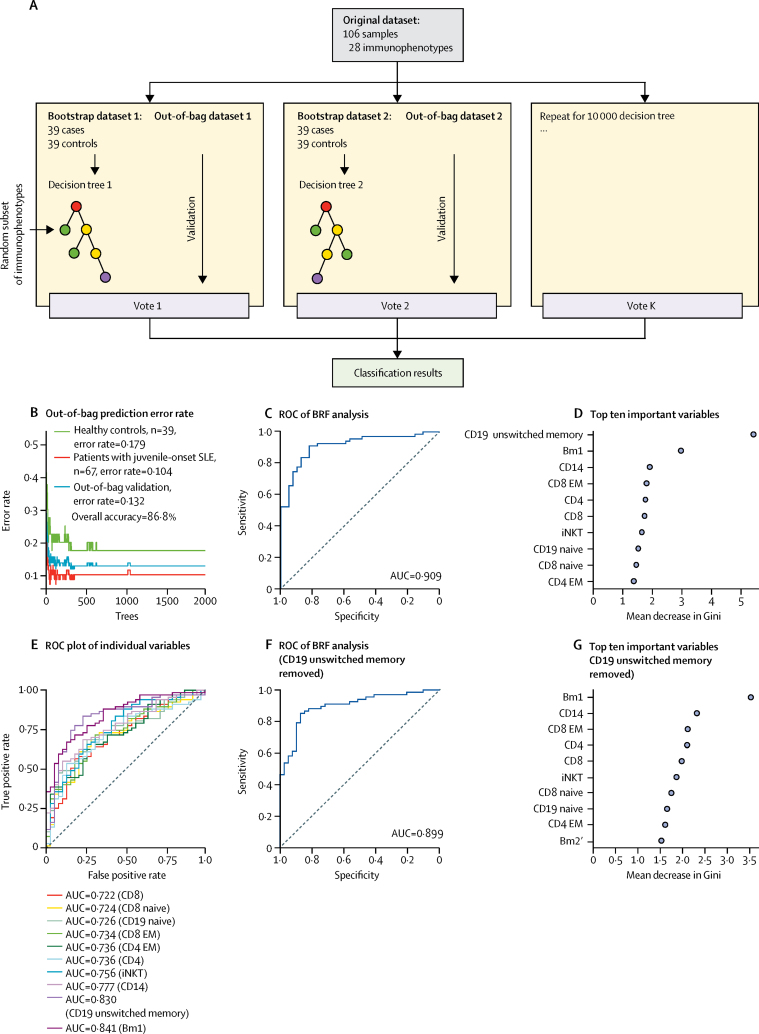
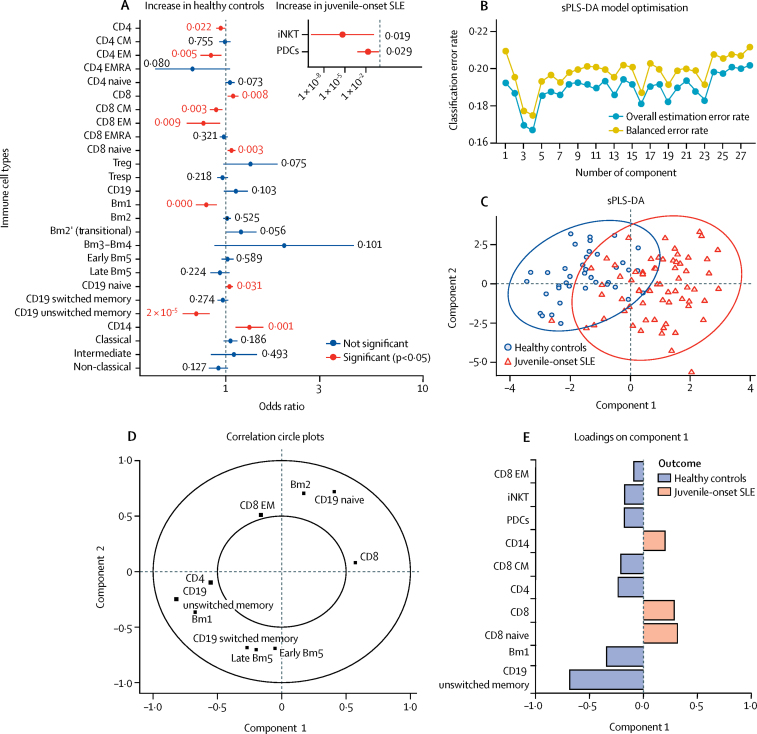
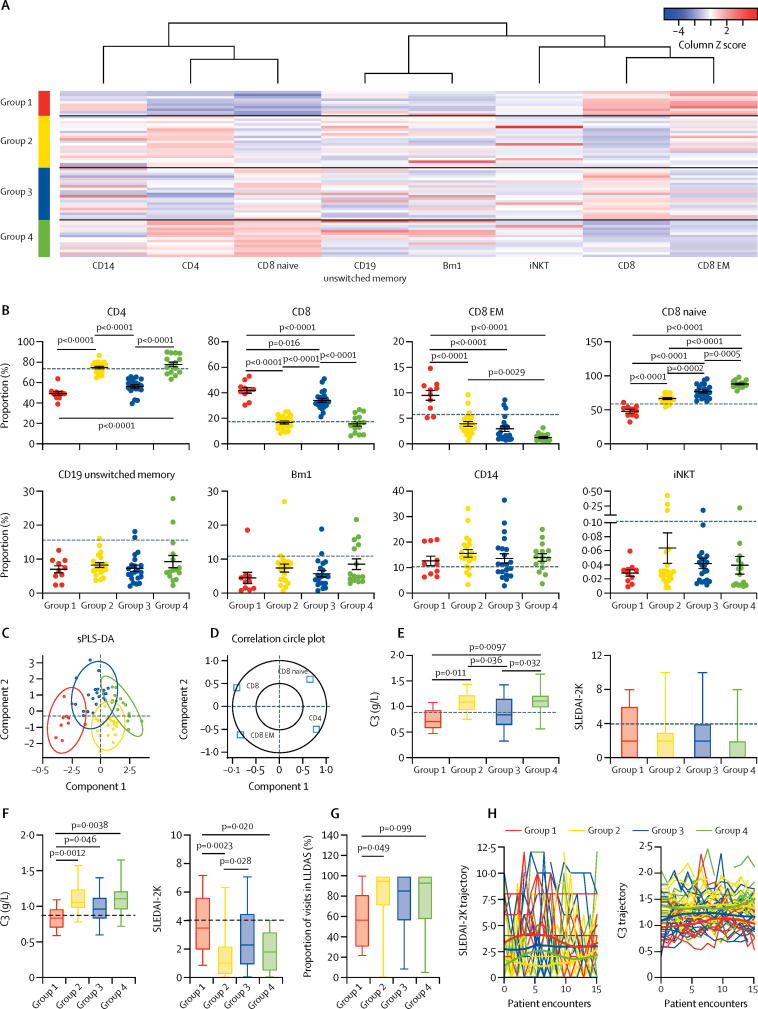
Findings: Between Sept 5, 2012, and March 7, 2018, peripheral blood was collected from 67 patients with juvenile-onset SLE and 39 healthy controls. The median age was 19 years (IQR 13-25) for patients with juvenile-onset SLE and 18 years (16-25) for healthy controls. The BRF model discriminated patients with juvenile-onset SLE from healthy controls with 90·9% prediction accuracy. The top-ranked immunological features from the BRF model were confirmed using sPLS-DA and logistic regression, and included total CD4, total CD8, CD8 effector memory, and CD8 naive T cells, Bm1, and unswitched memory B cells, total CD14 monocytes, and invariant natural killer T cells. Using these markers patients were clustered into four distinct groups. Notably, CD8 T-cell subsets were important in driving patient stratification, whereas B-cell markers were similarly expressed across the cohort of patients with juvenile-onset SLE. Patients with juvenile-onset SLE and elevated CD8 effector memory T-cell frequencies had more persistently active disease over time, as assessed by the SLE disease activity index 2000, and this was associated with increased treatment with mycophenolate mofetil and an increased prevalence of lupus nephritis. Finally, network analysis confirmed the strong association between immune phenotype and differential clinical features.

Interpretation: Machine-learning models can define potential disease-associated and patient-specific immune characteristics in rare disease patient populations. Immunological association studies are warranted to develop data-driven personalised medicine approaches for treatment of patients with juvenile-onset SLE.

Funding: Lupus UK, The Rosetrees Trust, Versus Arthritis, and UK National Institute for Health Research University College London Hospital Biomedical Research Centre.


Figures

Figure 1
Figure 1
Study design and analysis plan flow diagram BRF=balanced random forest. PBMCs=peripheral blood mononuclear cells. SLE=systemic lupus erythematosus. sPLS-DA=sparse partial least squares-discriminant analysis.
Figure 2
Figure 2
The immunological architecture is altered in juvenile-onset SLE (A) Volcano plot displaying comparison between patients with juvenile-onset SLE and heath controls. Fold change versus log10 p values are displayed from unpaired t tests. The red line indicates adjusted p value following 5% false discovery rate adjustment for multiple comparisons. (B, C) Violin plots displaying antigen presenting cells (panel B) and T-cell subsets (panel C) that were significantly different between healthy controls and patients with juvenile-onset SLE by unpaired t test. The solid line indicates the mean and the dashed line indicates the SE. Adjusted p values are shown. (D) Correlation comparison analysis performed on immune phenotyping data described in panel A. The upper left of the heat map shows the correlation between immune cell types (28 immunological variables) in healthy controls. Spearman correlation coefficients for each pair of cell types are represented by colour. Asterisks indicate significant correlations, p<0·05. The bottom right of the heat map shows the correlation between immune cell types in patients with juvenile-onset SLE. Grey indicates that the Spearman correlation coefficient is not signficantly different from that of healthy controls. Significantly different correlations in patients with juvenile-onset SLE compared with healthy controls are coloured (p<0·05) and outlined in black (p<0·01). CM=central memory. EM=effector memory. EMRA=effector memory cells re-expressing CD45RA. HC=healthy controls. iNKT=invariant natural killer T cells. JSLE=juvenile-onset SLE. PDCs=plasmacytoid dendritic cells. SLE=systemic lupus erythematosus. Treg=regulatory T cells. Tresp=responder T cells.
Figure 3
Figure 3
BRF analysis of immunophenotype data (A) Building a predictive model using a BRF approach (appendix pp 5–6). (B) Comparison of 28 different immune cell subsets in healthy controls (n=39) versus patients with juvenile-onset SLE (n=67) using the BRF model. (C) ROC analysis for the BRF model. (D) The top ten variables contributing to the BRF model are shown. The mean decrease in Gini measures the importance of each variable to the model: a higher score indicates a higher importance of the variable. (E) ROC with AUC from univariate models showing the sensitivity and specificty of the top ten markers identified by the model. (F) ROC analysis without CD19 unswitched memory B cells (the most predictive parameter). (G) The top ten contributing variables in the BRF model trained on 27 immunological parameters (excluding CD19+ unswitched memory cells). AUC=area under the curve. BRF=balanced random forest. EM=effector memory. iNKT=invariant natural killer T cells. ROC=receiver operating characteristic. SLE=systemic lupus erythematosus.
Figure 4
Figure 4
Top hits from BRF model validated with logistic regression analysis and sPLS-DA (A) Odds ratios (error bars indicate 95% CIs) of 28 immunological parameters were computed with univaraite logistic regression analysis. iNKT and PDC data is shown seperately inset because of very different CI values. (B) sPLS-DA model optimisation using ten-fold cross-validation. (C) sPLS-DA plot to validate the top hits from the predictive model. Individual distribution points and confidence ellipses (ovals) are plotted for the healthy control and juvenile-onset SLE groups. (D) Using this analysis, the weighting of each cell type in component 1 and 2 is displayed (inner circle is the 0·5 cutoff). (E) Factor loading weights in component 1 for the top ten ranked immunological parameters. The bars indicate the class with maximal mean value. Variables excluded from the plot have no weight in component 1. BRF=balanced random forest. CM=central memory. EM=effector memory. EMRA=effector memory cells re-expressing CD45RA. iNKT=invariant natural killer T cells. PDCs=plasmacytoid dendritic cells. SLE=systemic lupus erythematosus. sPLS-DA=sparse partial least squares-discriminant analysis. Treg=regulatory T cells. Tresp=responder T cells.
Figure 5
Figure 5
Patient clustering by top-weighted immunological parameters in patients with juvenile-onset SLE compared with healthy controls (A) Top-weighted immunological parameters of patients with juvenile-onset SLE (appendix pp 11–12) were stratified using k-means clustering. Immunophenotype is standardised within each column by Z score and plotted as a heat map, representing the relationship to the mean of the group (red represents relatively high frequency and blue represents relatively low frequency). Each row represents a patient with juvenile-onset SLE. Four groups of patients were recognised with distinct immune cell profiles. (B) Scatter dot plots displaying top-weighted immunological parameters between the k-means clustered groups. Mean (error bars indicate SE) was calculated with one-way ANOVA, and p values were calculated with Tukey's multiple comparisons test. The dashed lines represent the mean for the healthy control population for each cell type. (C) sPLS-DA plot showing the clustering of the validated top-weighted immunological parameters in patients with juvenile-onset SLE between k-means clustered juvenile-onset SLE groups. Individual distribution points and confidence ellipses (ovals) are plotted for each group. (D) Using this analysis, the weighting of each cell type in component 1 and 2 is displayed, where the inner circle is the 0·5 cutoff. (E) Box and whisker plots displaying baseline measures over 3–7 years of follow-up of clinical measures of disease activity between the k-means clustered groups of patients with juvenile-onset SLE. (F) Average measure over 3–7 years of follow-up of clinical measures of disease activity between the k-means clustered groups of patients with juvenile-onset SLE. Mean (error bars indicate SE) was calculated with one-way ANOVA, and p values were calculated with Tukey's multiple comparisons test. Dashed lines represent the clinical cutoff for active disease in the C3 plot and the assigned cutoff associated with active lupus in the SLEDAI-2K plot. (G) Box and whisker plot displaying longitudinal disease activity, using the same dataset from panel F, assessed as LLDAS. Mean (error bars indicate SE) was calculated with one-way ANOVA, and p values were calculated with Tukey's multiple comparisons test. (H) Individual patient trajectory of SLEDAI-2K and C3 over 15 clinical encounters displayed as spaghetti plots. Each line represents one patient with juvenile-onset SLE. Smoothing lines were added to indicate the trend of juvenile-onset SLE groups from previous k-means clustering. C3=complement component C3. iNKT=invariant natural killer T cells. LLDAS=lupus low disease activity state. SLE=systemic lupus erythematosus. SLEDAI-2K=systemic lupus erythematosus disease activity index 2000. sPLS-DA=sparse partial least squares-discriminant analysis.

References

    1. Lisnevskaia L, Murphy G, Isenberg D. Systemic lupus erythematosus. Lancet. 2014;384:1878–1888. - PubMed
    1. Mina R, Brunner HI. Pediatric lupus—are there differences in presentation, genetics, response to therapy, and damage accrual compared with adult lupus? Rheum Dis Clin North Am. 2010;36:53–80. - PMC - PubMed
    1. Ambrose N, Morgan TA, Galloway J, Ionnoau Y, Beresford MW, Isenberg DA. Differences in disease phenotype and severity in SLE across age groups. Lupus. 2016;25:1542–1550. - PMC - PubMed
    1. Tucker LB, Uribe AG, Fernández M. Adolescent onset of lupus results in more aggressive disease and worse outcomes: results of a nested matched case-control study within LUMINA, a multiethnic US cohort (LUMINA LVII) Lupus. 2008;17:314–322. - PMC - PubMed
    1. Brunner HI, Gladman DD, Ibañez D, Urowitz MD, Silverman ED. Difference in disease features between childhood-onset and adult-onset systemic lupus erythematosus. Arthritis Rheum. 2008;58:556–562. - PubMed