[Preprint]. 2020 Aug 11:rs.3.rs-49671.
doi: 10.21203/rs.3.rs-49671/v1.

Characterizing SARS-CoV-2 mutations in the United States

Affiliations

Characterizing SARS-CoV-2 mutations in the United States

Rui Wang et al. Res Sq. .

Update in

Abstract

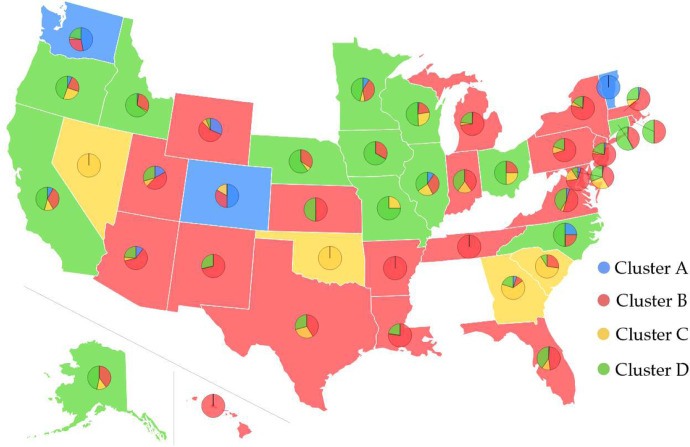
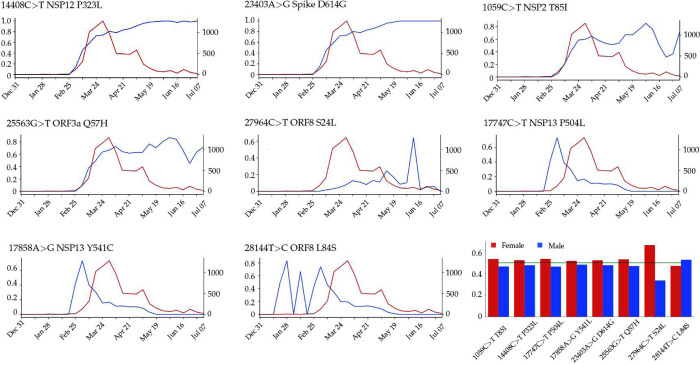
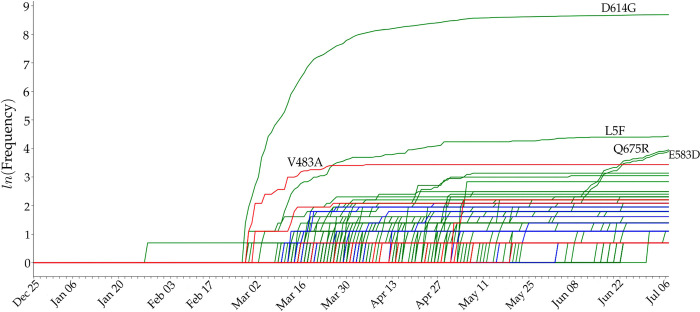
The severe acute respiratory syndrome coronavirus 2 (SARS-CoV-2) has been mutating since it was first sequenced in early January 2020. The genetic variants have developed into a few distinct clusters with different properties. Since the United States (US) has the highest number of viral infected patients globally, it is essential to understand the US SARS-CoV-2. Using genotyping, sequence-alignment, time-evolution, k-means clustering, protein-folding stability, algebraic topology, and network theory, we reveal that the US SARS-CoV-2 has four substrains and five top US SARS-CoV-2 mutations were first detected in China (2 cases), Singapore (2 cases), and the United Kingdom (1 case). The next three top US SARS-CoV-2 mutations were first detected in the US. These eight top mutations belong to two disconnected groups. The first group consisting of 5 concurrent mutations is prevailing, while the other group with three concurrent mutations gradually fades out. We identify that one of the top mutations, 27964C>T-(S24L) on ORF8, has an unusually strong gender dependence. Based on the analysis of all mutations on the spike protein, we further uncover that three of four US SASR-CoV-2 substrains become more infectious. Our study calls for effective viral control and containing strategies in the US.


Figures

Figure 1:
Figure 1:
Pie chart plot of four clusters in the United States as of July 14, 2020. The blue, red, yellow, and green colors represent clusters A, B, C, and D, respectively. The base color of each state is decided by its dominant cluster. Some of the states do not submit the complete genome sequences to GISAID. Therefore, we will not set the base color of these states.
Figure 2:
Figure 2:
The blue line plots illustrate the evolution of the top 8 missense mutation ratios computed as the frequency of genome sequences having mutations over the counts of genome sequences at each 10-days period. The red lines represent the evolution of the total counts of genome sequences. Bar plot of the gender distributions of the ratio of the number of samples having top 8 missense mutations over the total number of samples having age and/or gender labels. Red bars represent the female ratio and the blue bars represent the male ratio in the United States.
Figure 3:
Figure 3:
Sequence alignments for the NSP12 of SARS-CoV-2, SARS-CoV, bat coronavirus RaTG13, bat coronavirus CoVZC45, bat coronavirus BM48–31. Detailed numbering is given according to SARS-CoV-2. One high-frequency mutation 14408C>T-(P323L) is detected on the NSP12 protein. Here, the red rectangle marks the P323L mutations with its neighborhoods.
Figure 4:
Figure 4:
(a) The 3D structure of SARS-CoV-2 NSP12 protein. The mutated residue is marked with color balls. (b) The differences of FRI rigidity index between the network with wild type and the network with mutant type. (c) The difference of the subgraph centrality between the network with wild type and the network with mutant type.
Figure 5:
Figure 5:
Sequence alignments for the S proteins of SARS-CoV-2, SARS-CoV, bat coronavirus RaTG13, bat coronavirus CoVZC45, bat coronavirus BM48–31. Detailed numbering is given according to SARS-CoV-2 S protein. One high-frequency mutation 23403A>G-(D614G) is detected on the S protein. Here, the red rectangle marks the D614G mutations with its neighborhoods
Figure 6:
Figure 6:
Illustration of S-protein and ACE2 interaction. The RBD is displayed in green, the ACE2 is given in red, and mutation D614G is highlighted in red. (b) The difference of FRI rigidity index between the network with wild type and the network with mutant type. (c) The difference of the subgraph centrality between the network with wild type and the network with mutant type.
Figure 7:
Figure 7:
Sequence alignments for the ORF3a protein of SARS-CoV-2, SARS-CoV, bat coronavirus RaTG13, bat coronavirus CoVZC45, bat coronavirus BM48–31. Detailed numbering is given according to SARS-CoV-2. One high-frequency mutation 25563G>T-(Q57H) locates on the ORF3a protein. Here, the red rectangle marks the Q57H position with its neighborhoods.
Figure 8:
Figure 8:
(a) The 3D structure of SARS-CoV-2 ORF3a protein. (b) The visualization of SARS-CoV-2 ORF3a proteoform. The high-frequency mutation 25563G>T-(Q57H) on ORF3a is marked in color. The red color represents the wild type and the yellow represents the wild type. (c) The difference of FRI rigidity index between the network with wild type and the network with mutant type. (d) The difference of the subgraph centrality between the network with wild type and the network with mutant type.
Figure 9:
Figure 9:
Sequence alignments for the NSP2 of SARS-CoV-2, SARS-CoV, bat coronavirus RaTG13, bat coronavirus CoVZC45, bat coronavirus BM48–31. Detailed numbering is given according to SARS-CoV-2. One high-frequency mutation 1059C>T-(T85I) locates on the NSP2 protein. Here, the red rectangle marks the T85I position with its neighborhoods.
Figure 10:
Figure 10:
(a) The 3D structure of SARS-CoV-2 NSP2 protein. The mutant residue is marked with color balls. (b) The difference of FRI rigidity index between the network with wild type and the network with mutant type. (c) The difference of the subgraph centrality between the network with wild type and the network with mutant type.
Figure 11:
Figure 11:
Sequence alignments for the NSP13 protein of SARS-CoV-2, SARS-CoV, bat coronavirus RaTG13, bat coronavirus CoVZC45, bat coronavirus BM48–31. Detailed numbering is given according to SARS-CoV-2. Two high-frequency mutations 17858A>G-(Y541C) and 17747C>T-(P504L) locate on NSP13. Here, the red rectangles mark the Y541C and P504: mutations with their neighborhoods.
Figure 12:
Figure 12:
(a) The 3D structure of SARS-CoV-2 NSP13 protein. The mutant residue is marked with color balls. (b) The difference of FRI rigidity index between the network with wild type and the network with mutant type. (c) The difference of the subgraph centrality between the network with wild type and the network with mutant type.
Figure 13:
Figure 13:
Sequence alignments for the ORF8 protein of SARS-CoV-2, SARS-CoV, bat coronavirus RaTG13, bat coronavirus CoVZC45, bat coronavirus BM48–31. Detailed numbering is given according to SARS-CoV-2. Two high-frequency mutations 28144T>C-(L84S) and 27964C>T-(S24L) locate on the ORF8. Here, the red rectangles mark the S24L and L84S mutations with their neighborhoods.
Figure 14:
Figure 14:
(a) The 3D structure of SARS-CoV-2 ORF8 protein. The mutant residue is marked with color balls. (b) The difference of FRI rigidity index between the network with wild type and the network with mutant type. (c) The difference of the subgraph centrality between the network with wild type and the network with mutant type.
Figure 15:
Figure 15:
Overall binding affinity changes ΔΔG (kcal/mol) on the receptor-binding domain (RBD). The blue color region marks the binding affinity changes on the receptor-binding motif (RBM). The height of each bar indicates the predicted ΔΔG. The color indicates the occurrence frequency in the GISAID genome dataset.
Figure 16:
Figure 16:
The time evolution of 264 SARS-CoV-2 S protein mutations. The red lines represent the RBD mutations that strengthen the infectivity of SARS-CoV-2 (i.e., ΔΔG is positive), the blue lines represent the RBD mutations that weaken the infectivity of SARS-CoV-2 (i.e., ΔΔG is negative), and the green lines are for S protein mutations that away from the RBD. The mutation with the highest frequency is D614G.
Figure 17:
Figure 17:
Cluster A. Left: binding affinity changes ΔΔG (kcal/mol) induced by mutations in Cluster V. Right: mutations on the SARS-CoV-2 S protein RBD.
Figure 18:
Figure 18:
Cluster B. Left: binding affinity changes ΔΔG (kcal/mol) induced by mutations in Cluster B. Right: mutations on the SARS-CoV-2 S protein RBD.
Figure 19:
Figure 19:
Cluster C. Left: binding affinity changes ΔΔG (kcal/mol) induced by mutations in Cluster C. Right: mutations on the SARS-CoV-2 S protein RBD.
Figure 20:
Figure 20:
Cluster D. Left: binding affinity changes ΔΔG (kcal/mol) induced by mutations in Cluster D. Right: mutations on the SARS-CoV-2 S protein RBD.

Similar articles

Cited by

References

    1. Adedeji O., Marchand B., Te Velthuis A. J., Snijder E. J., Weiss S., Eoff R. L., Singh K., and Sarafianos S. G.. Mechanism of nucleic acid unwinding by SARS-CoV helicase. PloS One, 7(5):e36521, 2012. - PMC - PubMed
    1. Benson D. A., Karsch-Mizrachi I., Lipman D. J., Ostell J., and Sayers E. W.. GenBank. Nucleic acids research, 37(suppl 1):D26–D31, 2009. - PMC - PubMed
    1. Cang Z. and Wei G.-W.. Analysis and prediction of protein folding energy changes upon mutation by element specific persistent homology. Bioinformatics, 33(22):3549–3557, 2017. - PubMed
    1. Carlsson G.. Topology and data. Bulletin of the American Mathematical Society, 46(2):255–308, 2009.
    1. Chen J., Wang R., Wang M., and Wei G.-W.. Mutations strengthened SARS-CoV-2 infectivity. Journal of Molecular Biology, 10.1016/j.jmb.2020.07.009, 2020. - DOI - PMC - PubMed

Publication types

LinkOut - more resources