

Small Airway Wall Thickening Assessed by Computerized Tomography Is Associated With Low Lung Function in Chinese Carbon Black Packers
- PMID: 32818265
- PMCID: PMC7825005
- DOI: 10.1093/toxsci/kfaa134
Small Airway Wall Thickening Assessed by Computerized Tomography Is Associated With Low Lung Function in Chinese Carbon Black Packers
Abstract
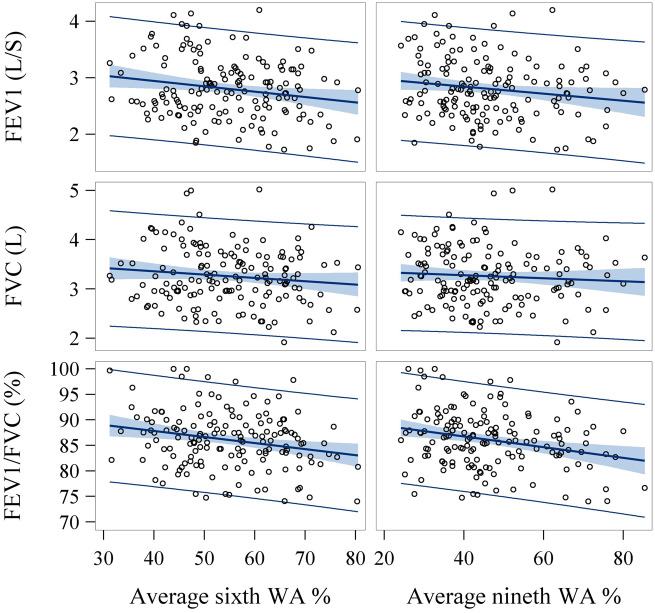
Nanoscale carbon black as virtually pure elemental carbon can deposit deep in the lungs and cause pulmonary injury. Airway remodeling assessed using computed tomography (CT) correlates well with spirometry in patients with obstructive lung diseases. Structural airway changes caused by carbon black exposure remain unknown. Wall and lumen areas of sixth and ninth generations of airways in 4 lobes were quantified using end-inhalation CT scans in 58 current carbon black packers (CBPs) and 95 non-CBPs. Carbon content in airway macrophage (CCAM) in sputum was quantified to assess the dose-response. Environmental monitoring and CCAM showed a much higher level of elemental carbon exposure in CBPs, which was associated with higher wall area and lower lumen area with no change in total airway area for either airway generation. This suggested small airway wall thickening is a major feature of airway remodeling in CBPs. When compared with wall or lumen areas, wall area percent (WA%) was not affected by subject characteristics or lobar location and had greater measurement reproducibility. The effect of carbon black exposure status on WA% did not differ by lobes. CCAM was associated with WA% in a dose-dependent manner. CBPs had lower FEV1 (forced expiratory volume in 1 s) than non-CBPs and mediation analysis identified that a large portion (41-72%) of the FEV1 reduction associated with carbon black exposure could be explained by WA%. Small airway wall thickening as a major imaging change detected by CT may underlie the pathology of lung function impairment caused by carbon black exposure.
Keywords: airway wall thickening; carbon black; carbon content in airway macrophage; dose-response; mediation effect.
© The Author(s) 2020. Published by Oxford University Press on behalf of the Society of Toxicology. All rights reserved. For permissions, please e-mail: journals.permissions@oup.com.
Figures


Similar articles
-
Chronic exposure to diesel exhaust may cause small airway wall thickening without lumen narrowing: a quantitative computerized tomography study in Chinese diesel engine testers.Part Fibre Toxicol. 2021 Mar 25;18(1):14. doi: 10.1186/s12989-021-00406-1. Part Fibre Toxicol. 2021. PMID: 33766066 Free PMC article.
-
Carbon content in airway macrophages and genomic instability in Chinese carbon black packers.Arch Toxicol. 2020 Mar;94(3):761-771. doi: 10.1007/s00204-020-02678-6. Epub 2020 Feb 19. Arch Toxicol. 2020. PMID: 32076763
-
Relationship between airway wall thickness assessed by high-resolution computed tomography and lung function in patients with asthma and chronic obstructive pulmonary disease.J Physiol Pharmacol. 2009 Nov;60 Suppl 5:71-6. J Physiol Pharmacol. 2009. PMID: 20134043
-
Acute respiratory symptoms following massive carbon black exposure.Occup Med (Lond). 2012 Oct;62(7):578-80. doi: 10.1093/occmed/kqs149. Epub 2012 Sep 4. Occup Med (Lond). 2012. PMID: 22949585 Review.
-
Computed Tomographic Airway Morphology in Chronic Obstructive Pulmonary Disease. Remodeling or Innate Anatomy?Ann Am Thorac Soc. 2016 Jan;13(1):4-9. doi: 10.1513/AnnalsATS.201506-371PP. Ann Am Thorac Soc. 2016. PMID: 26562761 Free PMC article. Review.
Cited by
-
Joint Effects of Carbon Black Exposure and Dietary Antioxidant Vitamin Intake on Small Airway Dysfunction.Front Nutr. 2021 Oct 25;8:716398. doi: 10.3389/fnut.2021.716398. eCollection 2021. Front Nutr. 2021. PMID: 34760908 Free PMC article.
-
Worse pulmonary function in association with cumulative exposure to nanomaterials. Hints of a mediation effect via pulmonary inflammation.Part Fibre Toxicol. 2024 Jun 28;21(1):28. doi: 10.1186/s12989-024-00589-3. Part Fibre Toxicol. 2024. PMID: 38943182 Free PMC article.
-
Chronic exposure to diesel exhaust may cause small airway wall thickening without lumen narrowing: a quantitative computerized tomography study in Chinese diesel engine testers.Part Fibre Toxicol. 2021 Mar 25;18(1):14. doi: 10.1186/s12989-021-00406-1. Part Fibre Toxicol. 2021. PMID: 33766066 Free PMC article.
-
Quantitative CT Analysis of Small Airway Remodeling in Patients with Chronic Obstructive Pulmonary Disease by a New Image Post-Processing System.Int J Chron Obstruct Pulmon Dis. 2021 Mar 2;16:535-544. doi: 10.2147/COPD.S295320. eCollection 2021. Int J Chron Obstruct Pulmon Dis. 2021. PMID: 33688178 Free PMC article.
-
Early natural menopause is associated with poor lung health and increased mortality among female smokers.Am J Obstet Gynecol. 2022 Dec;227(6):885.e1-885.e12. doi: 10.1016/j.ajog.2022.07.031. Epub 2022 Aug 4. Am J Obstet Gynecol. 2022. PMID: 35934119 Free PMC article.
References
-
- Bai Y., Brugha R. E., Jacobs L., Grigg J., Nawrot T. S., Nemery B. (2015). Carbon loading in airway macrophages as a biomarker for individual exposure to particulate matter air pollution - A critical review. Environ. Int. 74, 32–41. - PubMed
-
- Bai Y., Casas L., Scheers H., Janssen B. G., Nemery B., Nawrot T. S. (2018. b). Mitochondrial DNA content in blood and carbon load in airway macrophages. A panel study in elderly subjects. Environ. Int. 119, 47–53. - PubMed
-
- Bergeron C., Tulic M. K., Hamid Q. (2007). Tools used to measure airway remodelling in research. Eur. Respir. J. 29, 596–604. - PubMed
Publication types
MeSH terms
Substances
Grants and funding
LinkOut - more resources
Full Text Sources
Medical
