Mining TCGA database for genes of prognostic value in gastric cancer microenvironment
- PMID: 32818296
- PMCID: PMC7576220
- DOI: 10.1111/jcmm.15595
Mining TCGA database for genes of prognostic value in gastric cancer microenvironment
Abstract
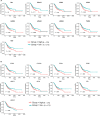
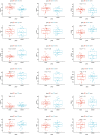
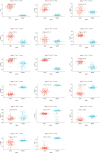
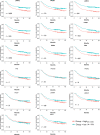
Gastric cancer (GC) is the sixth most common malignancy and the third leading cause of cancer-related death worldwide. Emerging evidence suggests that tumour microenvironment cells play a vital role in the development and prognosis of GC. To investigate the possible effect of stromal scores and immune scores on the overall survival (OS) on the GC patients, we divided GC patients into 'high' and 'low' groups based on their stromal and immune scores, and found differentially expressed genes related to prognosis of GC patients. Functional enrichment analysis and GSVA further revealed that focal adhesion and ECM-receptor interaction are associated with GC patients' survival. Finally, we analysed the effects of genes commonly involved in focal adhesion and ECM-receptor interaction on GC patients' survival and validated our results in another GC cohort from GEO data sets. In conclusion, we obtained a list of tumour microenvironment-related genes that predict poor prognosis in GC patients.
Keywords: estimate; gastric cancer; prognostic marker; tumour microenvironment.
© 2020 The Authors. Journal of Cellular and Molecular Medicine published by Foundation for Cellular and Molecular Medicine and John Wiley & Sons Ltd.
Conflict of interest statement
The authors declare that there are no conflicts of interest.
Figures


Similar articles
-
Mining TCGA database for genes of prognostic value in glioblastoma microenvironment.Aging (Albany NY). 2018 Apr 16;10(4):592-605. doi: 10.18632/aging.101415. Aging (Albany NY). 2018. PMID: 29676997 Free PMC article.
-
Prognostic values of GPNMB identified by mining TCGA database and STAD microenvironment.Aging (Albany NY). 2020 Aug 21;12(16):16238-16254. doi: 10.18632/aging.103646. Epub 2020 Aug 21. Aging (Albany NY). 2020. PMID: 32833670 Free PMC article.
-
Identification and verification of the molecular mechanisms and prognostic values of the cadherin gene family in gastric cancer.Sci Rep. 2021 Dec 8;11(1):23674. doi: 10.1038/s41598-021-03086-1. Sci Rep. 2021. PMID: 34880371 Free PMC article.
-
The role of macrophages in gastric cancer.Front Immunol. 2023 Dec 6;14:1282176. doi: 10.3389/fimmu.2023.1282176. eCollection 2023. Front Immunol. 2023. PMID: 38143746 Free PMC article. Review.
-
Interaction between gastric cancer stem cells and the tumor microenvironment.J Gastroenterol. 2014 Jul;49(7):1111-20. doi: 10.1007/s00535-014-0952-0. Epub 2014 Mar 21. J Gastroenterol. 2014. PMID: 24652101 Review.
Cited by
-
Identification of Differentially Expressed Genes Reveals BGN Predicting Overall Survival and Tumor Immune Infiltration of Gastric Cancer.Comput Math Methods Med. 2021 Nov 26;2021:5494840. doi: 10.1155/2021/5494840. eCollection 2021. Comput Math Methods Med. 2021. PMID: 34868341 Free PMC article.
-
Immune Checkpoint Gene Expression Profiling Identifies Programmed Cell Death Ligand-1 Centered Immunologic Subtypes of Oral and Squamous Cell Carcinoma With Favorable Survival.Front Med (Lausanne). 2022 Jan 20;8:759605. doi: 10.3389/fmed.2021.759605. eCollection 2021. Front Med (Lausanne). 2022. PMID: 35127742 Free PMC article.
-
A novel focal adhesion related gene signature for prognostic prediction in hepatocellular carcinoma.Aging (Albany NY). 2021 Apr 13;13(7):10724-10748. doi: 10.18632/aging.202871. Epub 2021 Apr 13. Aging (Albany NY). 2021. PMID: 33850056 Free PMC article.
-
Constructing a tumor immune microenvironment-driven prognostic model in acute myeloid leukemia using bioinformatics and validation data.Sci Rep. 2025 Jul 18;15(1):26123. doi: 10.1038/s41598-025-03557-9. Sci Rep. 2025. PMID: 40681545 Free PMC article.
-
An integrated bioinformatic investigation of focal adhesion-related genes in glioma followed by preliminary validation of COL1A2 in tumorigenesis.Aging (Albany NY). 2023 Jun 22;15(13):6225-6254. doi: 10.18632/aging.204834. Epub 2023 Jun 22. Aging (Albany NY). 2023. PMID: 37354488 Free PMC article.
References
-
- Global Burden of Disease Cancer Collaboration , Fitzmaurice C, Abate D, et al. National Cancer Incidence, mortality, years of life lost, years lived with disability, and disability‐adjusted life‐years for 29 cancer groups, 1990 to 2017: a systematic analysis for the Global Burden of Disease Study. JAMA Oncol. 2019;5(12):1749–1768. - PMC - PubMed
-
- Ferro A, Peleteiro B, Malvezzi M, et al. Worldwide trends in gastric cancer mortality (1980–2011), with predictions to 2015, and incidence by subtype. Eur J Cancer. 2014;50:1330‐1344. - PubMed
-
- Coutzac C, Pernot S, Chaput N, Zaanan A. Immunotherapy in advanced gastric cancer, is it the future? Crit Rev Oncol Hematol. 2019;133:25‐32. - PubMed
Publication types
MeSH terms
LinkOut - more resources
Full Text Sources
Medical
Miscellaneous

