. 2020 Sep;26(9):2077-2086.
doi: 10.3201/eid2609.191472.

Heterogeneity of Dengue Illness in Community-Based Prospective Study, Iquitos, Peru

Heterogeneity of Dengue Illness in Community-Based Prospective Study, Iquitos, Peru

William H Elson et al. Emerg Infect Dis. 2020 Sep.

Abstract

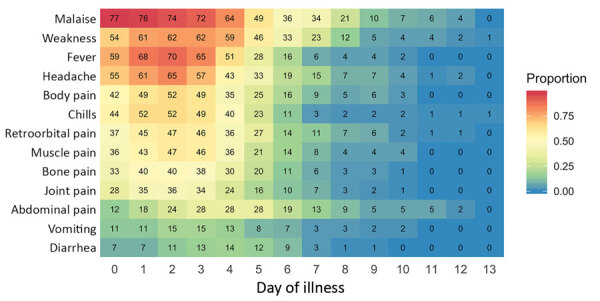
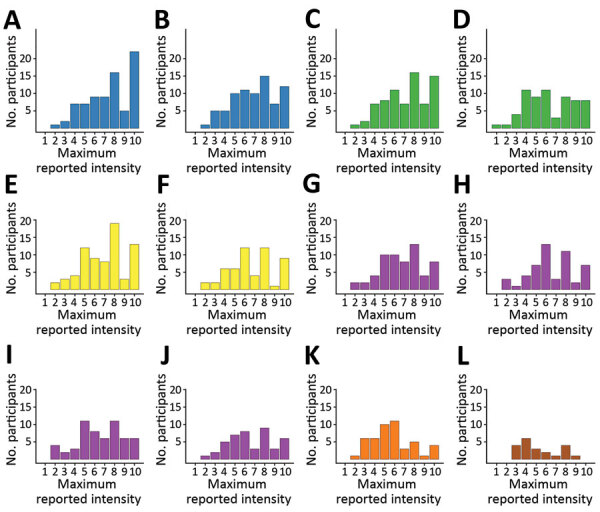
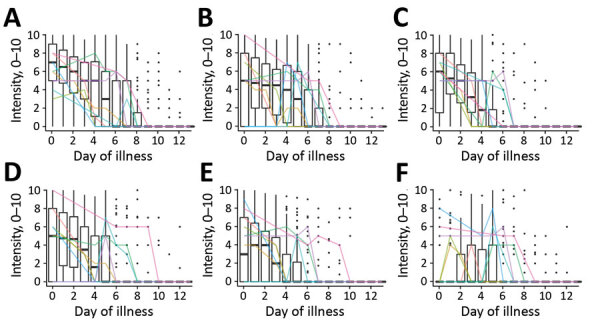
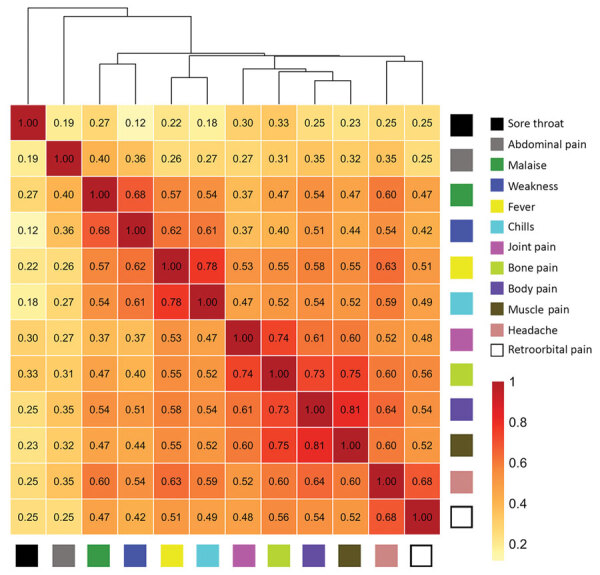
Measuring heterogeneity of dengue illness is necessary to define suitable endpoints in dengue vaccine and therapeutic trials and will help clarify behavioral responses to illness. To quantify heterogeneity in dengue illness, including milder cases, we developed the Dengue Illness Perceptions Response (IPR) survey, which captured detailed symptom data, including intensity, duration, and character, and change in routine activities caused by illness. During 2016-2019, we collected IPR data daily during the acute phase of illness for 79 persons with a positive reverse transcription PCR result for dengue virus RNA. Most participants had mild ambulatory disease. However, we measured substantial heterogeneity in illness experience, symptom duration, and maximum reported intensity of individual symptoms. Symptom intensity was a more valuable predicter of major activity change during dengue illness than symptom presence or absence alone. These data suggest that the IPR measures clinically useful heterogeneity in dengue illness experience and its relation to altered human behavior.

Keywords: Iquitos; Peru; cohort studies; community-based prospective study; dengue; dengue virus; epidemiology; heterogeneity; humans; viruses.


Figures

Figure 1
Figure 1
Timing of 13 key dengue symptoms for participants tested for heterogeneity of dengue illness in community-based prospective study, Iquitos, Peru. The x-axis represents day of illness and y-axis individual symptoms. Numbers in tiles indicate total number of persons with a symptom on that day. A total of 79 persons infected with dengue virus participated in surveys.
Figure 2
Figure 2
Histograms of maximum reported symptom intensities for participants tested for heterogeneity of dengue illness in community-based prospective study, Iquitos, Peru. Persons who did not report symptoms were excluded. Colors in histograms correspond to symptom groups defined in Appendix Figure 1. Values for each panel are no. (%) of participants who reported the specific symptom at any time during their illness. A) malaise, 78 (98.7); B) weakness, 76 (96.2); C) fever, 74 (93.7); D) chills, 65 (82.3); E) headache, 72 (91.1); F) retroorbital pain, 54 (68.4); G) body pain, 61 (77.2); H) bone pain, 51 (64.6); I) muscle pain, 57 (72.2); J) joint pain, 45 (57.0); K) abdominal pain, 47 (59.5); L) sore throat, 21 (26.6).
Figure 3
Figure 3
Symptom intensities (scale 1–12) for 6 symptoms over the first 14 days of illness (0–13) for participants tested for heterogeneity of dengue illness in community-based prospective study, Iquitos, Peru. A) Malaise; B) weakness; C) fever; D) headache; E) body pain; F) abdominal pain. Box plots indicate trends for the study population as a whole. Dark horizontal lines indicate median, upper limit of box indicates 75th percentile, lower limit of box indicates 25th percentile, upper whisker extends to the largest value <1.5 times the interquartile range; and lower whisker extends to the smallest value >1.5 times the interquartile range. Black dots indicate individual scores. Colored lines indicate trajectories for a random sample of 10 individual participants.
Figure 4
Figure 4
Correlations of intensities of individual symptoms (379 surveys, 79 participants) and hierarchical clustering for participants tested for heterogeneity of dengue illness in community-based prospective study, Iquitos, Peru. Tile colors indicate strength of correlations. The height at which symptoms are linked in the dendrogram indicates how strongly they are related (lower height indicates a closer link).

References

    1. World Health Organization. Dengue: guidelines for diagnosis, treatment, prevention and control, 2009. Geneva: The Organization [cited 2019 Mar 14]. http://www.ncbi.nlm.nih.gov/books/NBK143157 - PubMed
    1. Simmons CP, Farrar JJ, Nguyen V, Wills B. Dengue. N Engl J Med. 2012;366:1423–32. 10.1056/NEJMra1110265 - DOI - PubMed
    1. Martínez-Vega RA, Carrasquila G, Luna E, Ramos-Castañeda J. ADE and dengue vaccination. Vaccine. 2017;35:3910–2. 10.1016/j.vaccine.2017.06.004 - DOI - PubMed
    1. World Health Organization Special Programme for Research and Training in Tropical Diseases. Dengue: guidelines for diagnosis, treatment, prevention, and control, 2009. [cited 2020 Jun 3]. https://apps.who.int/iris/handle/10665/44188 - PubMed
    1. World Health Organization. Dengue haemorrhagic fever: diagnosis, treatment, prevention, and control. 2nd ed. Geneva: The Organization; 1997.

Publication types