

Could masks curtail the post-lockdown resurgence of COVID-19 in the US?
- PMID: 32818515
- PMCID: PMC7431430
- DOI: 10.1016/j.mbs.2020.108452
Could masks curtail the post-lockdown resurgence of COVID-19 in the US?
Abstract
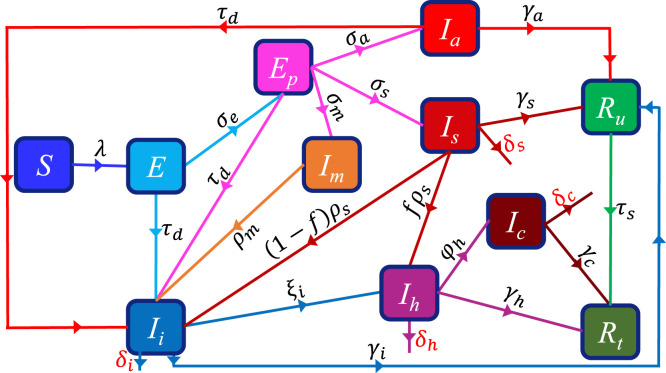
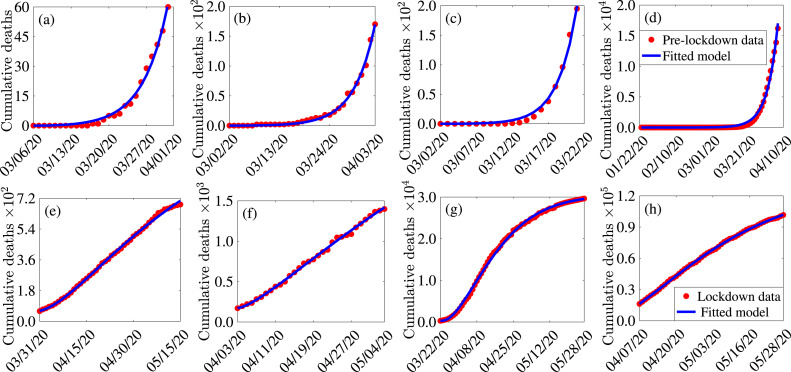
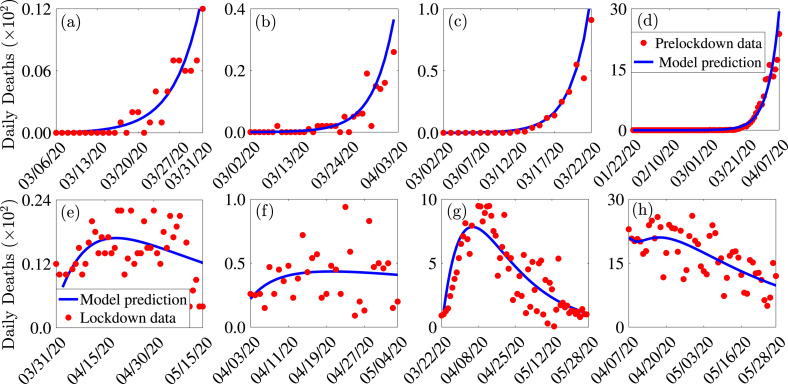
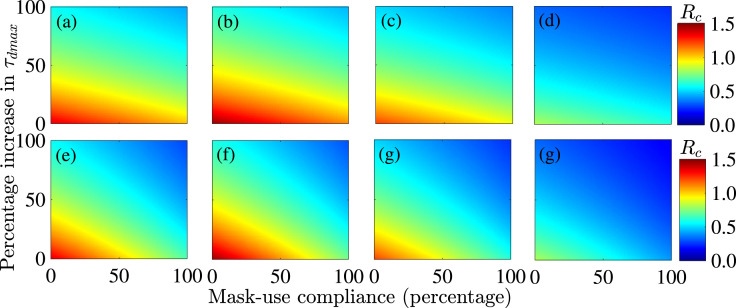
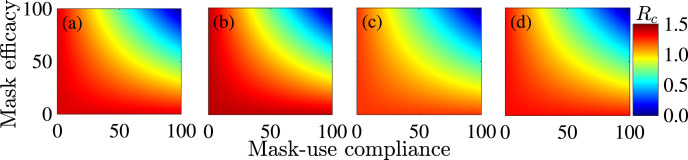
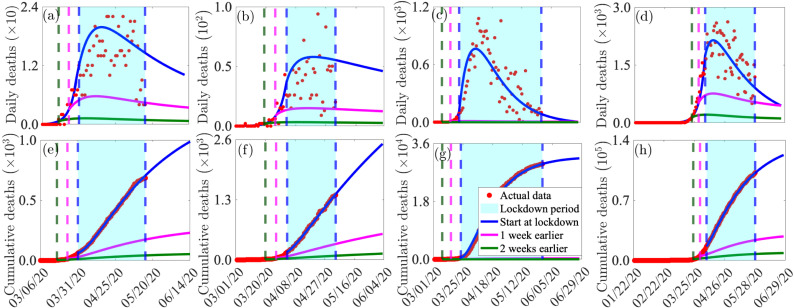
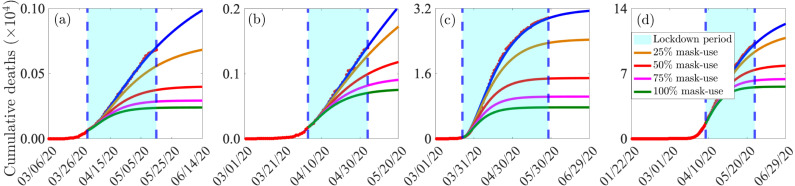
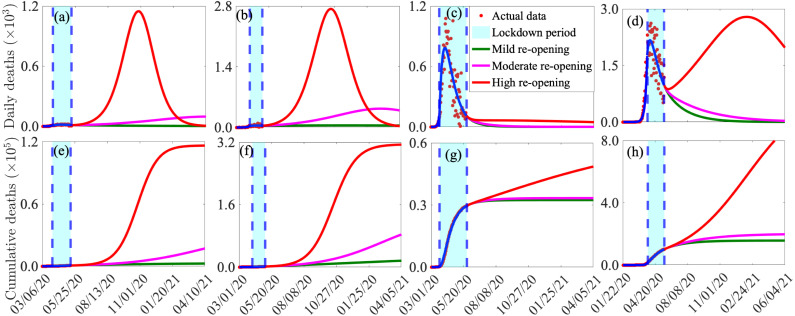
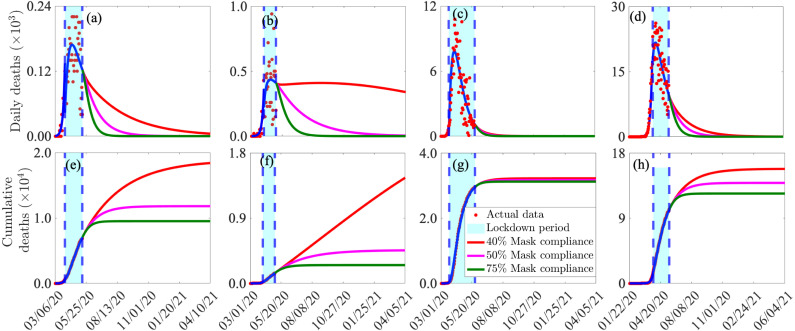
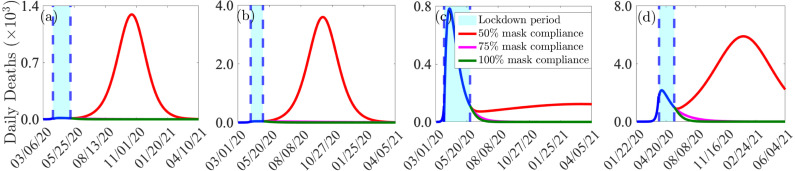
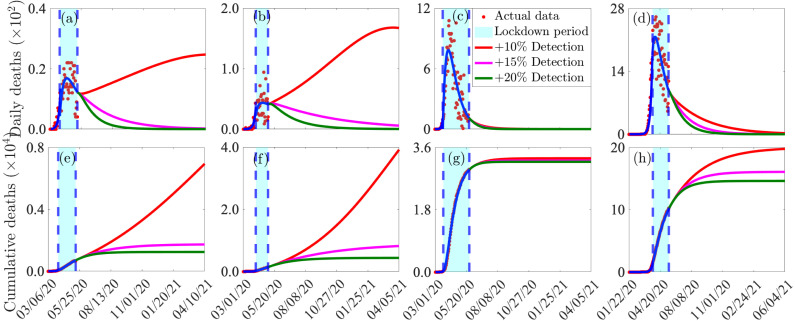
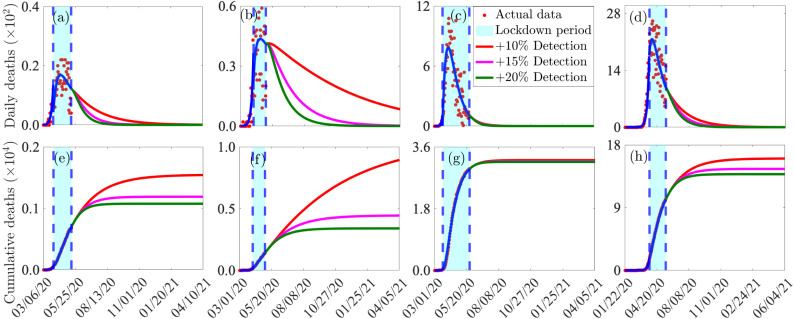
The community lockdown measures implemented in the United States from late March to late May of 2020 resulted in a significant reduction in the community transmission of the COVID-19 pandemic throughout the country. However, a number of US states are currently experiencing an alarming post-lockdown resurgence of the pandemic, triggering fears for a devastating second pandemic wave. We designed a mathematical model for addressing the key question of whether or not the universal use of face masks can halt such resurgence (and possibly avert a second wave, without having to undergo another cycle of major community lockdown) in the states of Arizona, Florida, New York and the entire US. Model calibration, using cumulative mortality data for the four jurisdictions during their respective pre-lockdown and lockdown periods, show that pre-symptomatic and asymptomatically-infectious individuals are, by far, the main drivers of the COVID-19 pandemic in each of the jurisdictions. The implication of this result is that detecting and isolating individuals with clinical symptoms of the pandemic alone (even if all of them are found) may not be sufficient to effectively curtail the pandemic. To achieve such control, it is crucially-necessary that pre-symptomatic and asymptomatically-infectious individuals are rapidly detected and isolated (and their contacts rapidly traced and tested). Our study highlights the importance of early implementation of the community lockdown measures. In particular, a sizable reduction in the burden of the pandemic would have been recorded in each of the four jurisdictions if the community lockdown measures were implemented a week or two earlier. These reductions are significantly increased if the early implementation of the lockdown measures was complemented with a public face mask use strategy. With all related control measures maintained at their baseline levels, this study shows that the pandemic would have been almost completely suppressed from significantly taking off if the lockdown measures were implemented two weeks earlier, and if a sizable percentage of the residents of the four jurisdictions wore face masks during the respective lockdown periods. The burden of the second wave of the pandemic would have been reduced significantly if the lockdown measures were extended by two weeks. We simulated the pandemic in the four jurisdictions under three levels of lifting of community lockdown, namely mild, moderate and high. For the scenario where the control measures adopted are maintained at their baseline levels during the lockdown period, our simulations show that the states of Arizona and Florida will record devastating second waves of the pandemic by the end of 2020, while the state of New York and the entire US will record milder second waves. If the community lockdown measures were lifted at the mild lifting level (i.e., only limited community contacts and business activities are allowed, in comparison to the levels of these activities allowed during the corresponding lockdown period), only the state of Florida will experience a second wave. It is further shown that the severity of the projected second waves depend on the level of lifting of the community lockdown. For instance, the projected second wave for Arizona and Florida will be more severe than their respective first waves. It is further shown that, for high level of lifting of community lockdown measures, the increased use of face masks after the lockdown period greatly reduces the burden of the pandemic in each jurisdiction. In particular, for this high lockdown lifting scenario, none of the four jurisdictions will experience a second wave if half of their residents wear face masks consistently after their respective lockdown period. A diagnostic testing strategy that increases the maximum detection rate of asymptomatic infected individuals (followed by contact tracing and self-isolation of the detected cases) greatly reduces the burden of the pandemic in all four jurisdictions, particularly if also combined with a universal face mask use strategy. Finally, it is shown that the universal use of face masks in public, with at least moderate level of compliance, could halt the post-lockdown resurgence of COVID-19, in addition to averting the potential for (and severity of) a second wave of the pandemic in each of the four jurisdictions.
Keywords: Community lockdown lifting; Diagnostic testing and detection contact tracing; Face mask compliance; Mathematical model for COVID-19; Self-isolation.
Copyright © 2020 Elsevier Inc. All rights reserved.
Conflict of interest statement
Declaration of Competing Interest The authors declare that they have no known competing financial interests or personal relationships that could have appeared to influence the work reported in this paper.
Figures
Similar articles
-
Mathematical assessment of the impact of non-pharmaceutical interventions on curtailing the 2019 novel Coronavirus.Math Biosci. 2020 Jul;325:108364. doi: 10.1016/j.mbs.2020.108364. Epub 2020 May 1. Math Biosci. 2020. PMID: 32360770 Free PMC article.
-
Predicting COVID-19 spread in the face of control measures in West Africa.Math Biosci. 2020 Oct;328:108431. doi: 10.1016/j.mbs.2020.108431. Epub 2020 Jul 29. Math Biosci. 2020. PMID: 32738248 Free PMC article.
-
Comprehensive review of mask utility and challenges during the COVID-19 pandemic.Infez Med. 2020 Jun 1;28(suppl 1):57-63. Infez Med. 2020. PMID: 32532940 Review.
-
Initial Assessment of the Impact of the Emergency State Lockdown Measures on the 1st Wave of the COVID-19 Epidemic in Portugal.Acta Med Port. 2020 Nov 2;33(11):733-741. doi: 10.20344/amp.14129. Epub 2020 Nov 2. Acta Med Port. 2020. PMID: 33160423
-
A rapid systematic review of the efficacy of face masks and respirators against coronaviruses and other respiratory transmissible viruses for the community, healthcare workers and sick patients.Int J Nurs Stud. 2020 Aug;108:103629. doi: 10.1016/j.ijnurstu.2020.103629. Epub 2020 Apr 30. Int J Nurs Stud. 2020. PMID: 32512240 Free PMC article.
Cited by
-
Human choice to self-isolate in the face of the COVID-19 pandemic: A game dynamic modelling approach.J Theor Biol. 2021 Jul 21;521:110692. doi: 10.1016/j.jtbi.2021.110692. Epub 2021 Mar 23. J Theor Biol. 2021. PMID: 33771612 Free PMC article.
-
A mechanistic model for airborne and direct human-to-human transmission of COVID-19: effect of mitigation strategies and immigration of infectious persons.Eur Phys J Spec Top. 2022;231(18-20):3371-3389. doi: 10.1140/epjs/s11734-022-00433-9. Epub 2022 Jan 13. Eur Phys J Spec Top. 2022. PMID: 35043076 Free PMC article.
-
Impact of Public Health Education Program on the Novel Coronavirus Outbreak in the United States.Front Public Health. 2021 Mar 15;9:630974. doi: 10.3389/fpubh.2021.630974. eCollection 2021. Front Public Health. 2021. PMID: 33791268 Free PMC article.
-
An estimation of airborne SARS-CoV-2 infection transmission risk in New York City nail salons.Toxicol Ind Health. 2020 Sep;36(9):634-643. doi: 10.1177/0748233720964650. Epub 2020 Oct 21. Toxicol Ind Health. 2020. PMID: 33085569 Free PMC article.
-
Unraveling the dynamics of the Omicron and Delta variants of the 2019 coronavirus in the presence of vaccination, mask usage, and antiviral treatment.Appl Math Model. 2023 Feb;114:447-465. doi: 10.1016/j.apm.2022.09.017. Epub 2022 Sep 30. Appl Math Model. 2023. PMID: 36281307 Free PMC article.
References
-
- World Health Organization Emergencies, preparedness, response. Pneumonia of unknown origin – China. Disease Outbreak News. 2020;(5 January) Online Version, (Accessed 5 March 2020)
-
- World Health Organization C.N. Coronavirus disease (COVID-2019) situation reports. WHO. 2020 Online Version, (Accessed 26 April 2020)
Publication types
MeSH terms
Grants and funding
LinkOut - more resources
Full Text Sources
