. 2020 Aug 20;20(1):310.
doi: 10.1186/s12883-020-01888-w.

Establishment of age group classification for risk stratification in glioma patients

Affiliations

Establishment of age group classification for risk stratification in glioma patients

Zhiying Lin et al. BMC Neurol. .

Abstract

Background: Age is associated with the prognosis of glioma patients, but there is no uniform standard of age-group classification to evaluate the prognosis of glioma patients. In this study, we aimed to establish an age group classification for risk stratification in glioma patients.

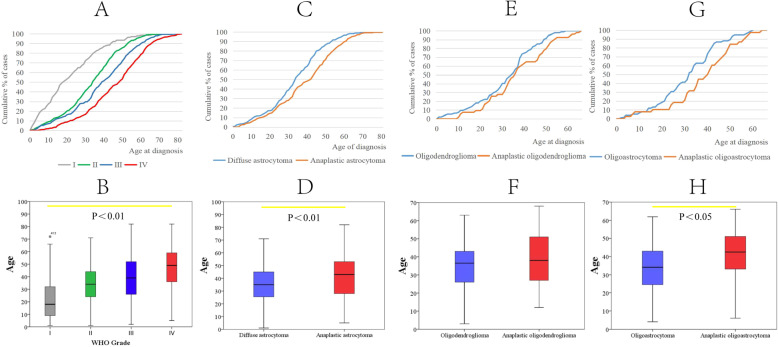
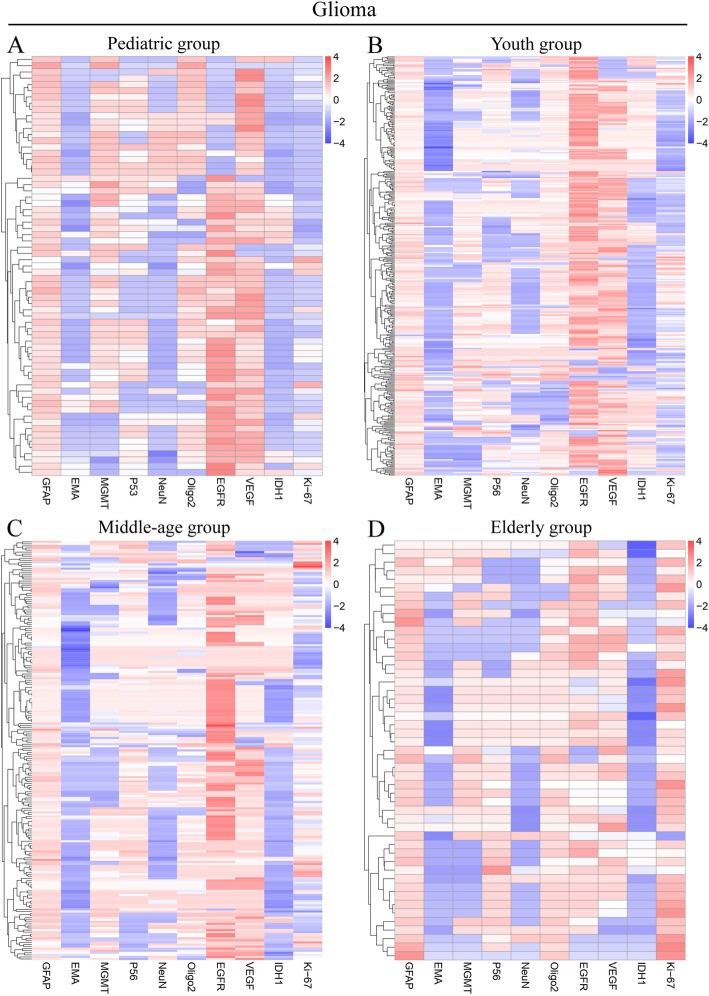
Methods: 1502 patients diagnosed with gliomas at Nanfang Hospital between 2000 and 2018 were enrolled. The WHO grade of glioma was used as a dependent variable to evaluate the effect of age on risk stratification. The evaluation model was established by logistic regression, and the Akaike information criterion (AIC) value of the model was used to determine the optimal cutoff points for age-classification. The differences in gender, WHO grade, pathological subtype, tumor cell differentiation, tumor size, tumor location, and molecular markers between different age groups were analyzed. The molecular markers included GFAP, EMA, MGMT, P53, NeuN, Oligo2, EGFR, VEGF, IDH1, Ki-67, PR, CD3, H3K27M, TS, and 1p/19q status.

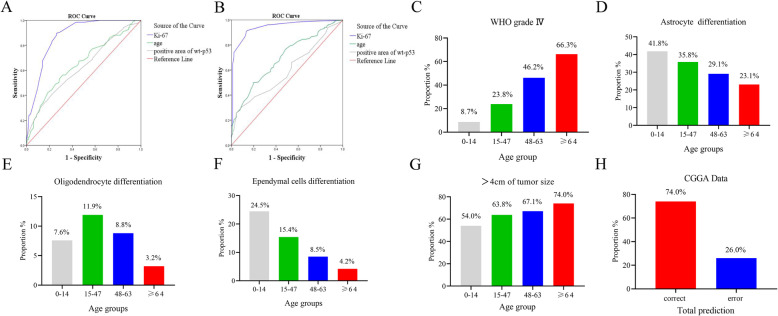
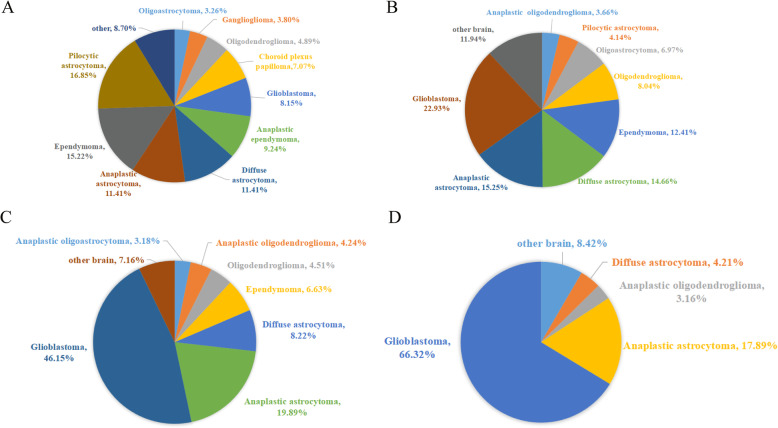
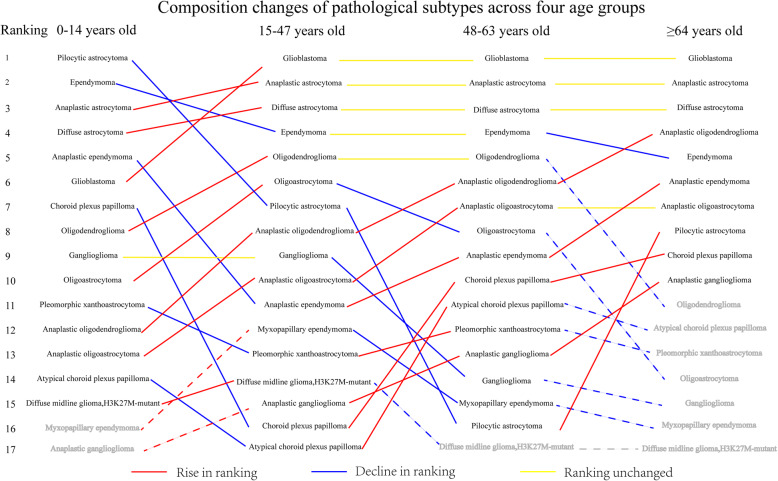
Results: The proportion of men with glioma was higher than that of women with glioma (58.3% vs 41.7%). Analysis of age showed that appropriate classifications of age group were 0-14 years old (pediatric group), 15-47 years old (youth group), 48-63 years old (middle-aged group), and ≥ 64 years old (elderly group).The proportions of glioblastoma and large tumor size (4-6 cm) increased with age (p = 0.000, p = 0.018, respectively). Analysis of the pathological molecular markers across the four age groups showed that the proportion of patients with larger than 10% area of Ki-67 expression or positive PR expression increased with age (p = 0.000, p = 0.017, respectively).

Conclusions: Appropriate classifications of the age group for risk stratification are 0-14 years old (pediatric group), 15-47 years old (young group), 48-63 years old (middle age group) and ≥ 64 years old (elderly group). This age group classification is effective in evaluating the risk of glioblastoma in glioma patients.

Keywords: Age group classification; Glioma; Personalized treatment; Risk stratification.


Conflict of interest statement

The authors declare that they have no competing interests.

Figures

Fig. 1
Fig. 1
Cumulative age distribution and T test of the average age at diagnosis of different types of glioma. a Cumulative age distribution of WHO I-IV grade glioma, the mean age of glioma patients increases with the WHO grade (WHO I: 21.9 years, WHO II: 33.6 years, WHO III: 38.9 years and WHO IV: 46.3 years, respectively). b The diagnosed age boxplot figure of WHO I-IV grade glioma. c Cumulative age distribution of anaplastic astrocytoma and diffuse astrocytoma, there is likely for an earlier manifestation in diffuse astrocytoma. d The average age at diagnosis of anaplastic astrocytoma and diffuse astrocytoma. e Cumulative age distribution of Oligodendroglioma and anaplastic oligodendroglioma, most of oligodendroglioma and anaplastic oligodendroglioma arise in adults, with peak incidence in patients aged 30–50 years. f The diagnosed age boxplot figure of oligodendroglioma and anaplastic oligodendroglioma. g Cumulative age distribution of Oligoastrocytoma and anaplastic oligoastrocytoma, the median ages of patients with oligoastrocytoma are 34.0 years. The median age of patients with anaplastic oligoastrocytoma is 42.5 years. h The diagnosed age boxplot figure of oligoastrocytoma and anaplastic oligoastrocytoma
Fig. 2
Fig. 2
ROC curve of the sensitivity and specificity for diagnosing WHO IV glioma (a) and high grade glioma (b). Age, ki-67 and positive area of wt-p53 have great value for the diagnosis of WHO grade IV glioma and high-grade glioma. The proportion of WHO grade IV glioma (c), astrocyte differentiation (d), oligodendrocyte differentiation (e), ependymal cells differentiation (f) and >4 cm of tumor size (g) in four age groups. According to the discriminant classification of whether the pathological diagnosis of the patients was WHO grade IV or not, the prediction probability was taken as the discriminant dividing point, and the total judgment rate was 74.0% (h)
Fig. 3
Fig. 3
Histological distribution by Age groups. a Histological distribution by 0–14 years old group. b Histological distribution by 15–47 years old group. c Histological distribution by 48–63 years old group, and d Histological distribution by ≥64 years old group. In the 0–15 age group. The proportion of pilocytic astrocytoma in the histological distribution was 16.9%, however, glioblastoma accounted for the largest proportion of the age group 15–48 years old, 48–64 years old and ≥ 64 years old, with 22.9, 46.2 and 66.3% respectively
Fig. 4
Fig. 4
Composition changes of pathological subtypes across four age groups
Fig. 5
Fig. 5
The glioma heatmap of 10-gene signatures by gene expression subtype. Representative genes are shown for each subtype. a Heatmap of pediatric group. b Heatmap of youth group. c Heatmap of middle-age group. d Heatmap of elderly group

References

    1. de Robles P, Fiest KM, Frolkis AD, Pringsheim T, Atta C, St Germaine-Smith C, et al. The worldwide incidence and prevalence of primary brain tumors: a systematic review and meta-analysis. Neuro-Oncology. 2015;17(6):776–783. doi: 10.1093/neuonc/nou283. - DOI - PMC - PubMed
    1. Weller M, Wick W, Aldape K, Brada M, Berger M, Pfister SM, et al. Glioma. Nat Rev Dis Primers. 2015;1:15017. doi: 10.1038/nrdp.2015.17. - DOI - PubMed
    1. Ostrom QT, Gittleman H, Liao P, Vecchione-Koval T, Wolinsky Y, Kruchko C, et al. CBTRUS Statistical Report: Primary brain and other central nervous system tumors diagnosed in the United States in 2010–2014. Neuro Oncol. 2017;19(suppl_5):v1–v88. doi: 10.1093/neuonc/nox158. - DOI - PMC - PubMed
    1. Usinskiene J, Ulyte A, Bjornerud A, Venius J, Katsaros VK, Rynkeviciene R, et al. Optimal differentiation of high- and low-grade glioma and metastasis: a meta-analysis of perfusion, diffusion, and spectroscopy metrics. Neuroradiology. 2016;58(4):339–350. doi: 10.1007/s00234-016-1642-9. - DOI - PubMed
    1. Thakkar JP, Dolecek TA, Horbinski C, Ostrom QT, Lightner DD, Barnholtz-Sloan JS, et al. Epidemiologic and molecular prognostic review of glioblastoma. Cancer Epidemiol Biomark Prev. 2014;23(10):1985–1996. doi: 10.1158/1055-9965.EPI-14-0275. - DOI - PMC - PubMed