. 2020 Aug 20;20(1):784.
doi: 10.1186/s12885-020-07273-7.

Breast cancer mammospheres secrete Adrenomedullin to induce lipolysis and browning of adjacent adipocytes

Affiliations

Breast cancer mammospheres secrete Adrenomedullin to induce lipolysis and browning of adjacent adipocytes

Martin Paré et al. BMC Cancer. .

Abstract

Background: Cancer cells cooperate with cells that compose their environment to promote tumor growth and invasion. Among them, adipocytes provide lipids used as a source of energy by cancer cells and adipokines that contribute to tumor expansion. Mechanisms supporting the dynamic interactions between cancer cells and stromal adipocytes, however, remain unclear.

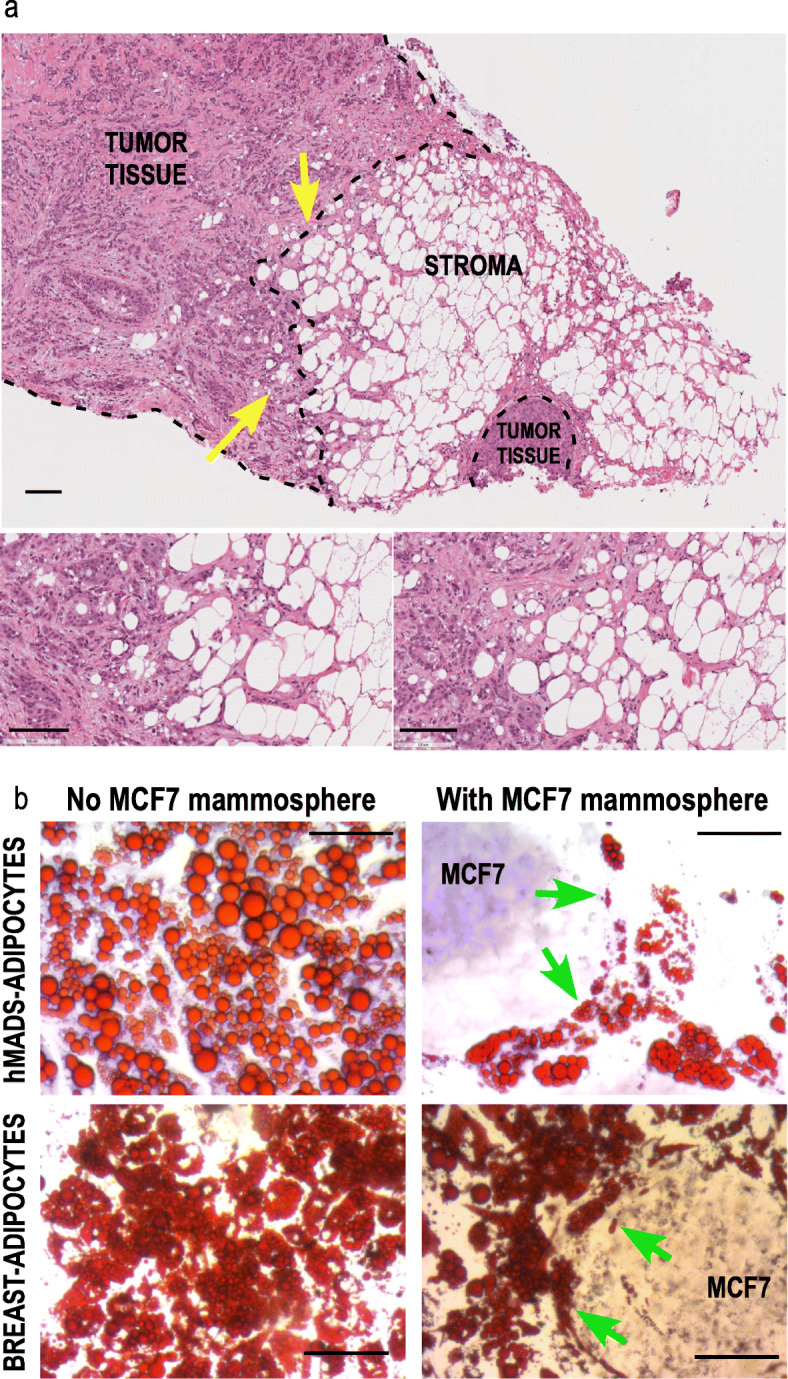
Methods: We set-up a co-culture model with breast cancer cells grown in 3D as mammospheres and human adipocytes to accurately recapitulate intrinsic features of tumors, such as hypoxia and cancer cell-adipocytes interactions.

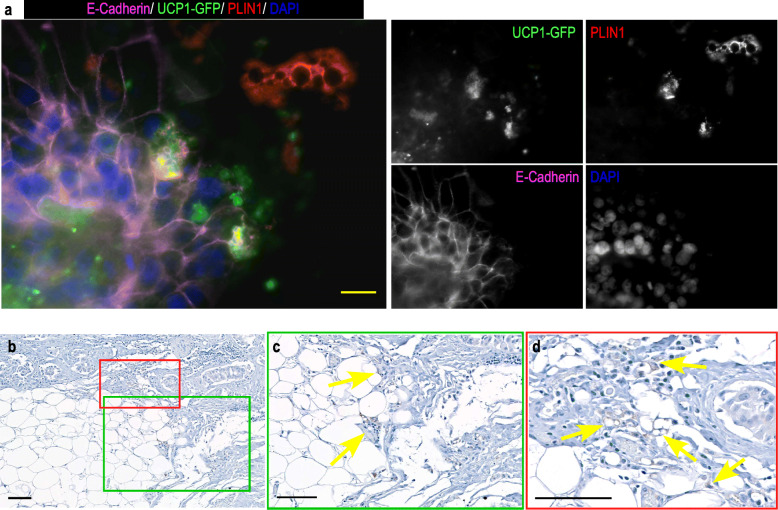
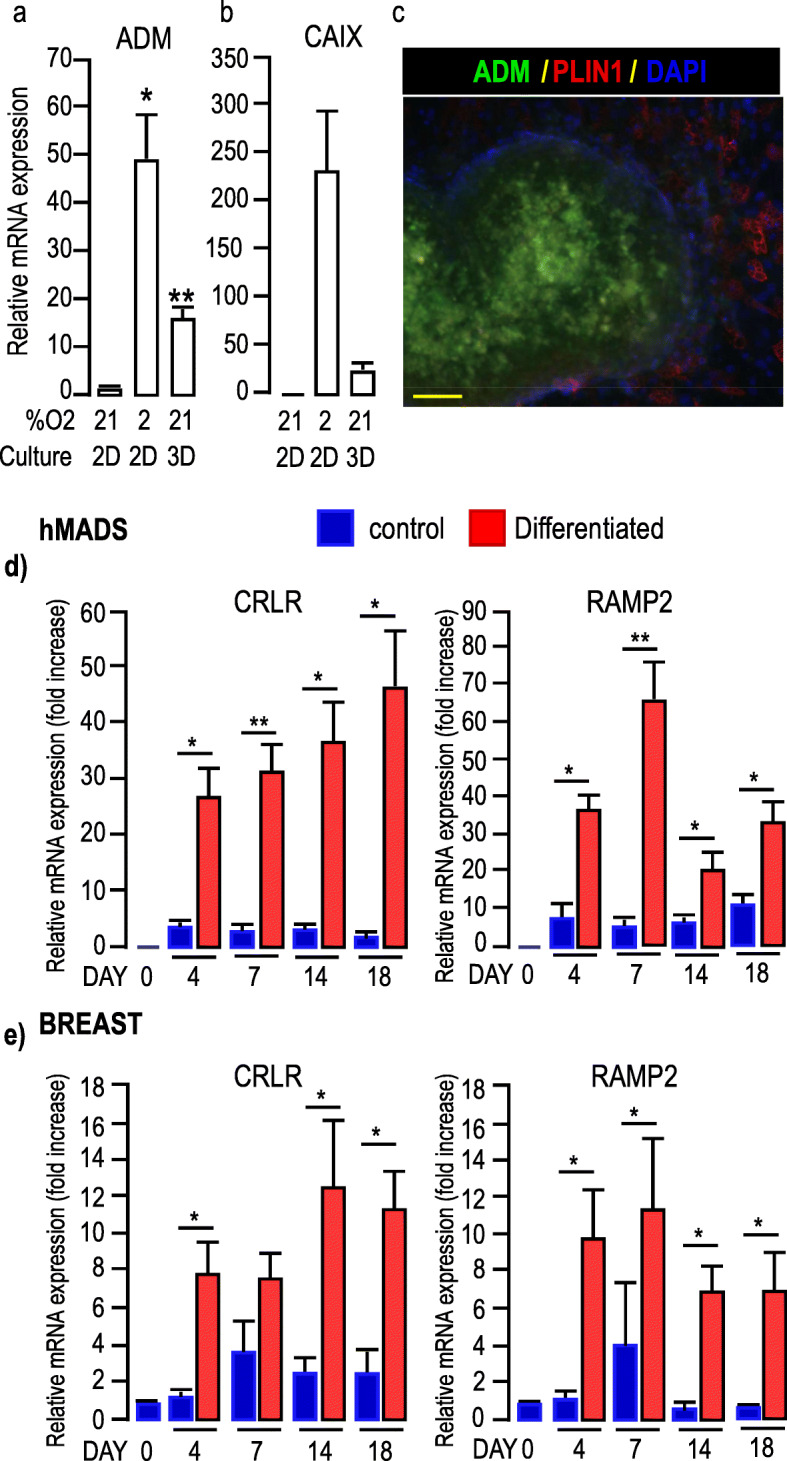
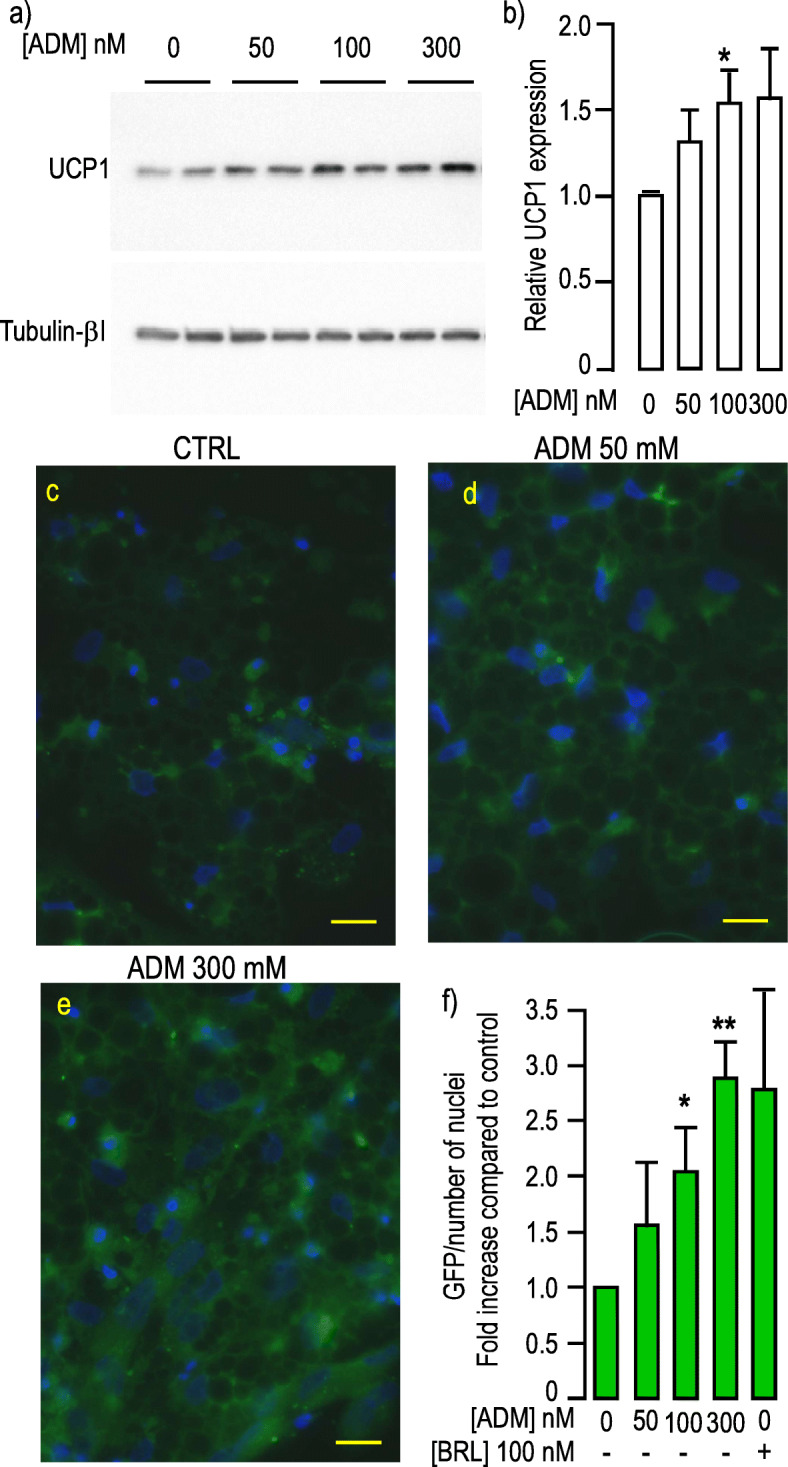
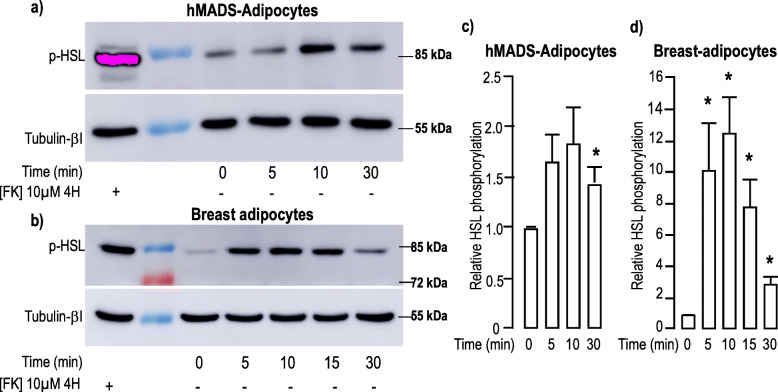
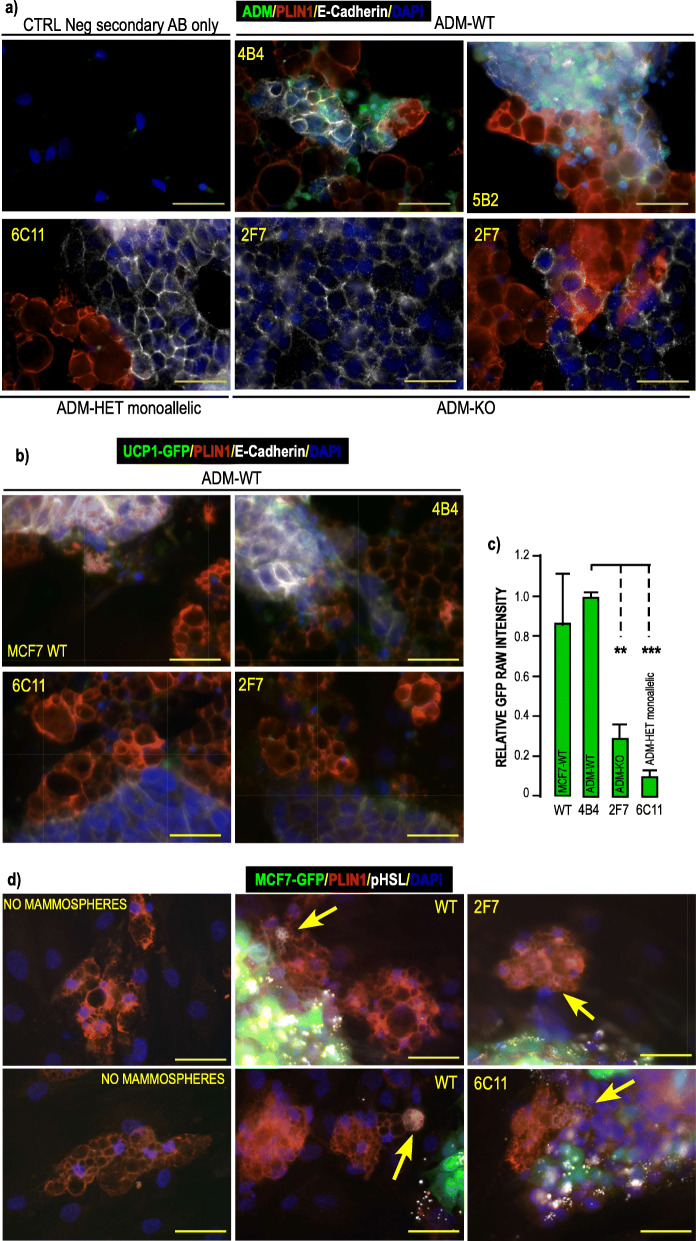
Results: Herein, we observed that the lipid droplets' size was reduced in adipocytes adjacent to the mammospheres, mimicking adipocyte morphology on histological sections. We showed that the uncoupling protein UCP1 was expressed in adipocytes close to tumor cells on breast cancer histological sections as well as in adipocytes in contact with the mammospheres. Mammospheres produced adrenomedullin (ADM), a multifactorial hypoxia-inducible peptide while ADM receptors were detected in adipocytes. Stimulation of adipocytes with ADM promoted UCP1 expression and increased HSL phosphorylation, which activated lipolysis. Invalidation of ADM in breast cancer cells dramatically reduced UCP1 expression in adipocytes.

Conclusions: Breast tumor cells secreted ADM that modified cancer-associated adipocytes through paracrine signaling, leading to metabolic changes and delipidation. Hence, ADM appears to be crucial in controlling the interactions between cancer cells and adipocytes and represents an excellent target to hinder them.

Keywords: Adipocytes; Adrenomedullin; Breast cancer; Browning; Lipolysis; UCP1.


Conflict of interest statement

The authors declare no conflict of interest.

Figures

Fig. 1
Fig. 1
Morphology of adipocytes in contact with tumor cells or close to MCF7 mammospheres. a Histological analysis of human breast tumor section containing adipocytes. Histology of breast tumor sections was revealed by hematoxylin and eosin staining. Adipocytes with small lipid droplets (yellow arrows) are preferentially observed close to the tumor cells, while those which are more distal display larger lipid droplets. (scale bar 100 μm). The two insets correspond higher magnification view of the zones indicated by the arrows. b hMADS-adipocytes or breast-adipocytes were cultured in differentiation medium for 15 days. MCF7 cells were grown as mammospheres for 7 days. Co-culture of the 2 cell-types was performed for 2 days. Oil-Red O staining reveals that the size of the lipid droplets is heterogeneous, although smaller in adipocytes adjacent to the mammospheres (green arrows). Crystal violet was used to counterstain the MCF7 cells in presence of hMADS-adipocytes. Magnification X20, scale bar 100 μM
Fig. 2
Fig. 2
UCP1 expression in adipocytes close to tumor cells. a / MCF7 cells were grown as mammospheres for 7 days. They were co-cultured on a monolayer of hMADS cells expressing GFP under the control of UCP1 promoter which had been differentiated for 14 days. Co-culture of the 2 cell types lasted for 4 days. PLIN1 (red, labelling the lipid droplets) and E-Cadherin (pink, labelling the MCF7 mammospheres) expressions were visualized using specific antibodies. GFP expression was visualized in green. DAPI was used to label the nuclei (Blue). The fluorescence recorded for each channel is shown in separated images. The adipocytes adjacent to the mammospheres express both GFP and PLIN1, while those more distant from the mammospheres express PLIN1 only. Magnification 40X, scale bar 20 μM. b, and insets c & d UCP1 expression in patient breast tumor sections was detected using immunohistochemical labeling with anti-UCP1 antibody (arrows). The immunostains are shown in brown. Red and green frames are used to localize UCP1 expression in the section. Magnification 10X (b), 20X (c) & 40X (d), scale bar 100 μM
Fig. 3
Fig. 3
Expression of ADM in MCF7 cells and ADM receptors in adipocytes. a-b, Expression of ADM and CA IX in MCF7 cells cultured in different conditions. Expression of ADM and CA IX was assessed by real-time RT-PCR and normalized for the expression of 36B4 mRNA. Expression was measured in cells grown as 2D monolayers in the presence of 21 or 2% O2 for 48 h or as mammospheres for 7 days. The means ± SEM were calculated from three independent experiments, with determinations performed in duplicate (*p < 0.05, ** p < 0.01). c, Expression of ADM in mammospheres. MCF7 cells were grown as mammospheres for 7 days. Expressions of ADM (green) and PLIN1 (red, to label adipocytes) are shown. DAPI was used to label the nuclei (Blue). The fluorescence recorded for each channel is shown in separated images (see Supp. Figure 3). Note that ADM was not expressed in adipocytes, but in mammospheres. Scale bar: 50 μm. d-e ADM receptors expression in hMADS (d) and breast-adipocytes (e). Time course for the expression of CRLR and RAMP2, was assessed by real-time RT-PCR and normalized to the expression of 36B4 mRNA. Expressions were measured in cells that received (red bars) or did not receive (blue bars) the differentiation cocktail for the indicated number of days. The means ± SEM were calculated from three independent experiments, with determinations performed in duplicate (*p < 0.05, ** p < 0.01)
Fig. 4
Fig. 4
ADM induced UCP1 expression. a, ADM induced UCP1 in a dose dependent manner. Protein expression was measured in hMADS-adipocytes grown in differentiation medium for 17 days. They were stimulated by increasing doses of ADM for 24 h. Expressions of UCP1 (upper panel) and Tubulin-βI (lower panel) used as a loading control were analyzed by Western blot using specific antibodies. Representative Western blots are shown. Full-length blots are presented in Supplementary Figure 9. b, Quantification of the signals. Protein expression was quantified using Quantity One Program and compared to the expression of Tubulin-βI. The means ± SEM were calculated from four independent experiments (*p < 0.05). c-e, Transcriptional activation of UCP1 promoter in response ADM. GFP expression was driven by the human UCP1 promoter in hMADS cells differentiated for 14 days. GFP fluorescence was determined after 4 more days of incubation with the indicated concentration of ADM. Control condition corresponds to cells that did not receive ADM. All images were recorded with the very same parameters. (Scale bar: 20 μM). f, Quantification of the signals. Means were calculated from 3 independent experiments performed in duplicate on at least 6 distinct recordings for each coverslip. The fluorescence signal measured as “raw integrated density” was divided by the number of nuclei present in the microscopic field. Rosiglitazone (BRL) was used as a positive inducer of browning. (*p < 0.05, **p < 0.01)
Fig. 5
Fig. 5
ADM induced phosphorylation of HSL. a-b, ADM increased phosphorylation of HSL. Protein expression and phosphorylation were measured in hMADS-adipocytes (panel a) or breast adipocytes (panel b) grown in the differentiation medium. They were stimulated with 100 nM ADM for the indicated time. Expressions of pHSL (upper panel) and Tubulin-βI (lower panel) used as a loading control were analyzed by Western blot using specific antibodies. A positive control condition with cells stimulated for 4 h with forskolin is shown. Representative Western blots are shown. Full-length blots are presented in Supplementary Figure 9. c-d, Quantification of the signals. Expression and phosphorylation of the proteins were quantified using the Quantity One Program and compared to the expression of Tubulin-βI. The means ± SEM were calculated from four independent experiments. (*p < 0.05)
Fig. 6
Fig. 6
Analysis of ADM mutated clones obtained by CRISPR Cas9 technology. a ADM expression in mutated clones obtained by CRISPR Cas9 technology. WT MCF7, ADM-Het and ADM-KO MCF7 cells were grown as mammospheres for 7 days. They were co-cultured on a monolayer of hMADS cells that had been differentiated for 14 days. Co culture of the 2 cell types lasted for 4 days. ADM (green) PLIN1 (red) and E-Cadherin (white) expressions were visualized using specific antibodies. DAPI was used to label the nuclei (Blue). Images were recorded using the very same settings for ADM signal (i.e. 300 m seconds.). Magnification 40X, scale bar 50 μM. b ADM mutated clones are less efficient at inducing UCP1 expression in hMADS- adipocytes. WT-MCF7, ADM-Het and ADM-KO MCF7 cells were grown as mammospheres for 7 days. They were co-cultured for 4 days on a monolayer of hMADS cells expressing GFP under control of the UCP1 promoter that had been differentiated for 14 days. PLIN1 (red) and E-Cadherin (white) expressions were visualized using specific antibodies. GFP expression was visualized in green. DAPI was used to label the nuclei (Blue). Images were recorded using the very same settings. Magnification 40X, scale bar 50 μM. GFP signals were quantified using ImageJ software and compared to signals obtained in the presence of the WT MCF7 cells. c Quantification of the signals. Means were calculated from 3 independent experiments performed in duplicate on at least 3 distinct recordings for each coverslip. The fluorescence signal measured as “raw integrated density” and compared to the signal obtained with WT-MCF7 cells. (**p < 0.01, ***p < 0.001). d) ADM mutated clones induced HSL phosphorylation in hMADS- adipocytes. WT MCF7, ADM-Het and ADM-KO MCF7 expressing GFP cells were grown as mammospheres for 7 days. They were co-cultured for 3 days on a monolayer of breast adipocytes that had been differentiated for 21 days. PLIN1 (red) and pHSL (white) expressions were visualized using specific antibodies. GFP expression was visualized in green. DAPI was used to label the nuclei (Blue). Images were recorded using the very same settings. Arrows indicate pHSL labelling in cells expressing PLIN1. Magnification 40X, scale bar 50 μM. Single channels pictures are presented in supplementary figure 8

Similar articles

Cited by

References

    1. Ruffell B, Affara NI, Coussens LM. Differential macrophage programming in the tumor microenvironment. Trends Immunol. 2012;33(3):119–126. - PMC - PubMed
    1. Tao L, Huang G, Song H, Chen Y, Chen L. Cancer associated fibroblasts: an essential role in the tumor microenvironment. Oncol Lett. 2017;14(3):2611–2620. - PMC - PubMed
    1. Lengyel E, Makowski L, DiGiovanni J, Kolonin MG. Cancer as a matter of fat: the crosstalk between adipose tissue and tumors. Trends Cancer. 2018;4(5):374–384. - PMC - PubMed
    1. Tan J, Buache E, Chenard MP, Dali-Youcef N, Rio MC. Adipocyte is a non-trivial, dynamic partner of breast cancer cells. Int J Dev Biol. 2011;55(7–9):851–859. - PubMed
    1. Duong MN, Geneste A, Fallone F, Li X, Dumontet C, Muller C. The fat and the bad: mature adipocytes, key actors in tumor progression and resistance. Oncotarget. 2017;8(34):57622–57641. - PMC - PubMed