

Patterning Chronic Active Demyelination in Slowly Expanding/Evolving White Matter MS Lesions
- PMID: 32819894
- PMCID: PMC7583098
- DOI: 10.3174/ajnr.A6742
Patterning Chronic Active Demyelination in Slowly Expanding/Evolving White Matter MS Lesions
Abstract
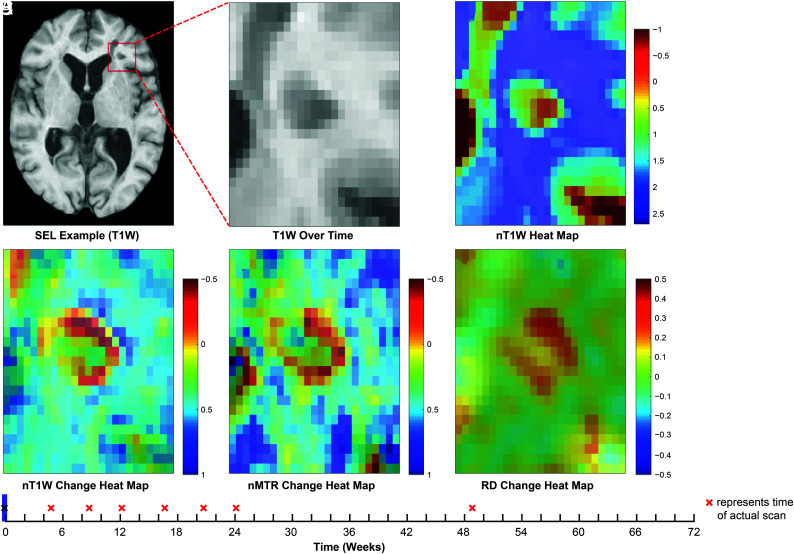
Background and purpose: Slowly expanding/evolving lesions measured by conventional T1-weighted/T2-weighted brain MR imaging may contribute to progressive disability accumulation in MS. We evaluated the longitudinal change in myelin and axonal tissue integrity in white matter slowly expanding/evolving lesions by means of the magnetization transfer ratio and DTI radial diffusivity.
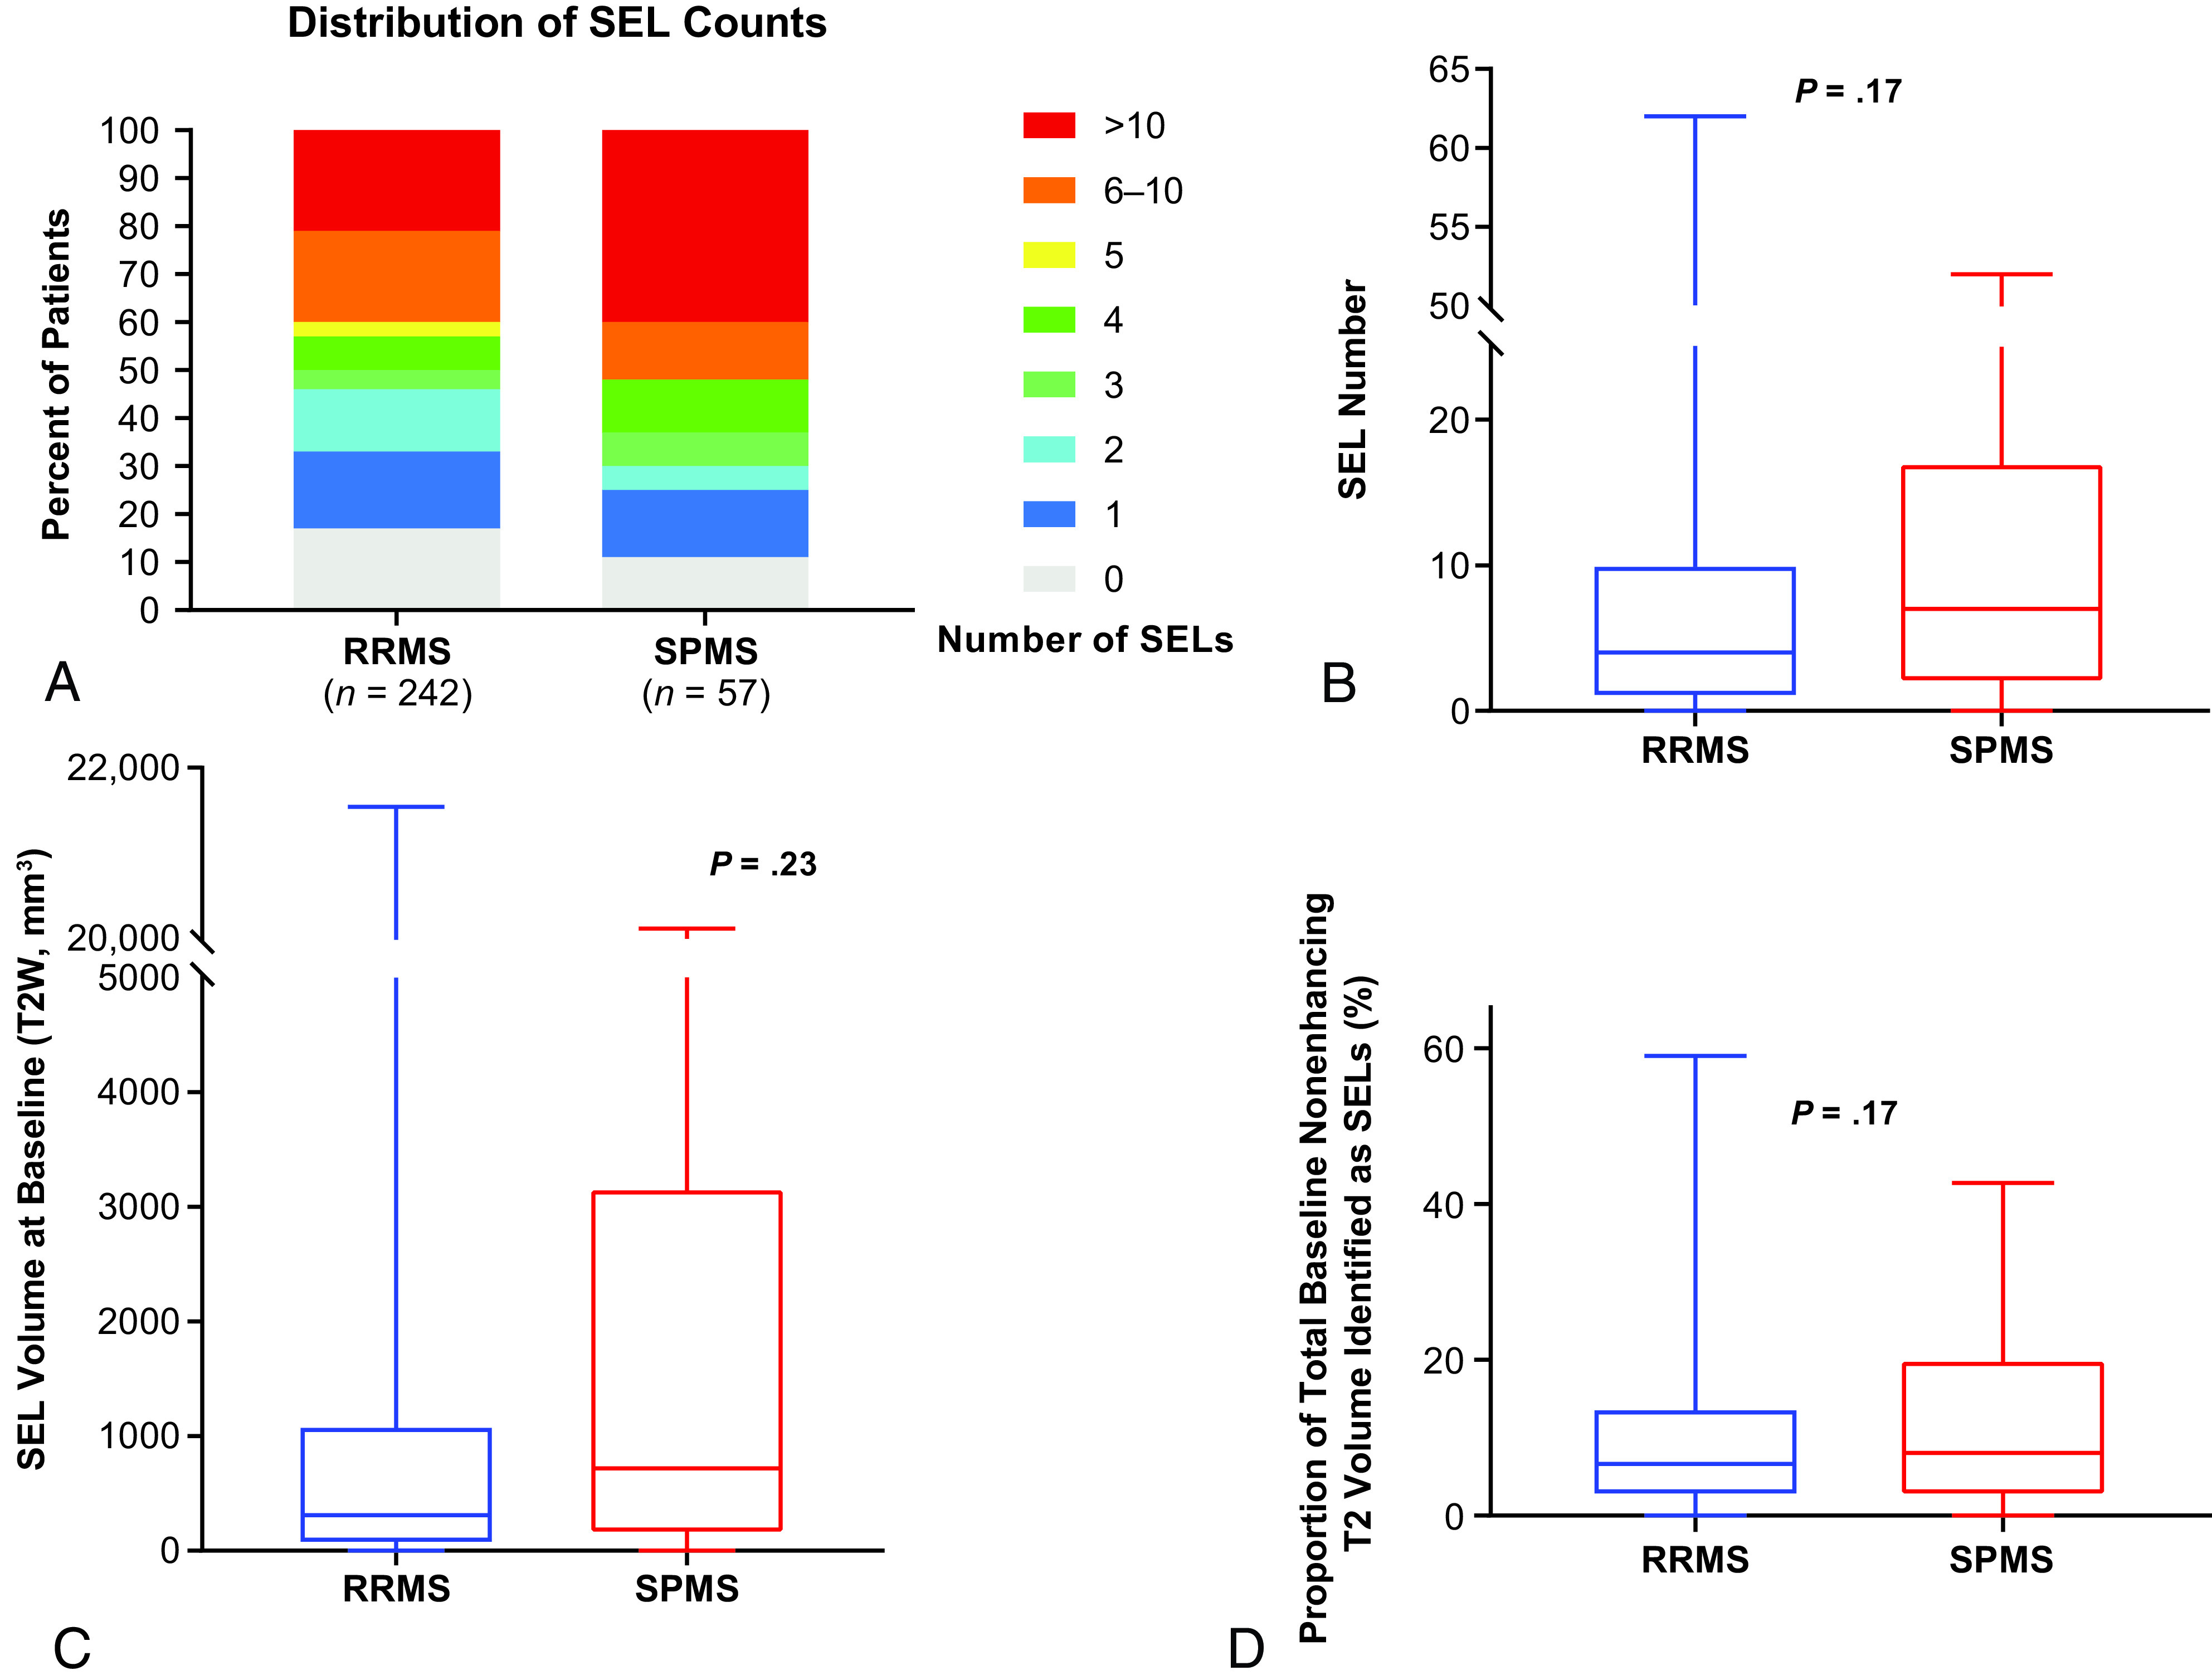
Materials and methods: Slowly expanding/evolving lesions were detected within the Study to Assess the Efficacy, Safety, Tolerability, and Pharmacokinetics of BIIB033 in Participants With Relapsing Forms of Multiple Sclerosis When Used Concurrently With Avonex (SYNERGY) Phase 2 clinical trial dataset (NCT01864148), comprising patients with relapsing-remitting and secondary-progressive MS (n = 299) with T1-weighted/T2-weighted MR imaging at all trial time points (baseline to week 72).
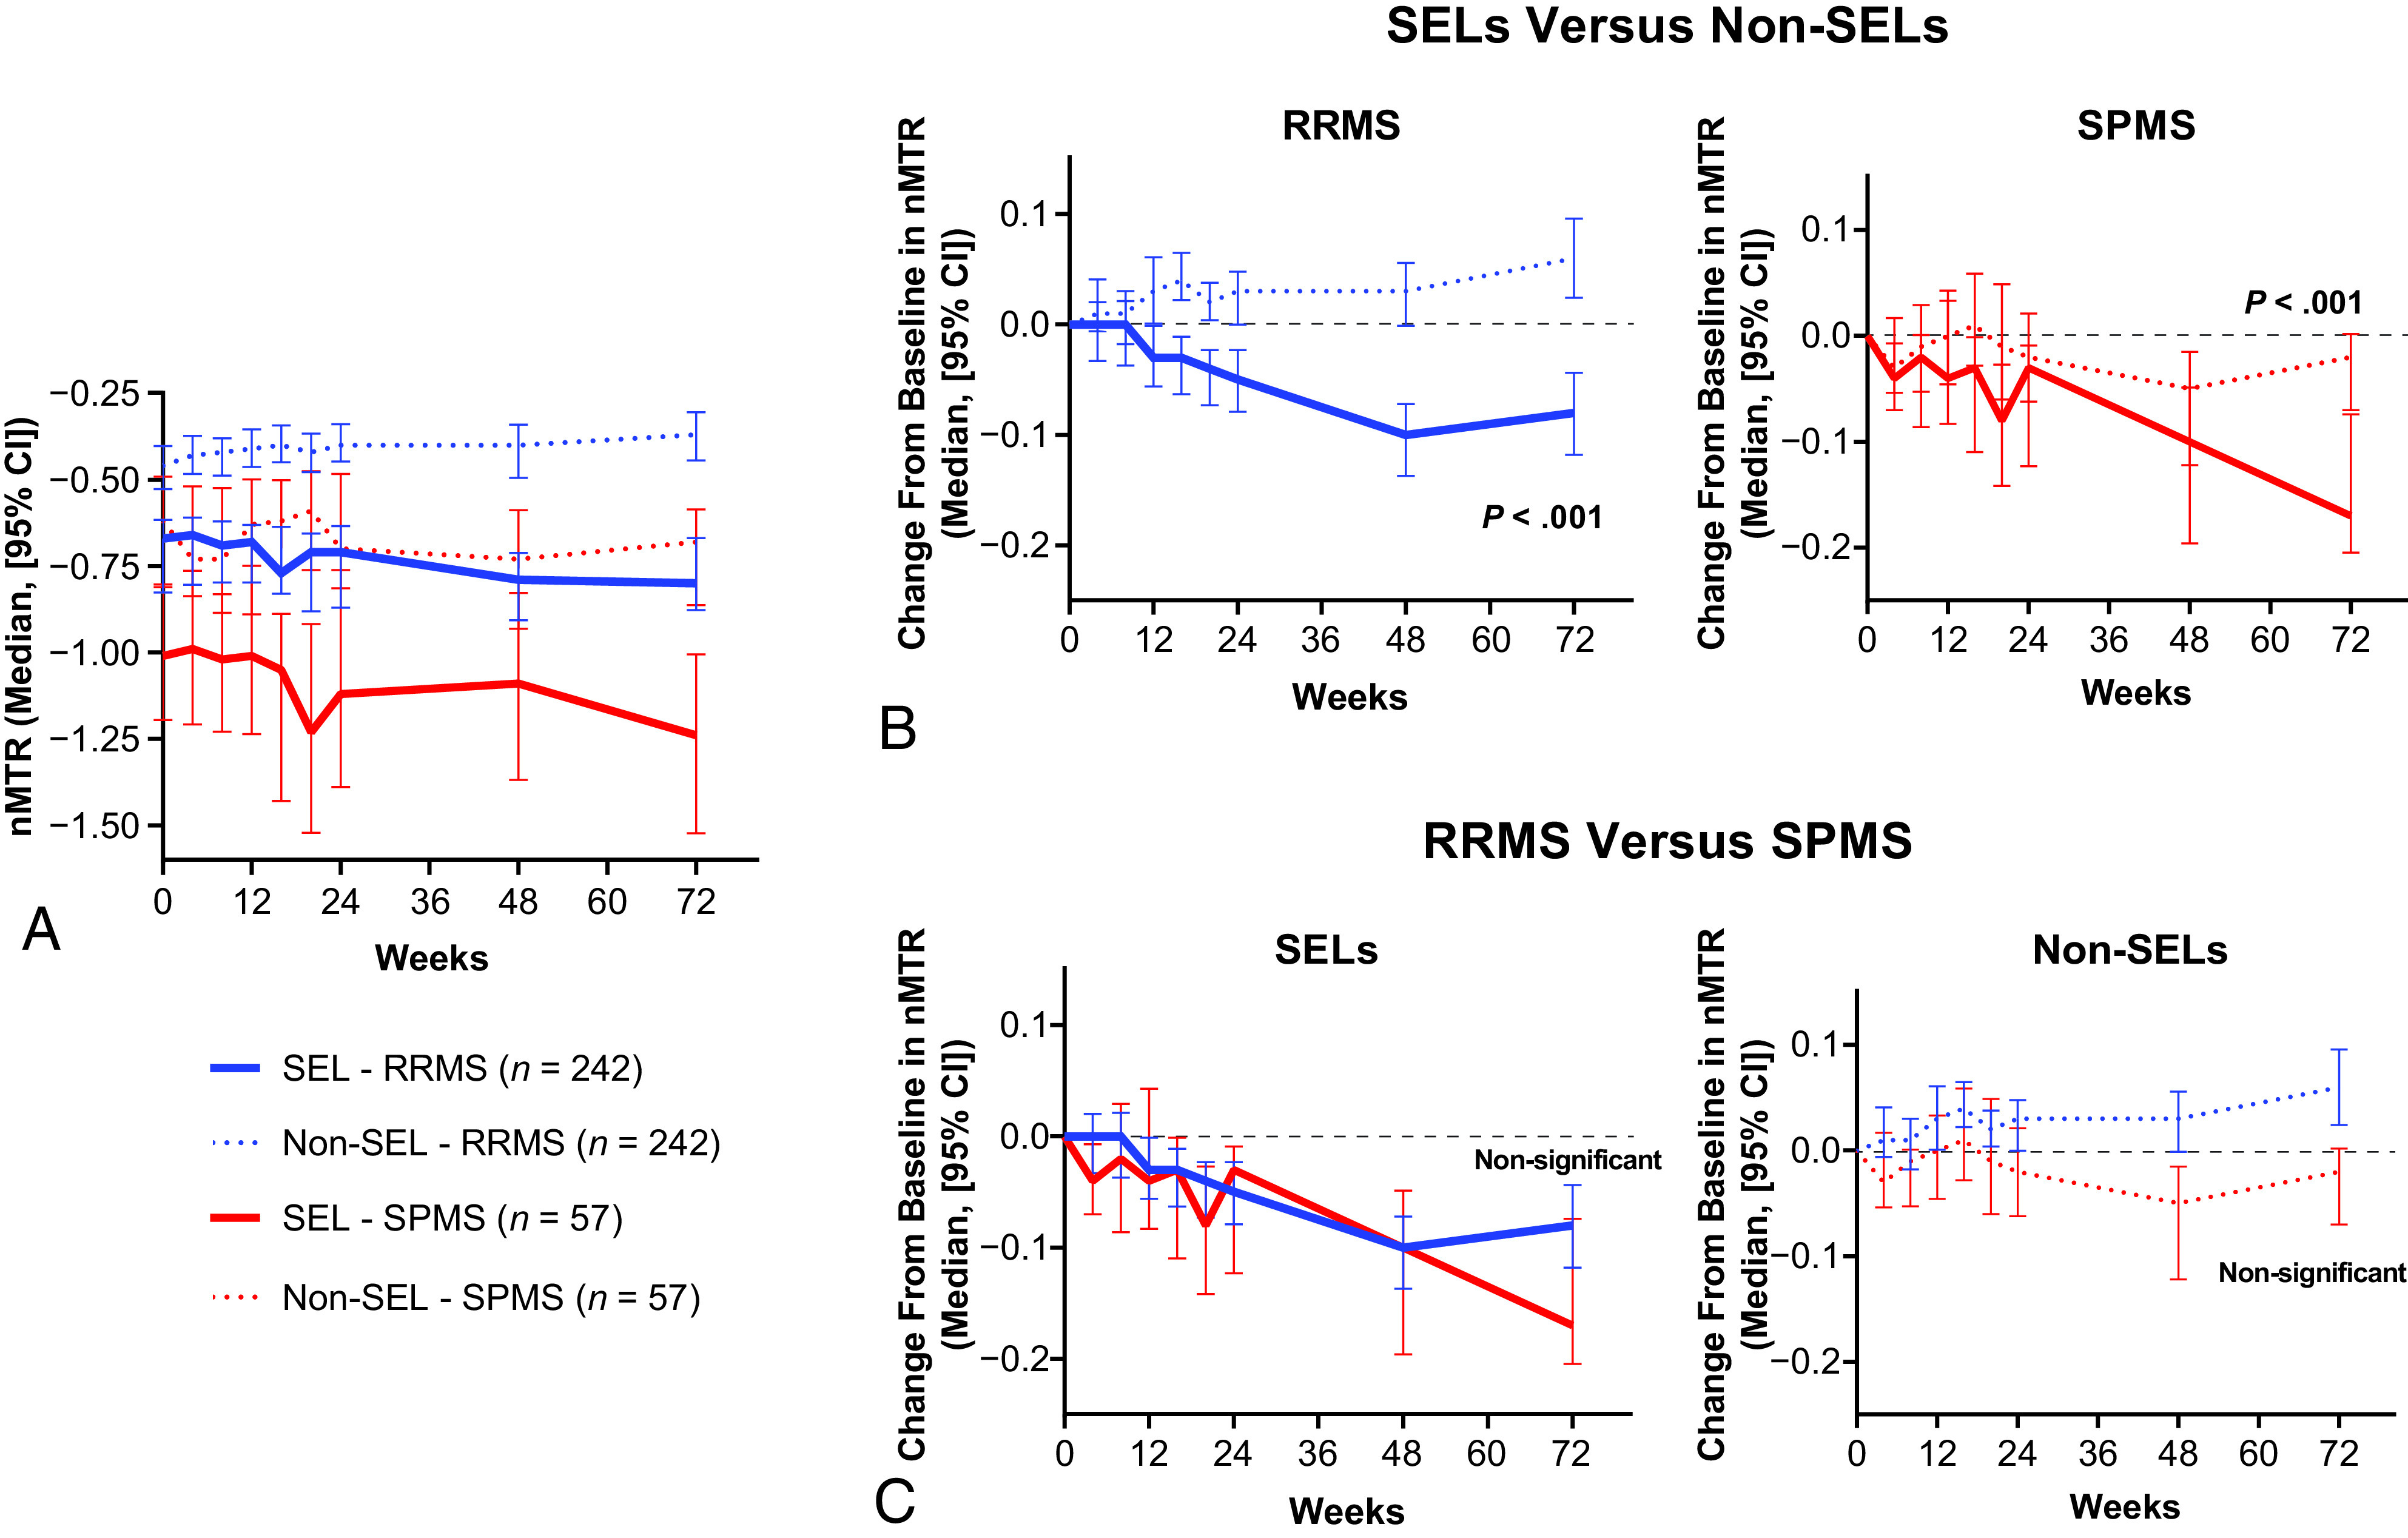
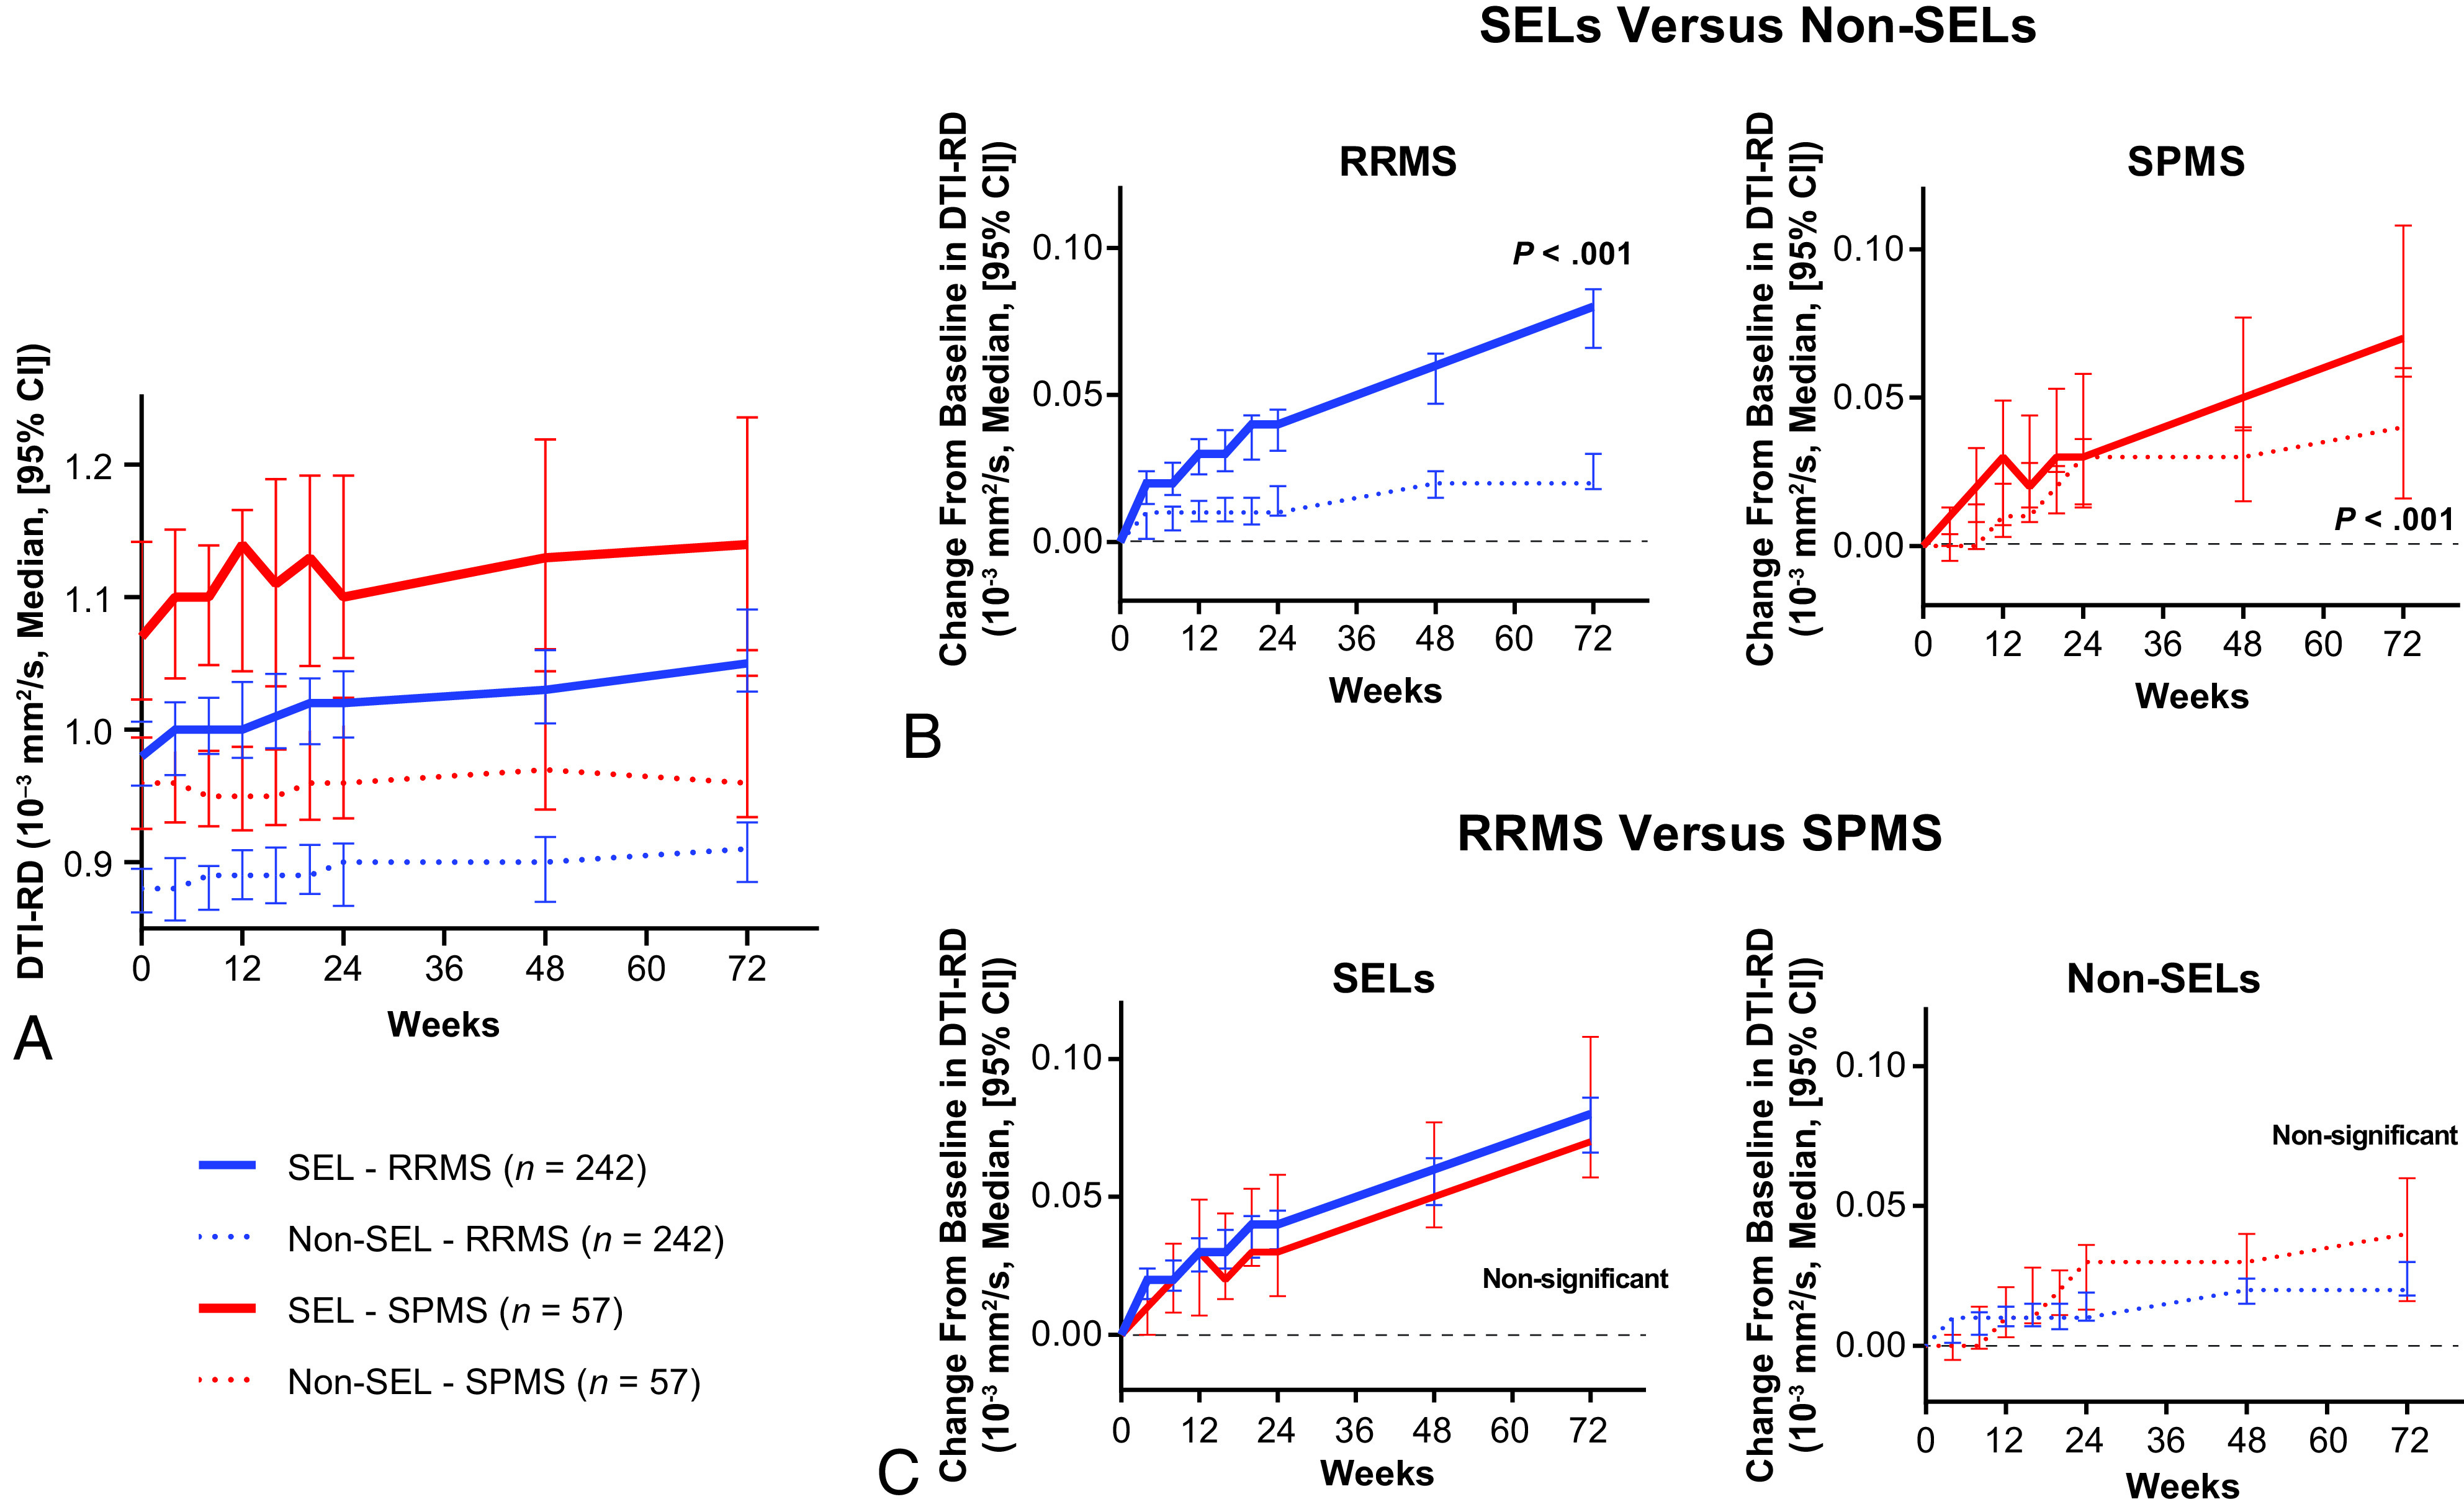
Results: Compared with non-slowly expanding/evolving lesions (areas not classified as slowly expanding/evolving lesion) of baseline nonenhancing T2 lesions, slowly expanding/evolving lesions had a lower normalized magnetization transfer ratio and greater DTI radial diffusivity, both in patients with relapsing-remitting MS (n = 242) and secondary-progressive MS (n = 57, P < .001 for all). Although the changes with time in both the normalized magnetization transfer ratio and DTI radial diffusivity between slowly expanding/evolving lesions and non-slowly expanding/evolving lesions were positively correlated (P < .001), a decrease in the normalized magnetization transfer ratio and a greater increase in DTI radial diffusivity were observed in slowly expanding/evolving lesions versus non-slowly expanding/evolving lesions from baseline to week 72 in relapsing-remitting MS and secondary-progressive MS (P < .001 for all).
Conclusions: Patterns of longitudinal change in the normalized magnetization transfer ratio and DTI radial diffusivity in slowly expanding/evolving lesions were consistent with progressive demyelination and tissue loss, as seen in smoldering white matter MS plaques.
© 2020 by American Journal of Neuroradiology.
Figures
Similar articles
-
Chronic white matter lesion activity predicts clinical progression in primary progressive multiple sclerosis.Brain. 2019 Sep 1;142(9):2787-2799. doi: 10.1093/brain/awz212. Brain. 2019. PMID: 31497864 Free PMC article. Clinical Trial.
-
Presence of slowly expanding lesions in multiple sclerosis predicts progressive demyelination within lesions and normal-appearing tissue over time.Mult Scler. 2025 Apr;31(4):418-432. doi: 10.1177/13524585251316519. Epub 2025 Feb 14. Mult Scler. 2025. PMID: 39950257 Free PMC article.
-
Slowly expanding/evolving lesions as a magnetic resonance imaging marker of chronic active multiple sclerosis lesions.Mult Scler. 2019 Dec;25(14):1915-1925. doi: 10.1177/1352458518814117. Epub 2018 Dec 19. Mult Scler. 2019. PMID: 30566027 Free PMC article.
-
Characterization of tissue damage in multiple sclerosis by nuclear magnetic resonance.Philos Trans R Soc Lond B Biol Sci. 1999 Oct 29;354(1390):1675-86. doi: 10.1098/rstb.1999.0511. Philos Trans R Soc Lond B Biol Sci. 1999. PMID: 10603619 Free PMC article. Review.
-
Correlations between postmortem quantitative MRI parameters and demyelination, axonal loss and gliosis in multiple sclerosis: A systematic review and meta-analysis.Brain Imaging Behav. 2025 Apr;19(2):323-335. doi: 10.1007/s11682-025-00971-5. Epub 2025 Jan 27. Brain Imaging Behav. 2025. PMID: 39871045
Cited by
-
Unmasking paramagnetic rim multiple sclerosis lesions: the advantages of quantitative susceptibility mapping over phase imaging.Brain Commun. 2025 Jan 27;7(1):fcaf037. doi: 10.1093/braincomms/fcaf037. eCollection 2025. Brain Commun. 2025. PMID: 39916750 Free PMC article.
-
Myelin water imaging in relapsing multiple sclerosis treated with ocrelizumab and interferon beta-1a.Neuroimage Clin. 2022;35:103109. doi: 10.1016/j.nicl.2022.103109. Epub 2022 Jul 19. Neuroimage Clin. 2022. PMID: 35878575 Free PMC article. Clinical Trial.
-
Treatment reduces the incidence of newly appearing multiple sclerosis lesions evolving into chronic active, slowly expanding lesions: A retrospective analysis.Eur J Neurol. 2024 Jan;31(1):e16092. doi: 10.1111/ene.16092. Epub 2023 Oct 12. Eur J Neurol. 2024. PMID: 37823722 Free PMC article.
-
Implications of immunometabolism for smouldering MS pathology and therapy.Nat Rev Neurol. 2023 Aug;19(8):477-488. doi: 10.1038/s41582-023-00839-6. Epub 2023 Jul 10. Nat Rev Neurol. 2023. PMID: 37430070 Review.
-
Magnetic Resonance Imaging in Primary Progressive Multiple Sclerosis Patients : Review.Clin Neuroradiol. 2022 Sep;32(3):625-641. doi: 10.1007/s00062-022-01144-3. Epub 2022 Mar 8. Clin Neuroradiol. 2022. PMID: 35258820 Free PMC article. Review.
References
Publication types
MeSH terms
Substances
LinkOut - more resources
Full Text Sources
Other Literature Sources
Medical