. 2020 Dec;26(12):1815-1837.
doi: 10.1261/rna.077099.120. Epub 2020 Aug 20.

Phosphodiester modifications in mRNA poly(A) tail prevent deadenylation without compromising protein expression

Affiliations

Phosphodiester modifications in mRNA poly(A) tail prevent deadenylation without compromising protein expression

Dominika Strzelecka et al. RNA. 2020 Dec.

Abstract

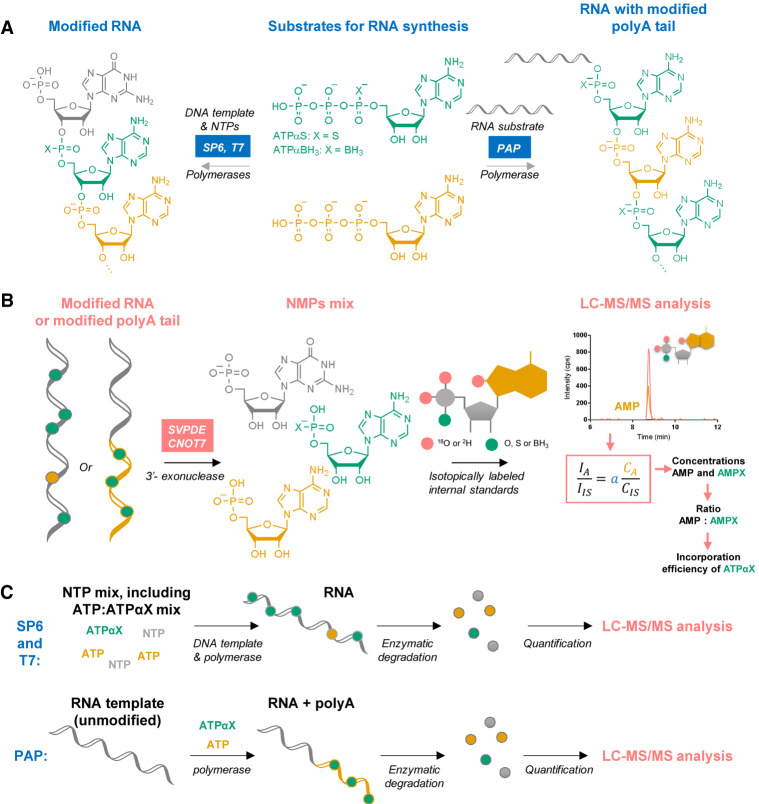
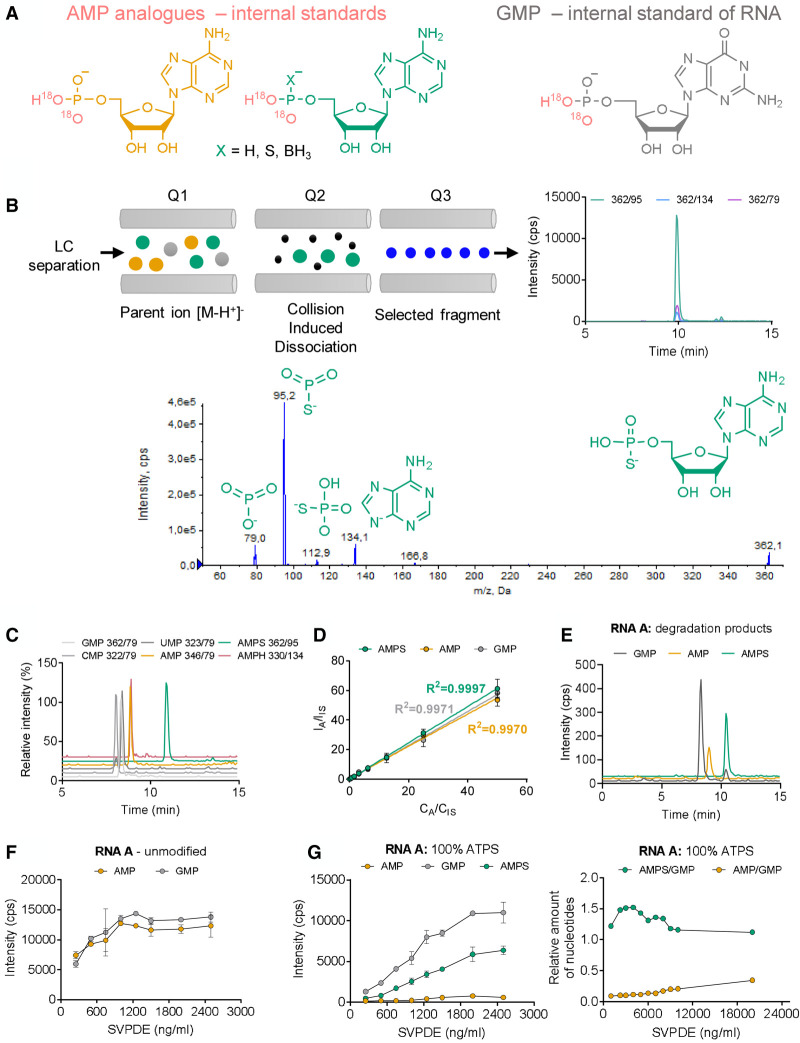
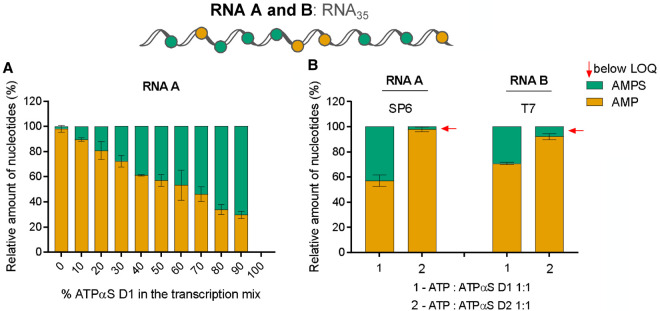
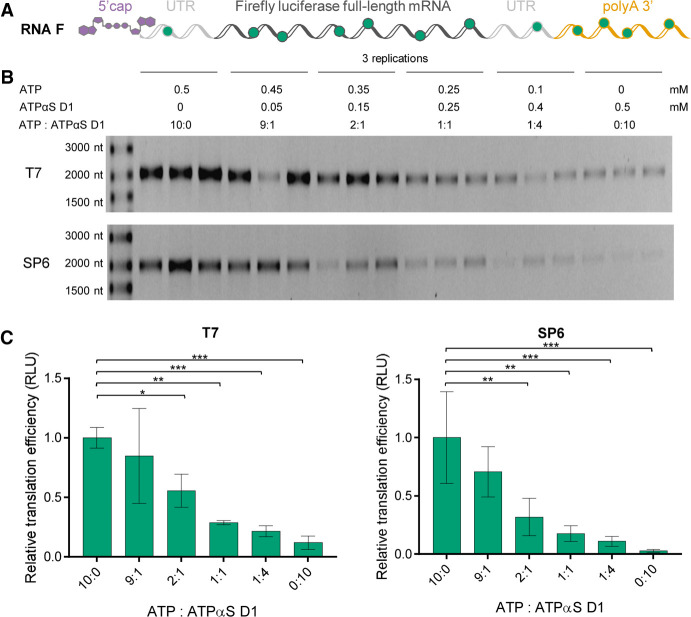
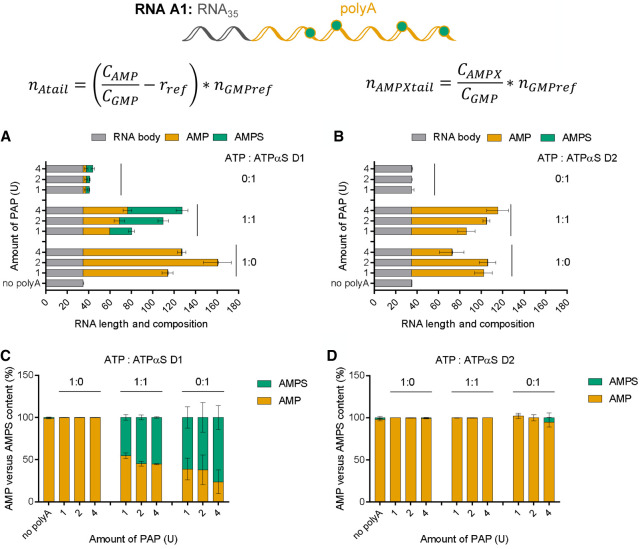
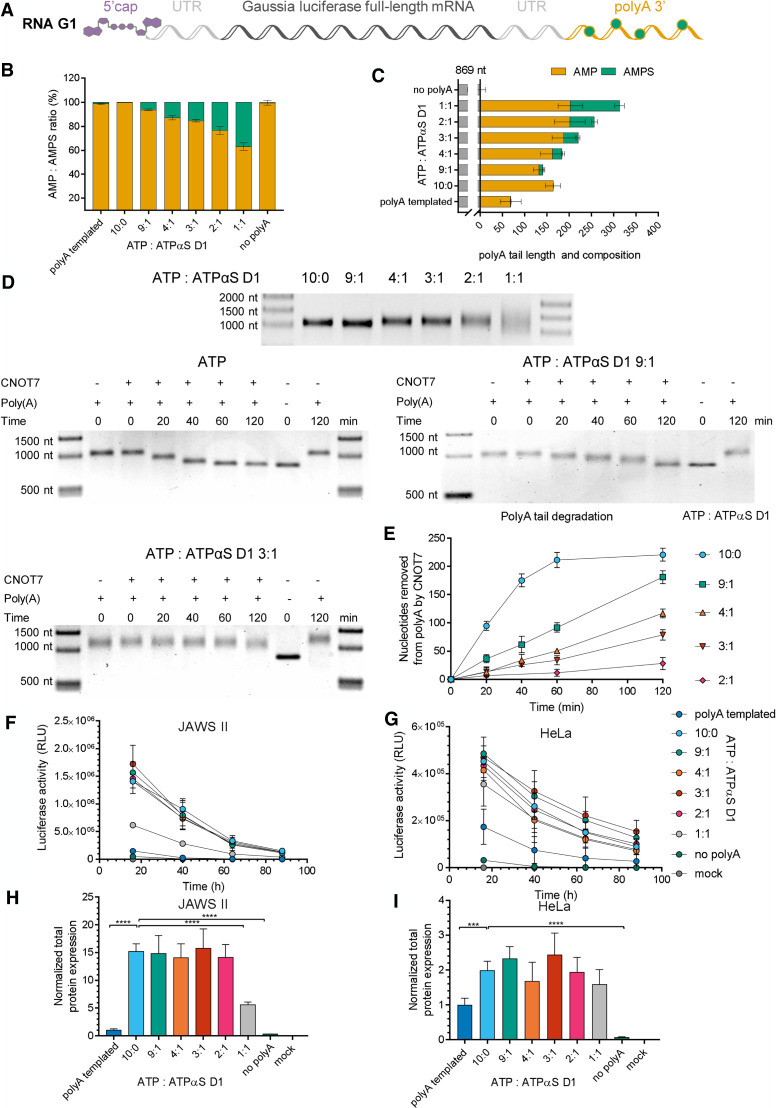
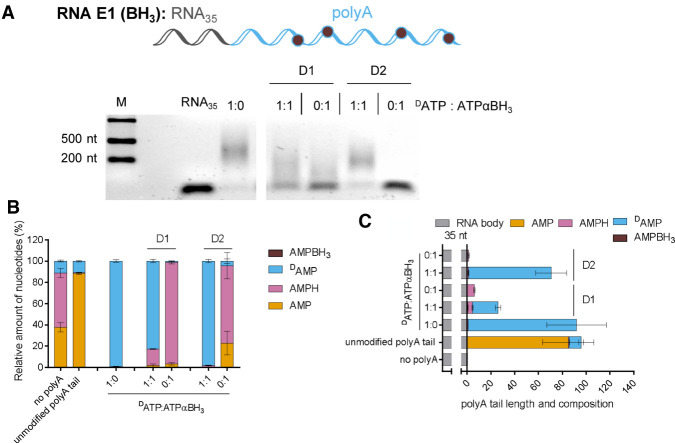
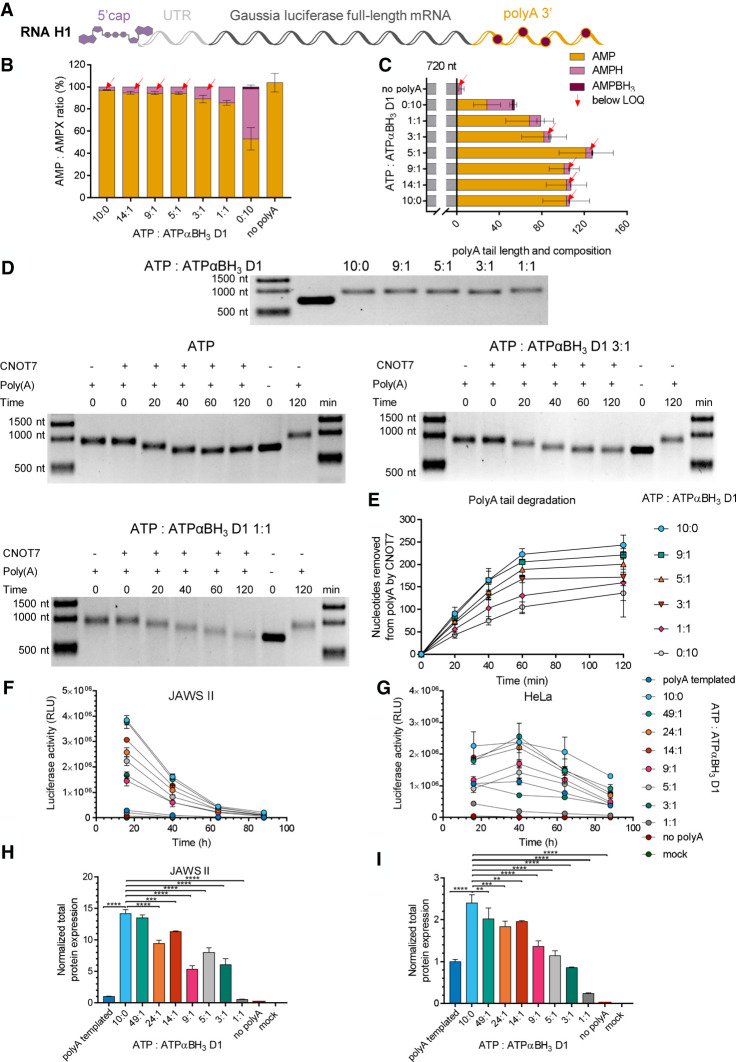
Chemical modifications enable preparation of mRNAs with augmented stability and translational activity. In this study, we explored how chemical modifications of 5',3'-phosphodiester bonds in the mRNA body and poly(A) tail influence the biological properties of eukaryotic mRNA. To obtain modified and unmodified in vitro transcribed mRNAs, we used ATP and ATP analogs modified at the α-phosphate (containing either O-to-S or O-to-BH3 substitutions) and three different RNA polymerases-SP6, T7, and poly(A) polymerase. To verify the efficiency of incorporation of ATP analogs in the presence of ATP, we developed a liquid chromatography-tandem mass spectrometry (LC-MS/MS) method for quantitative assessment of modification frequency based on exhaustive degradation of the transcripts to 5'-mononucleotides. The method also estimated the average poly(A) tail lengths, thereby providing a versatile tool for establishing a structure-biological property relationship for mRNA. We found that mRNAs containing phosphorothioate groups within the poly(A) tail were substantially less susceptible to degradation by 3'-deadenylase than unmodified mRNA and were efficiently expressed in cultured cells, which makes them useful research tools and potential candidates for future development of mRNA-based therapeutics.

Keywords: deadenylation; mRNA modification; resistance; transcription; translation.


Figures

FIGURE 1.
FIGURE 1.
Synthesis and analysis of phosphate-modified RNA—experimental overview. (A) RNAs modified throughout the sequence are synthesized by in vitro transcription with the SP6 or T7 polymerase from a template also encoding the poly(A) tail in the presence of nucleoside triphosphates (NTPs) (left), whereas RNAs modified only within the poly(A) tail are synthesized by polyadenylation of unmodified RNA substrate with poly(A) polymerase (PAP) (right). (B) Modified RNAs are subjected to exhaustive degradation by a mix of nucleases and the resulting mononucleotides (adenosine monophosphate [AMP], modified AMP, and guanosine monophosphate [GMP] as a reference) are quantified using liquid chromatography–tandem mass spectrometry (LC–MS/MS) ([IA] intensity of analyte, [IIS] intensity of internal standard, [CA] concentration of analyte, [CIS] concentration of internal standard, and [a] slope of calibration curve). (C) Simplified workflow from nucleotide incorporation to RNA degradation and analysis.
FIGURE 2.
FIGURE 2.
Liquid chromatography–tandem mass spectrometry (LC–MS/MS) method development. (A) Synthesis of isotopically labeled internal standards (heavy adenosine monophosphate [AMP], heavy adenosine 5′-O-monothiophosphate [AMPS], heavy guanosine monophosphate [GMP], heavy adenosine-5′-O-(H-phosphonate) [AMPH]); (B) identification and optimization of suitable multiple reaction monitoring (MRM) pairs; (C) optimization of LC separation conditions; (D) determination of calibration curves; (E) high-performance liquid chromatography (HPLC)-MS analysis of an authentic RNA sample (phosphorothioate RNA A); and (F,G) optimization of nuclease (snake venom phosphodiesterase [SVPDE]) concentrations to ensure complete degradation of RNA A (unmodified, F) or modified with phosphorothioate moieties (G).
FIGURE 3.
FIGURE 3.
SP6 and T7 polymerases accept ATPαS D1 as a substrate. Short RNAs (RNA A or B) were obtained by in vitro transcription by SP6 or T7 RNA polymerase, respectively, in the presence of different ATP:ATPαS D1/D2 ratios. In vitro transcribed (IVT) RNAs (20 ng) were incubated with 3 µg/mL snake venom phosphodiesterase (SVPDE) for 1 h at 37°C (see Materials and Methods for further details). Concentrations of nucleotides after RNA digestion are determined based on liquid chromatography–tandem mass spectrometry (LC–MS/MS) analysis (Supplemental Fig. S7). The phosphorothioate moiety frequency in adenine nucleotides as a function of ATPαS D1 concentration in the transcription mix is shown in A; B shows the frequency of phosphorothioate moieties in adenine nucleotides found in RNAs obtained with SP6 and T7, and ATPαS (either D1 or D2). Data represent mean values from triplicate experiments ± standard deviation (SD).
FIGURE 4.
FIGURE 4.
Analysis of homogeneity and translational properties of mRNAs uniformly modified with phosphorothioate moieties. (A) Schematic representation of Firefly luciferase (RNA F) in vitro transcribed (IVT) with T7 or SP6 RNA polymerase. Green dots represent phosphorothioate moieties randomly placed within the mRNA body. (B) RNA F variants cotranscriptionally 5′-capped with the cap analog (β-S-ARCA D1) and obtained in the presence of the indicated ATP:ATPαS D1 molar ratios (10:0, 9:1, 2:1, 1:1, 1:4, or 0:10) are synthesized with T7 or SP6 RNA polymerase and purified on a silica membrane (NucleoSpin RNA Clean-up XS, Macherey-Nagel). The transcription yields and quality of transcripts are analyzed by electrophoresis on a 1% agarose gel. (C) Translation efficiencies are tested in rabbit reticulocyte lysate (RRL [Promega]) using appropriate RNA F concentrations (3, 1.5, 0.75, and 0.375 ng/µL) (see Materials and Methods for further details). Translation efficiencies are determined based on measured luminescence as a function of RNA F concentration. Slopes determined for different variants of RNA F are normalized to the slope of unmodified RNA F (10:0), calculated as the mean value from three independent experiments ± standard deviation (SD). Statistical significance: (*) P < 0.05, (**) P < 0.01, (***) P < 0.001, (****) P < 0.0001 (one-way analysis of variance [ANOVA] with Dunnett's multiple comparison test). Only statistically significant differences are marked in the graph.
FIGURE 5.
FIGURE 5.
Poly(A) polymerase (PAP) incorporates ATPαS D1 in the presence of ATP to produce modified poly(A) tails. Analysis of short RNAs with poly(A) (RNA A1) tails added by PAP using different ATP:ATPαS ratios (1 mM). Short RNAs (RNA A) are obtained by SP6 polymerase. RNA A1 (20 ng) is digested using snake venom phosphodiesterase (SVPDE) and Ccr4-Not transcription complex subunit 7 (CNOT7) for 1 h at 37°C (see Materials and Methods for further details). Data points represent mean values from triplicate experiments ± standard error of the mean (SEM). (A,C) Data obtained for ATPαS D1, (B,D) data obtained for ATPαS D2. Data from a single agarose gel are shown on Supplemental Figure S8A,B. Poly(A) tail length and composition (A,B) is determined based on liquid chromatography–tandem mass spectrometry (LC–MS/MS) quantification analysis and calculated based on the shown equation, wherein CAMP, AMPX is the concentration of AMP or adenine analog, CGMP is the concentration of GMP, rref is the ratio of AMP and GMP concentrations determined for the appropriate RNA lacking poly(A) tail (rfer = CAMPref/CGMPref), nGMPref is the number of numbers Gs in the sequence, and nAMPXtail is the number of adenine nucleotide analogs in poly(A). The incorporation efficiency of ATP versus ATPαS D1 or D2 by PAP is then calculated (C,D).
FIGURE 6.
FIGURE 6.
Analysis of mRNAs carrying phosphorothioate moieties within the poly(A) tail. (A) Schematic representation of the Gaussia luciferase-coding transcript, RP HPLC-purified and polyadenylated with poly(A) polymerase (PAP) in the presence of ATP or various mixtures of ATP:ATPαS D1 (9:1, 4:1, 3:1, 2:1, or 1:1 molar ratio). (B) RNA G1 poly(A) tail composition (the mean ± standard error of the mean [SEM]), and (C) average poly(A) tail lengths (the mean ± SEM) obtained from liquid chromatography–tandem mass spectrometry (LC–MS/MS). (D) Analysis of RNA G1 susceptibility to deadenylation. RNA G1 variants are incubated with Ccr4-Not transcription complex subunit 7 (CNOT7) deadenylase for 0–120 min, and the poly(A) tail degradation rate is analyzed on a 1% agarose gel using Image Lab 6.0.1 Software (Bio-Rad). The length of the poly(A) tail at each time point is estimated as the difference between digested RNA G1 and RNA G (transcript before polyadenylation). (E) Susceptibility to deadenylation of RNA G1 polyadenylated with various ATP:ATPαS D1 ratios, estimated as the number of nucleosides removed by CNOT7 deadenylase at particular time points. (FI) Translational properties of RNA G1 with phosphorothioate-modified poly(A) tails. Gaussia luciferase activity in the supernatant of (F) JAWS II and (G) HeLa cells, as measured 16, 40, 64, and 88 h after transfection with RNA G1. The cell medium was exchanged after each measurement. Data points represent mean values ± the standard deviation (SD) of one biological replicate consisting of three independent transfections. Total protein expression (cumulative luminescence) over 4 d in (H) JAWS II and (I) HeLa cells calculated from the same experiment. Bars represent the mean value ± SD normalized to RNA I (with a template-encoded A128 poly(A) tail). Statistical significance: (*) P < 0.05, (**) P < 0.01, (***) P < 0.001, (****) P < 0.0001 (one-way analysis of variance [ANOVA] with Dunnett's multiple comparison test). Only statistically significant differences are marked on the graph.
FIGURE 7.
FIGURE 7.
Boranophosphate RNAs release adenosine H-phosphonate (AMPH) as a degradation product. Analysis of short RNAs (RNA E1) (with U instead of A in the sequence) with poly(A) tails added by poly(A) polymerase (PAP) using different DATP/ATP analog ratios. DATP includes 10% ATP, which is taken into account during data analysis. RNA E1 is digested using snake venom phosphodiesterase (SVPDE) and Ccr4-Not transcription complex subunit 7 (CNOT7) for 1 h at 37°C (see Materials and Methods for further details). (A) Data shown are from a single agarose gel. (B) Amount of nucleotides (the mean ± standard error of the mean [SEM]) after RNA degradation, as determined by liquid chromatography–tandem mass spectrometry (LC–MS/MS) normalized to guanosine monophosphate (GMP). (C) Poly(A) tail length (the mean ± SEM) calculated based on the concentration of nucleotides released from the RNA and RNA body sequence (Materials and Methods).
FIGURE 8.
FIGURE 8.
Analysis of mRNAs carrying boranophosphate moieties within the poly(A) tail. (A) Schematic representation of the Gaussia luciferase-coding transcript, RP HPLC-purified and polyadenylated with poly(A) polymerase (PAP) in the presence of ATP, ATPαBH3 D1 alone, or various mixtures of ATP:ATPαBH3 D1 (14:1, 9:1, 5:1, 3:1, or 1:1). (B) RNA H1 tails composition (the mean ± standard error of the mean [SEM]) and (C) average poly(A) tail lengths (the mean ± SEM) obtained from LC–MS/MS. (D) Analysis of RNA H1 susceptibility to deadenylation. RNA H1 variants are incubated with CNOT7 deadenylase for 0–120 min, and the RNA length is analyzed on a 1% agarose gel using Image Lab 6.0.1 Software (Bio-Rad). The length of the poly(A) tail at each time point is estimated as the difference between digested RNA H1 and RNA H (transcript before polyadenylation). (E) Susceptibility to deadenylation of RNA H1 polyadenylated with various ATP:ATPαBH3 D1 ratios, estimated as the number of nucleosides removed by CNOT7 deadenylase at particular time points. (FI) Translational properties of RNA H1 with boranophosphate-modified poly(A) tails. Gaussia luciferase activity in the supernatant of (F) JAWS II and (G) HeLa cells, as measured 16, 40, 64, and 88 h after transfection with RNA H1. The cell medium was exchanged after each measurement. Data points represent mean values ± standard deviation (SD) of one biological replicate consisting of three independent transfections. (H) Total protein expression (cumulative luminescence) over 4 d in JAWS II and (I) HeLa cells calculated from the same experiment. Bars represent the mean value ± SD normalized to RNA I (with a template-encoded A128 poly(A) tail). Statistical significance: (*) P < 0.05, (**) P < 0.01, (***) P < 0.001, (****) P < 0.0001 (one-way analysis of variance [ANOVA] with Dunnett's multiple comparison test). Only statistically significant differences are marked on the graph.

References

    1. Anderson BR, Muramatsu H, Nallagatla SR, Bevilacqua PC, Sansing LH, Weissman D, Kariko K. 2010. Incorporation of pseudouridine into mRNA enhances translation by diminishing PKR activation. Nucleic Acids Res 38: 5884–5892. 10.1093/nar/gkq347 - DOI - PMC - PubMed
    1. Anhauser L, Huwel S, Zobel T, Rentmeister A. 2019. Multiple covalent fluorescence labeling of eukaryotic mRNA at the poly(A) tail enhances translation and can be performed in living cells. Nucleic Acids Res 47: e42 10.1093/nar/gkz084 - DOI - PMC - PubMed
    1. Armstrong VW, Yee D, Eckstein F. 1979. Mechanistic studies on deoxyribonucleic-acid dependent ribonucleic-acid polymerase from Escherichia coli using phosphorothioate analogs. 2. Elongation reaction. Biochemistry 18: 4120–4123. 10.1021/bi00586a010 - DOI - PubMed
    1. Astrom J, Astrom A, Virtanen A. 1991. Invitro deadenylation of mammalian messenger-RNA by a HELA-cell 3′ exonuclease. EMBO J 10: 3067–3071. 10.1002/j.1460-2075.1991.tb07858.x - DOI - PMC - PubMed
    1. Auriola S, Frith J, Rogers MJ, Koivuniemi A, Monkkonen J. 1997. Identification of adenine nucleotide-containing metabolites of bisphosphonate drugs using ion-pair liquid chromatography-electrospray mass spectrometry. J Chromatogr B 704: 187–195. 10.1016/S0378-4347(97)00490-8 - DOI - PubMed

Publication types

MeSH terms

LinkOut - more resources