. 2020 Sep 1;34(17-18):1210-1226.
doi: 10.1101/gad.340133.120. Epub 2020 Aug 20.

MYCN drives chemoresistance in small cell lung cancer while USP7 inhibition can restore chemosensitivity

Affiliations

MYCN drives chemoresistance in small cell lung cancer while USP7 inhibition can restore chemosensitivity

Eli Grunblatt et al. Genes Dev. .

Abstract

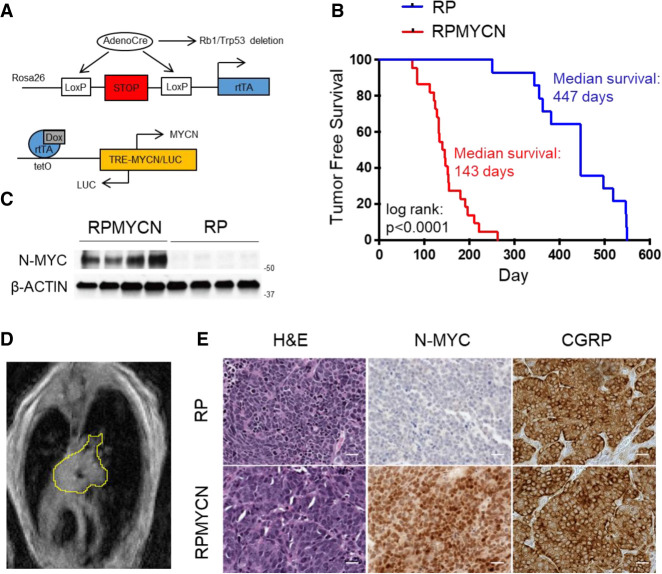
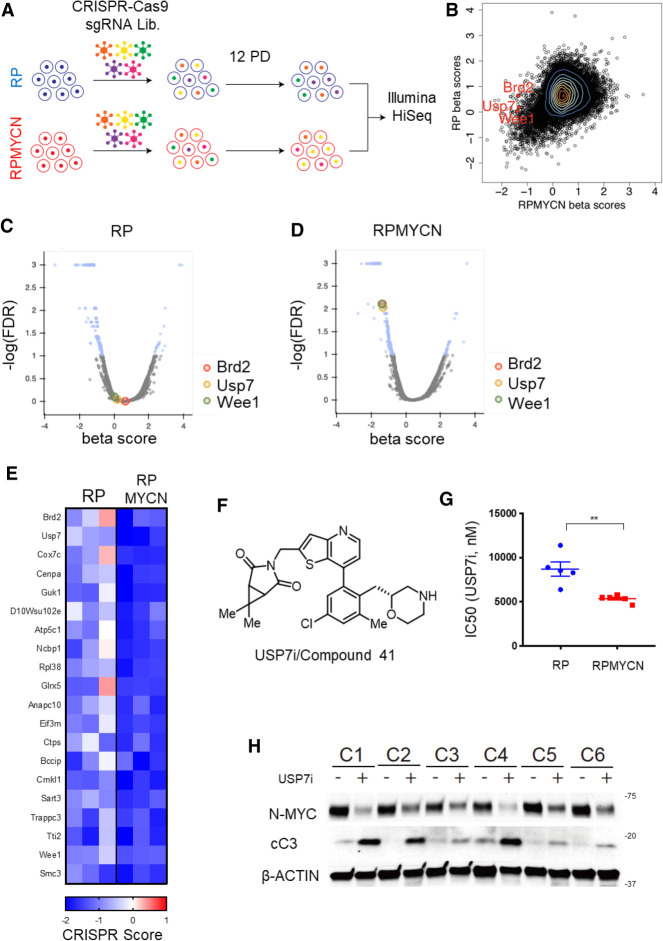
Small cell lung cancer (SCLC) is an aggressive neuroendocrine cancer characterized by initial chemosensitivity followed by emergence of chemoresistant disease. To study roles for MYCN amplification in SCLC progression and chemoresistance, we developed a genetically engineered mouse model of MYCN-overexpressing SCLC. In treatment-naïve mice, MYCN overexpression promoted cell cycle progression, suppressed infiltration of cytotoxic T cells, and accelerated SCLC. MYCN overexpression also suppressed response to cisplatin-etoposide chemotherapy, with similar findings made upon MYCL overexpression. We extended these data to genetically perturb chemosensitive patient-derived xenograft (PDX) models of SCLC. In chemosensitive PDX models, overexpression of either MYCN or MYCL also conferred a switch to chemoresistance. To identify therapeutic strategies for MYCN-overexpressing SCLC, we performed a genome-scale CRISPR-Cas9 sgRNA screen. We identified the deubiquitinase USP7 as a MYCN-associated synthetic vulnerability. Pharmacological inhibition of USP7 resensitized chemoresistant MYCN-overexpressing PDX models to chemotherapy in vivo. Our findings show that MYCN overexpression drives SCLC chemoresistance and provide a therapeutic strategy to restore chemosensitivity.

Keywords: MYCL; MYCN; SCLC; USP7; chemoresistance.


Figures

Figure 1.
Figure 1.
MYCN overexpression promotes SCLC in mouse models (A) Schematic of alleles used to generate the doxycycline-inducible MYCN overexpression mouse model. (B) Kaplan-Meier curve comparing survival of control RP mice with RPMYCN Ad-CGRP-Cre-infected mice. (n = 14 mice for RP; n = 22 mice for RPMYCN). Significance was determined using the log-rank (Mantel-Cox) test. (C) Immunoblot comparing levels of N-MYC expression in RP versus RPMYCN tumors. β-ACTIN was used as a loading control. (D) Representative magnetic resonance image (MRI) of a RPMYCN tumor, outlined in yellow. (E) Representative H&E and immunohistochemistry for N-MYC and neuroendocrine marker CGRP in RP versus RPMYCN tumors. Scale bar, 20 µm.
Figure 2.
Figure 2.
MYCN overexpression increases proliferation and protein synthesis in SCLC (A) Representative MRI of lungs from two RPMYCN mice (M1 and M2) at days 0 and 14 of doxycycline withdrawal. (B) Waterfall plot showing the percentage of change in tumor volume from baseline at day 14 after doxycycline removal for all OFF DOX tumors. (C) Immunoblot showing decrease in N-MYC expression in RPMYCN tumors collected after 7 d off of DOX. β-ACTIN was used as a loading control. (D) Representative immunohistochemistry for pH3 and TUNEL staining comparing RPMYCN ON DOX versus OFF DOX tumors. Scale bar, 20 µm. (E) Quantification of the percentage of pH3- and TUNEL-positive cells respectively across all ON DOX and OFF DOX samples. Data are means ± SEM. (n = 5 in all groups). Significance was determined using two-tailed unpaired Student's t-test. (*) P < 0.05; (***) P < 0.001. (F) Graph showing proliferation, determined using Cell Counting Kit-8 kit, of a representative RPMYCN-derived cell line (C1) cultured either with or without DOX over 4 d. Data are means ± SEM (n = 3 biological replicates each consisting of 3 technical replicates per condition). Significance was determined using two-tailed unpaired Student's t-test. (***) P < 0.001. (G) Quantification of propidium iodide cell cycle assay comparing live cells versus cells in the sub-G1 population for C1 cell line cultured either in the presence or absence of DOX. Data are means ± SEM (n = 3 biological replicates each consisting of three technical replicates per condition). (H) Quantification of propidium iodide cell cycle assay, focusing on live cells only and comparing G1, S, and G2/M populations for C1 cell line cultured either in the presence or absence of DOX. Data are means ± SEM (n = 3 biological replicates each consisting of three technical replicates per condition). (I) Representative immunoblot comparing levels of N-MYC, cyclins, and cell cycle regulators in the presence or absence of DOX for six RPMYCN-derived cell lines (C1–6). (J) Quantification of qRT-PCR analysis performed on C1 cell line cultured either with or without doxycycline. Top shows relative expression of pre-rRNA as determined by expression levels of the 47S rRNA internal transcribed spacer (ITS) region relative to β2m. The bottom shows relative expression of MYCN relative to Gapdh. Data are means ± SEM (n = 3 biological replicates each consisting of 3 technical replicates per condition). (K) Analysis of nascent protein synthesis in C1 cell line using a puromycin incorporation assay. β-ACTIN was used as a loading control.
Figure 3.
Figure 3.
MYCN modulates the SCLC tumor immune microenvironment (A) Venn diagram showing genes that are differentially regulated in MYCN-overexpressing samples for the following comparisons: RPMYCN (n = 7) versus RP (n = 7) tumors, RPMYCN ON DOX (n = 7) versus OFF DOX (n = 4) tumors, and RPMYCN ON DOX (n = 5) versus OFF DOX (n = 5) cell lines. Gene lists were determined using EdgeR analysis with an FDR cutoff of 0.05. (B) KEGG pathway analysis of the 1030 genes commonly differentially expressed across all three comparisons. Significance was determined using an adjusted P-value of P < 0.05. (C) CHEA and ENCODE binding analysis of the 1030 genes commonly regulated by MYCN across all three comparisons. Significance was determined using an adjusted P-value of P < 0.05. (D) Heat maps depicting N-MYC binding from CUT&RUN data in an RPMYCN-derived cell line (C3) in the presence versus absence of DOX. Heat map shows data 5 kb upstream of to 5 kb downstream from TSS. (E,F) Gene set enrichment analysis of RNA sequencing data for RPMYCN versus RP tumors, RPMYCN ON DOX versus OFF DOX tumors, and RPMYCN ON DOX versus OFF DOX cell line comparisons (n = 7 in all RPMYCN versus RP groups;. n = 7 in RPMYCN ON DOX tumors group; n = 4 in RPMYCN OFF DOX tumors group; n = 5 in all RPMYCN ON DOX versus OFF DOX cell line groups). Graphs show pathways from the Hallmark database that are either positively (E) or negatively (F) enriched in the respective MYCN-overexpressing conditions for each comparison. The size of the circles corresponds to −log(FDR) while the colors of the circles correspond to the normalized enrichment score (NES) for each pathway. (G) Representative dot plots showing the gating strategy used for FACS analysis of the tumor immune microenvironment. Starting from the top left, initial gates select for live cells (FVD) and then for leukocytes by CD45. Gating for specific cell surface marker combinations was then used to identify immune cell populations such as B cell (CD3 CD19+), CD4+ T cells (CD3+ CD4+), CD8+ T cells (CD3+ CD8+), and neutrophils (CD11b+ Ly6G+). (H) Quantification of the percentage of each immune cell population within the total population of leukocytes per tumor. Data are means ± SEM (RP: n = 5; RPMYCN ON DOX: n = 6; RPMYCN OFF DOX: n = 7). Significance was determined using two-tailed unpaired Student's t-test. (*) P < 0.05; (**) P < 0.01; (***) P < 0.001.
Figure 4.
Figure 4.
MYCN and MYCL drive chemoresistance in an SCLC mouse model (A) Representative MRI of RP, RPMYCL, and RPMYCN lungs at days 0, 14, and 21 of cis–eto treatment. Tumors are circled in yellow. (B) Quantification of the percentage of change in tumor volume between days 0 and 14 of treatment. Data are means ± SEM (RP SALINE: n = 8; RP CIS–ETO: n = 6; RPMYCN SALINE: n = 9; RPMYCN CIS–ETO: n = 7; RPMYCL SALINE: n = 8; RPMYCL CIS–ETO: n = 11). Significance was determined using two-tailed unpaired Student's t-test. (**) P < 0.01. (C) Quantification of the percentage of change in tumor volume between days 0 and 21 of treatment. Data are means ± SEM (RP SALINE: n = 8; RP CIS–ETO: n = 6; RPMYCN SALINE: n = 5; RPMYCN CIS–ETO: n = 7; RPMYCL SALINE: n = 8; RPMYCL CIS–ETO: n = 11). Significance was determined using two-tailed unpaired Student's t-test. (***) P<0.001. (D) Representative immunohistochemistry images for pH3 and TUNEL staining in a parallel cohort comparing RP, RPMYCL, and RPMYCN tumors at a 3-d time point of treatment with either saline or cis–eto. Scale bar, 20 µm. (E) Quantification of the percentage of TUNEL-positive cells. Data are means ± SEM (n = 5 in all groups). Significance was determined using two-tailed unpaired Student's t-test. (**) P < 0.01. (F) Quantification of the percentage of pH3-positive cells. Data are means ± SEM. (n = 5 in all groups). Significance was determined using two-tailed unpaired Student's t-test. (***) P < 0.001.
Figure 5.
Figure 5.
MYCN and MYCL overexpression abrogates chemotherapy response in PDX model of SCLC (A) Graph showing flank tumor volumes of empty control versus MYCN-overexpressing FHSC14 PDX tumors over 21 d of treatment with either saline or three cycles of cis–eto. Data are means ± SEM (n = 5 in all groups). Significance was determined using a mixed model two-way ANOVA followed by a post hoc Tukey's multiple comparisons test. For each group, significance is presented relative to the respective saline condition. (**) P < 0.01. (B) Immunoblot showing successful MYCN overexpression in the FHSC14 PDX model. Lysate from a human SCLC cell line harboring a MYCN amplification (H69) was used as a positive control while lysate from the human SCLC cell line H209 was used as a negative control. GAPDH was used as a loading control. (C) Graph showing flank tumor volumes of empty control versus MYCL-overexpressing FHSC14 PDX tumors over 21 d of treatment with either saline or three cycles of cis–eto. Data are means ± SEM (n = 5 in all groups). Significance was determined using a mixed model two-way ANOVA followed by a post hoc Tukey's multiple comparisons test. For each group, significance is presented relative to the respective saline condition. (**) P < 0.01. (D) Immunoblot showing successful MYCL overexpression in the FHSC14 PDX model. Lysate from a human SCLC cell line harboring a MYCL amplification (H510) was used as a positive control while lysate from the human SCLC cell line H209 was used as a negative control. GAPDH was used as a loading control. (E) Representative immunohistochemistry images for TUNEL staining in a parallel cohort comparing FHSC14 empty, MYCN-overexpressing, and MYCL-overexpressing tumors at a 3-d time point after treatment with either saline or cis–eto. Scale bar, 20 µm. (F) Quantification of the percentage of TUNEL-positive cells. Data are means ± SEM (n = 5 in all groups). Significance was determined using two-tailed unpaired Student's t-test. (**) P < 0.01; (***) P < 0.001. (G) Representative immunohistochemistry images for pH3 staining in a parallel cohort comparing FHSC14 empty, MYCN-overexpressing, and MYCL-overexpressing tumors at a 3-d time point after treatment with either saline or cis–eto. Scale bar, 20 µm. (H) Quantification of the percentage of pH3-positive cells. Data are means ± SEM. (n = 5 in all groups). Significance was determined using two-tailed unpaired Student's t-test. (***) P < 0.001.
Figure 6.
Figure 6.
CRISPR inactivation screens reveal USP7 as a MYCN synthetic vulnerability. (A) Schematic outlining the strategy used in a genome scale CRISPR–Cas9 sgRNA screen comparing cell lines derived from RP and RPMYCN tumors (n = 3 cell lines in both groups). (B) Contour plot comparing MAGeCK analysis generated β scores for RP-derived lines (Y-axis) versus RPMYCN-derived lines (X-axis). Each data point (shown as a black circle) represents a single gene in the sgRNA library. A positive β score indicates that guide RNAs targeting a given gene are present in a higher proportion after 12 population doublings while a negative β score indicates that guide RNAs targeting a given gene are present in a lower proportion after 12 population doublings. A selection of known druggable targets that exhibit a significantly lower β score in RPMYCN lines as compared with RP lines are highlighted in red. Genes with fewer than five associated sgRNAs were omitted. (C) Volcano plot showing genes that are significantly enriched or depleted in RP lines following 12 population doublings as determined by MAGeCK-MLE analysis. (D) Volcano plot showing genes that are significantly enriched or depleted in RPMYCN lines following 12 population doublings as determined by MAGeCK-MLE analysis. (E) Heat map showing CRISPR scores of 20 selected genes for each RP- and RPMYCN-derived cell line. Genes were selected based on statistical significance from MAGECK analyses and ordered based on greatest difference in RPMYCN and RP CRISPR scores. (F) Chemical structure of the novel USP7 inhibitor, USP7i, also known as compound 41, developed by RAPT Therapeutics. (G) Comparison of IC50 for USP7i between RP- and RPMYCN-derived cell lines. Data are means ± SEM from n = 5 cell lines (RP) and n = 6 cell lines (RPMYCN). Data from each individual cell line are from three biological replicates each consisting of three technical replicates. Significance was determined using two-tailed unpaired Student's t-test. (**) P < 0.01. (H) Immunoblot comparing levels of N-MYC and cleaved CASPASE 3 (cC3) in six RPMYCN-derived cell lines (C1–6) either with or without USP7i treatment. β-ACTIN was used as a loading control.
Figure 7.
Figure 7.
USP7 inhibition resensitizes MYCN-overexpressing tumors to chemotherapy (A) Graph showing flank tumor volumes of empty control versus MYCN-overexpressing FHSC14 PDX tumors over 14 d of treatment with either saline, cis–eto, 100 mg/kg USP7i, or 100 mg/kg USP7i + cis–eto. Data are means ± SEM (n = 5 in all groups except for EMPTY CIS–ETO and MYCN USP7i, where n = 4). Significance was determined using a mixed model two-way ANOVA followed by a post hoc Tukey's multiple comparisons test. For each group, significance is presented relative to the respective saline condition. (**) P < 0.01. (B) Graph showing flank tumor volumes of empty control versus MYCL-overexpressing FHSC14 PDX tumors over 14 d of treatment with either saline, cis–eto, 100 mg/kg USP7i, or 100 mg/kg USP7i + cis–eto. Data are means ± SEM (n = 5 in all groups except for EMPTY CIS–ETO, MYCL SALINE, and MYCL USP7i + CIS–ETO, where n = 4; EMPTY samples are the same as in A). Significance was determined using a mixed model two-way ANOVA followed by a post hoc Tukey's multiple comparisons test. For each group, significance is presented relative to the respective saline condition. (*) P < 0.05; (**) P < 0.01. (C) Graph showing flank tumor volumes of empty control versus MYCN-overexpressing FHSC14 PDX tumors over 21 d of treatment with either saline, cis–eto, 50 mg/kg USP7i, or 50 mg/kg USP7i + two cycles of cis–eto (weeks 1 and 3, respectively). Data are means ± SEM (n = 5 in all groups). Significance was determined using a mixed model two-way ANOVA followed by a post hoc Tukey's multiple comparisons test. For each group, significance is presented relative to the respective saline condition. (**) P < 0.01. (D) Immunoblot comparing levels of N-MYC expression across treatment groups after 7 d of treatment in a parallel cohort. GAPDH was used as a loading control. (E) Representative immunohistochemistry images for pH3 staining comparing treatment groups. Scale bar, 20 µm. (F) Quantification of the percentage of pH3-positive cells. Data are means ± SEM (n = 5 in all groups). Significance was determined using two-tailed unpaired Student's t-test. (***) P < 0.001. (G) Representative immunohistochemistry images for TUNEL staining comparing treatment groups. Scale bar, 20 µm. (H) Quantification of the percentage of TUNEL-positive cells. Data are means ± SEM. (n = 5 in all groups). Significance was determined using two-tailed unpaired Student's t-test. (***) P < 0.001.

References

    1. Anders S, Pyl, PT., Huber, W. 2015. HTSeq- a Python framework to work with high-throughput sequencing data. Bioinformatics 31: 166-169. 10.1093/bioinformatics/btu638 - DOI - PMC - PubMed
    1. Augert A, Zhang Q, Bates B, Cui M, Wang X, Wildey G, Dowlati A, MacPherson D. 2017. Small cell lung cancer exhibits frequent inactivating mutations in the histone methyltransferase KMT2D/MLL2: CALGB 151111 (alliance). J Thorac Oncol 12: 704–713. 10.1016/j.jtho.2016.12.011 - DOI - PMC - PubMed
    1. Augert A, Eastwood E, Ibrahim AH, Wu N, Grunblatt E, Basom R, Liggitt D, Eaton KD, Martins R, Poirier JT, et al. 2019. Targeting NOTCH activation in small cell lung cancer through LSD1 inhibition. Sci Signal 12: eaau2922 10.1126/scisignal.aau2922 - DOI - PMC - PubMed
    1. Beltran H. 2014. The N-myc oncogene: maximizing its targets, regulation, and therapeutic potential. Mol Cancer Res 12: 815–822. 10.1158/1541-7786.MCR-13-0536 - DOI - PubMed
    1. Boon K, Caron HN, van Asperen R, Valentijn L, Hermus MC, van Sluis P, Roobeek I, Weis I, Voûte PA, Schwab M, et al. 2001. N-myc enhances the expression of a large set of genes functioning in ribosome biogenesis and protein synthesis. EMBO J 20: 1383–1393. 10.1093/emboj/20.6.1383 - DOI - PMC - PubMed

Publication types

MeSH terms

Substances