Comparative Study
. 2020 Sep 8;117(36):22035-22041.
doi: 10.1073/pnas.2006392117. Epub 2020 Aug 20.

Demographic perspectives on the mortality of COVID-19 and other epidemics

Affiliations
Comparative Study

Demographic perspectives on the mortality of COVID-19 and other epidemics

Joshua R Goldstein et al. Proc Natl Acad Sci U S A. .

Erratum in

Abstract

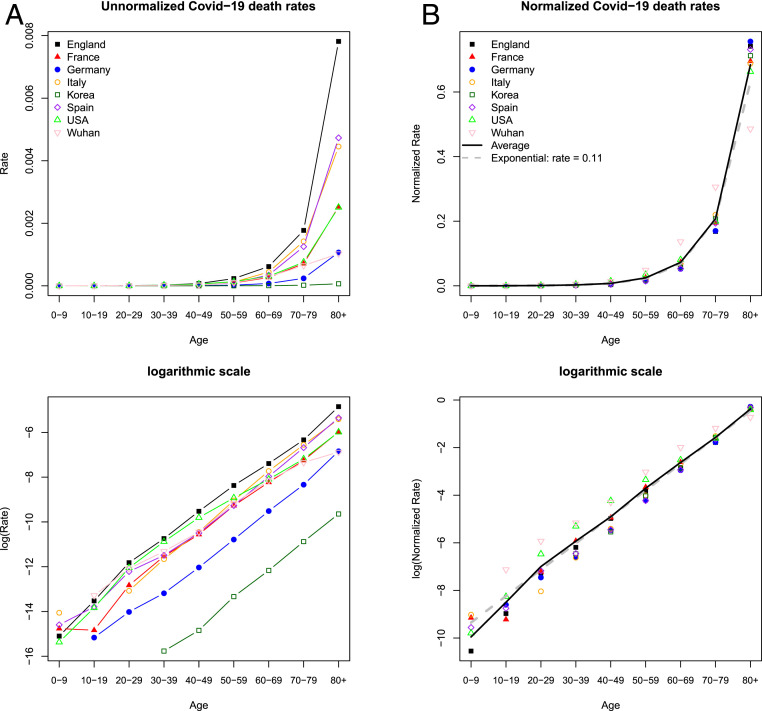
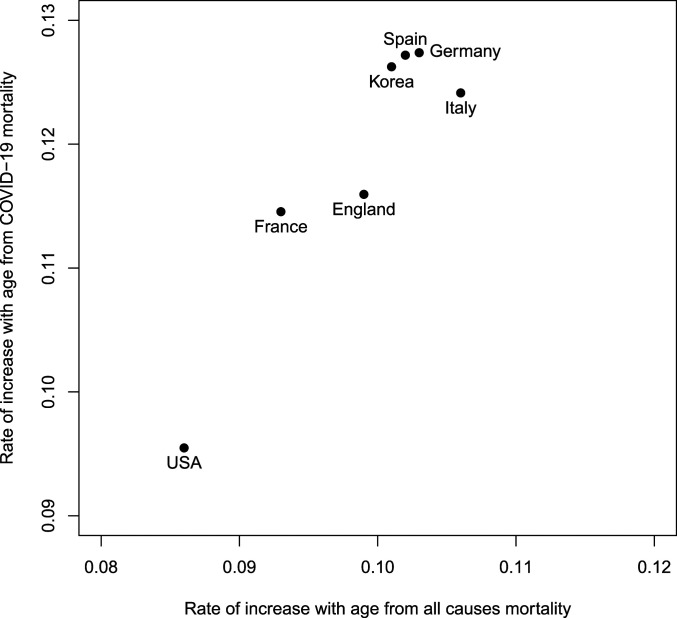
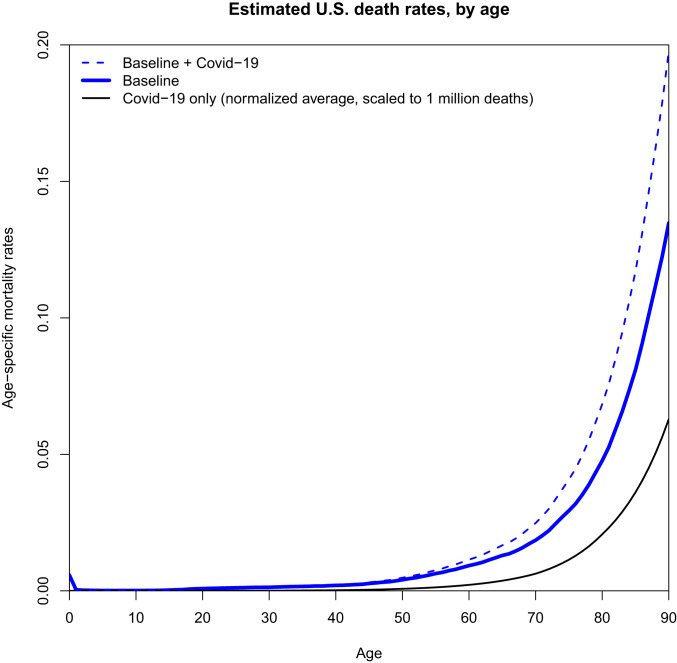
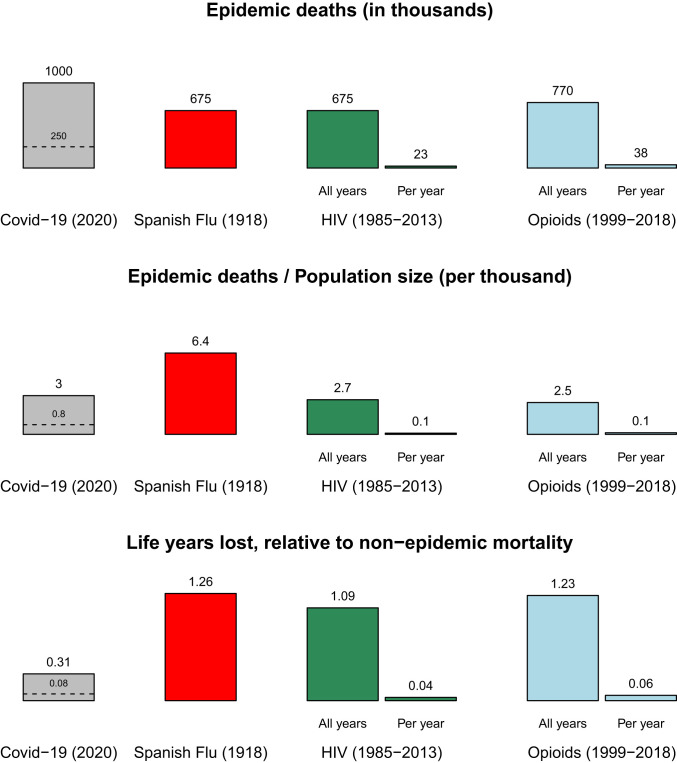
To put estimates of COVID-19 mortality into perspective, we estimate age-specific mortality for an epidemic claiming for illustrative purposes 1 million US lives, with results approximately scalable over a broad range of deaths. We calculate the impact on period life expectancy (down 2.94 y) and remaining life years (11.7 y per death). Avoiding 1.75 million deaths or 20.5 trillion person years of life lost would be valued at $10.2 to $17.5 trillion. The age patterns of COVID-19 mortality in other countries are quite similar and increase at rates close to each country's rate for all-cause mortality. The scenario of 1 million COVID-19 deaths is similar in scale to that of the decades-long HIV/AIDS and opioid-overdose epidemics but considerably smaller than that of the Spanish flu of 1918. Unlike HIV/AIDS and opioid epidemics, the COVID-19 deaths are concentrated in a period of months rather than spread out over decades.

Keywords: COVID-19; demography; epidemic; life expectancy; mortality.


Conflict of interest statement

The authors declare no competing interest.

Figures

Fig. 1.
Fig. 1.
Similar age pattern of COVID-19 mortality by region. (A) Unnormalized age-specific mortality, calculated as the ratio of deaths by age to population by age. The levels should not be interpreted as reflecting real differences in mortality because of unaccounted variation in time scale, stage of the epidemic, and the extent of spread within the region. (B) Normalized rates, dividing each region’s rates by the sum of these rates, allow comparison of the age pattern. The average is calculated across all regions. Exponential increase at a rate of 0.11 is plotted to intersect the average in the age group 70 to 79 y. A and B, Lower show the same data as A and B, Upper but in logarithmic scale. (For sources, see main text Epidemic Mortality Risk as Temporary Aging.)
Fig. 2.
Fig. 2.
The relationship between exponential rates of increase with age of all-cause mortality and COVID-19 mortality for countries in the Human Mortality Database. (Note that exponential rates are calculated from age groups 45 to 49 y to 85 to 89 y for all-cause mortality and ages 40 to 49 y to 80+ y for COVID-19 mortality, assuming 40-y ranges for both.)
Fig. 3.
Fig. 3.
Estimated age-specific mortality in the United States in 2020 for the scenario of 1 million additional COVID-19 deaths. Baseline mortality in 2020 is assumed to equal that in 2017. COVID-19 mortality is estimated by averaging the normalized death rates in Fig. 1B and then multiplying these average rates to result in 1 million additional deaths using the US population age structure for 2020.
Fig. 4.
Fig. 4.
Mortality of COVID-19 scenario compared to past US epidemics according to different measures. In the scenario of 1 million COVID-19 deaths, the virus kills more Americans than past epidemics, but when population size is accounted for, Spanish flu is more deadly. Taking into account years of remaining life, we calculate that the Spanish flu resulted in even larger losses. The scales of the HIV and opioid epidemics were much smaller each year, but over decades became comparable to COVID-10 in terms of per-capita deaths and to Spanish flu in terms of life years lost. The scenario of 250,000 COVID-19 deaths is also shown with a dashed line. (Source: our calculations detailed in Materials and Methods.)

References

    1. Centers for Disease Control , Covid-19 forecasts: Cumulative deaths. https://www.cdc.gov/coronavirus/2019-ncov/covid-data/forecasting-us.html. Accessed 12 August 2020.
    1. Ferguson N., et al. , “Impact of non-pharmaceutical interventions (NPIs) to reduce Covid19 mortality and healthcare demand” (Rep. 9, Imperial College, London, UK, 2020). - PMC - PubMed
    1. NovelCoronavirus Pneumonia Emergency Response Epidemiology Team , The epidemiological characteristics of an outbreak of 2019 novel coronavirus diseases (covid-19)—China. China CDC Weekly 2, 113–122 (2020). - PMC - PubMed
    1. Institut National d’Etudes Démographiques , The demographics of Covid-19 deaths. https://dc-covid.site.ined.fr/en/. Accessed 23 May 2020.
    1. Edwards R. D., Tuljapurkar S., Inequality in life spans and a new perspective on mortality convergence across industrialized countries. Popul. Dev. Rev. 31, 645–674 (2005).

Publication types