

4-Phenylbutyrate ameliorates apoptotic neural cell death in Down syndrome by reducing protein aggregates
- PMID: 32820178
- PMCID: PMC7441064
- DOI: 10.1038/s41598-020-70362-x
4-Phenylbutyrate ameliorates apoptotic neural cell death in Down syndrome by reducing protein aggregates
Abstract
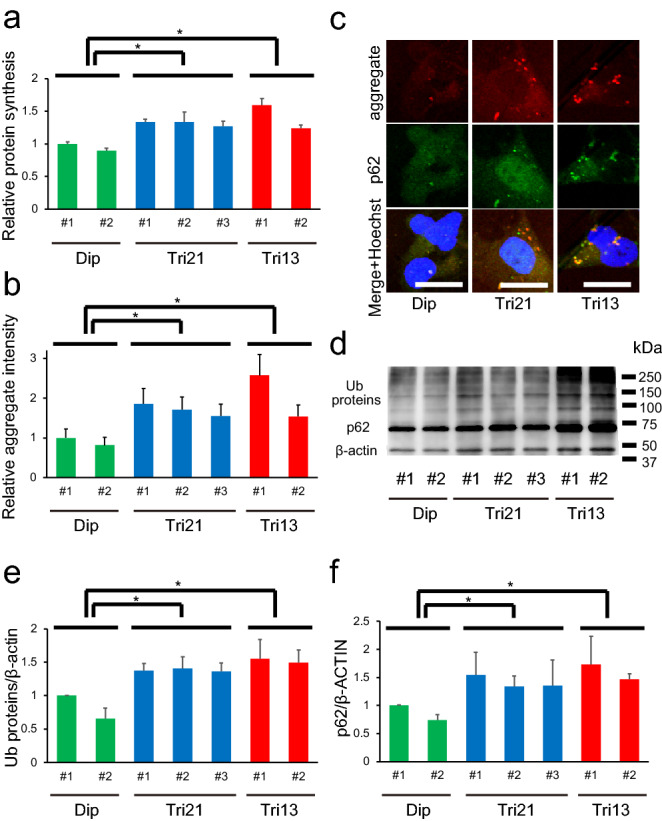
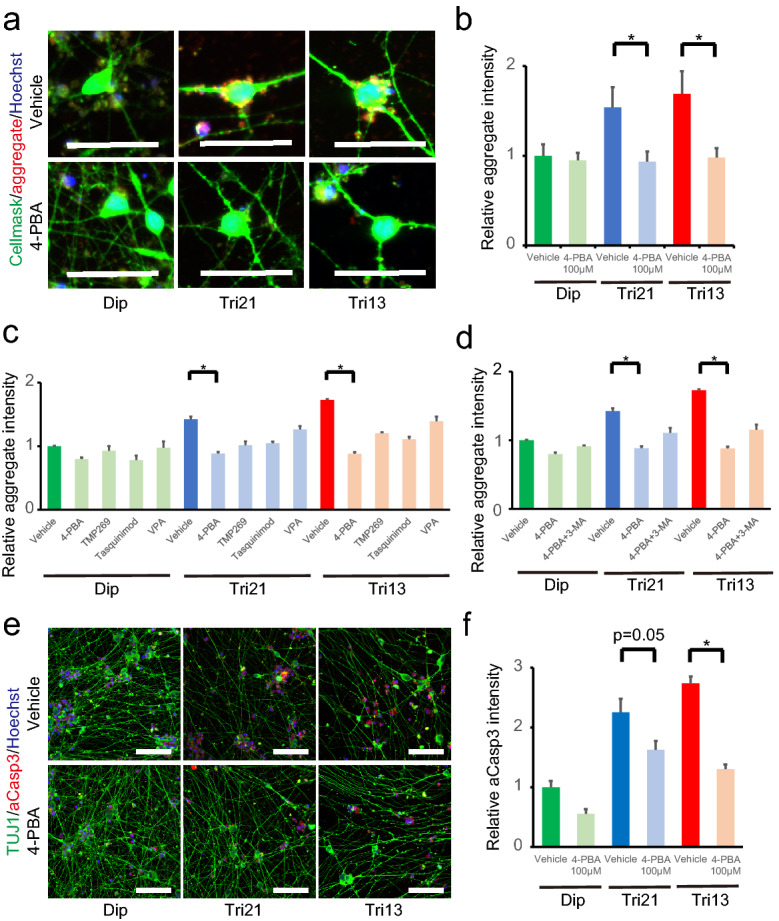
Individuals with Down syndrome (DS) commonly show unique pathological phenotypes throughout their life span. Besides the specific effects of dosage-sensitive genes on chromosome 21, recent studies have demonstrated that the gain of a chromosome exerts an adverse impact on cell physiology, regardless of the karyotype. Although dysregulated transcription and perturbed protein homeostasis are observed in common in human fibroblasts with trisomy 21, 18, and 13, whether and how this aneuploidy-associated stress acts on other cell lineages and affects the pathophysiology are unknown. Here, we investigated cellular stress responses in human trisomy 21 and 13 neurons differentiated from patient-derived induced pluripotent stem cells. Neurons of both trisomies showed increased vulnerability to apoptotic cell death, accompanied by dysregulated protein homeostasis and upregulation of the endoplasmic reticulum stress pathway. In addition, misfolded protein aggregates, comprising various types of neurodegenerative disease-related proteins, were abnormally accumulated in trisomic neurons. Intriguingly, treatment with sodium 4-phenylbutyrate, a chemical chaperone, successfully decreased the formation of protein aggregates and prevented the progression of cell apoptosis in trisomic neurons. These results suggest that aneuploidy-associated stress might be a therapeutic target for the neurodegenerative phenotypes in DS.
Conflict of interest statement
The authors have read the journal’s policy and have the following competing interests. Dr. Mahito Nakanishi is the founder and chief technology officer of Tokiwa-Bio, Inc. Ms. Manami Ohtaka is an employee of Tokiwa-Bio, Inc. The method to generate iPS cells with the SeVdp vector installing reprogramming genes is protected by the following patents: JP 4936482, JP 5633075, JP 5963309, US 9145564, US 8496941 B2, US 9365866 B2, EP 2434012, and EP 2639297. This does not alter our adherence to all the
Figures


Similar articles
-
Elimination of protein aggregates prevents premature senescence in human trisomy 21 fibroblasts.PLoS One. 2019 Jul 29;14(7):e0219592. doi: 10.1371/journal.pone.0219592. eCollection 2019. PLoS One. 2019. PMID: 31356639 Free PMC article.
-
The Impact of APP on Alzheimer-like Pathogenesis and Gene Expression in Down Syndrome iPSC-Derived Neurons.Stem Cell Reports. 2018 Jul 10;11(1):32-42. doi: 10.1016/j.stemcr.2018.05.004. Epub 2018 May 31. Stem Cell Reports. 2018. PMID: 29861166 Free PMC article.
-
Sodium 4-phenylbutyrate acts as a chemical chaperone on misfolded myocilin to rescue cells from endoplasmic reticulum stress and apoptosis.Invest Ophthalmol Vis Sci. 2007 Apr;48(4):1683-90. doi: 10.1167/iovs.06-0943. Invest Ophthalmol Vis Sci. 2007. PMID: 17389500
-
[Molecular pharmacological studies on the protection mechanism against endoplasmic reticulum stress-induced neurodegenerative disease].Yakugaku Zasshi. 2012;132(12):1437-42. doi: 10.1248/yakushi.12-00249. Yakugaku Zasshi. 2012. PMID: 23208051 Review. Japanese.
-
[Molecular Mechanism Underlying Abnormal Differentiation of Neural Progenitor Cells in the Developing Down Syndrome Brain].Yakugaku Zasshi. 2017;137(7):795-800. doi: 10.1248/yakushi.16-00236-1. Yakugaku Zasshi. 2017. PMID: 28674289 Review. Japanese.
Cited by
-
Transition from Animal-Based to Human Induced Pluripotent Stem Cells (iPSCs)-Based Models of Neurodevelopmental Disorders: Opportunities and Challenges.Cells. 2023 Feb 7;12(4):538. doi: 10.3390/cells12040538. Cells. 2023. PMID: 36831205 Free PMC article. Review.
-
Making neurons, made easy: The use of Neurogenin-2 in neuronal differentiation.Stem Cell Reports. 2022 Jan 11;17(1):14-34. doi: 10.1016/j.stemcr.2021.11.015. Epub 2021 Dec 30. Stem Cell Reports. 2022. PMID: 34971564 Free PMC article. Review.
-
From neurodevelopment to neurodegeneration: utilizing human stem cell models to gain insight into Down syndrome.Front Genet. 2023 May 30;14:1198129. doi: 10.3389/fgene.2023.1198129. eCollection 2023. Front Genet. 2023. PMID: 37323671 Free PMC article. Review.
-
Fluc-EGFP reporter mice reveal differential alterations of neuronal proteostasis in aging and disease.EMBO J. 2021 Oct 1;40(19):e107260. doi: 10.15252/embj.2020107260. Epub 2021 Aug 19. EMBO J. 2021. PMID: 34410010 Free PMC article.
-
Alzheimer's disease alters oligodendrocytic glycolytic and ketolytic gene expression.Alzheimers Dement. 2021 Sep;17(9):1474-1486. doi: 10.1002/alz.12310. Epub 2021 Mar 2. Alzheimers Dement. 2021. PMID: 33650792 Free PMC article.
References
Publication types
MeSH terms
Substances
LinkOut - more resources
Full Text Sources
Medical
