. 2020 Aug 20;10(1):14045.
doi: 10.1038/s41598-020-70656-0.

Homozygous deletions implicate non-coding epigenetic marks in Autism spectrum disorder

Affiliations

Homozygous deletions implicate non-coding epigenetic marks in Autism spectrum disorder

Klaus Schmitz-Abe et al. Sci Rep. .

Abstract

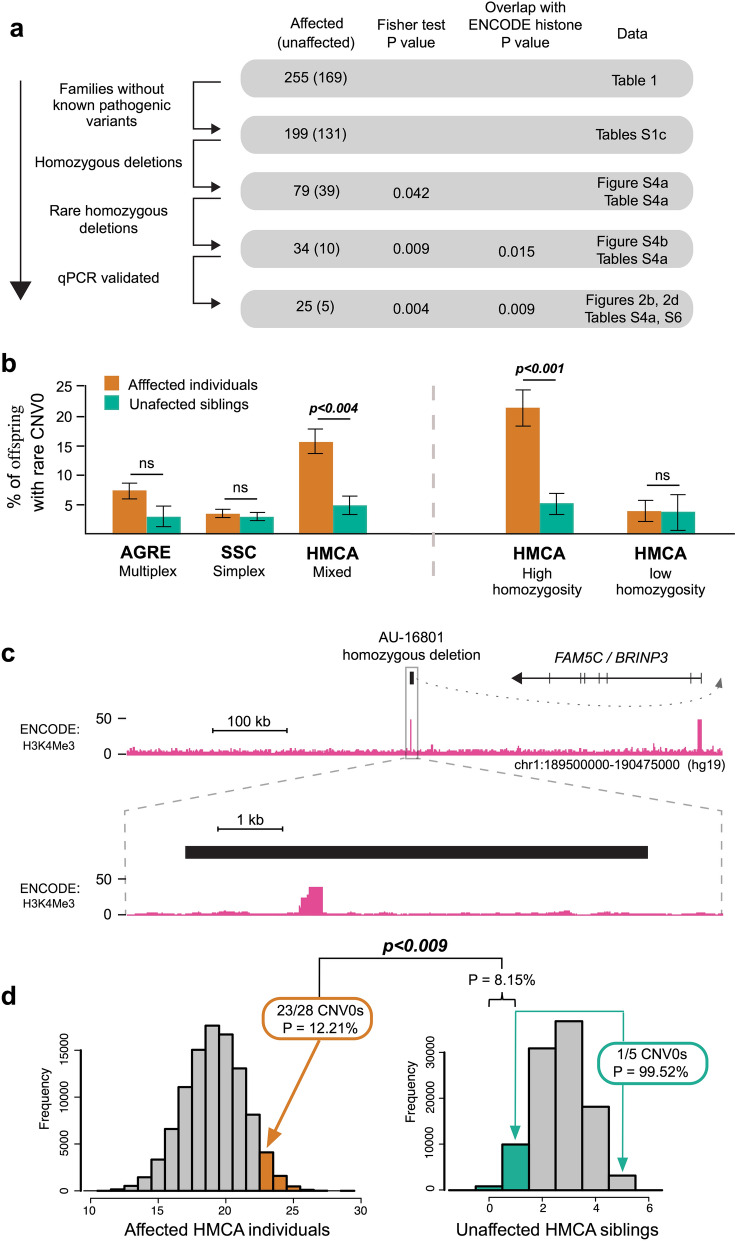
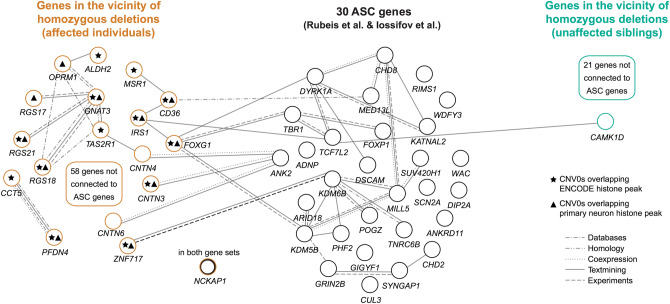
More than 98% of the human genome is made up of non-coding DNA, but techniques to ascertain its contribution to human disease have lagged far behind our understanding of protein coding variations. Autism spectrum disorder (ASD) has been mostly associated with coding variations via de novo single nucleotide variants (SNVs), recessive/homozygous SNVs, or de novo copy number variants (CNVs); however, most ASD cases continue to lack a genetic diagnosis. We analyzed 187 consanguineous ASD families for biallelic CNVs. Recessive deletions were significantly enriched in affected individuals relative to their unaffected siblings (17% versus 4%, p < 0.001). Only a small subset of biallelic deletions were predicted to result in coding exon disruption. In contrast, biallelic deletions in individuals with ASD were enriched for overlap with regulatory regions, with 23/28 CNVs disrupting histone peaks in ENCODE (p < 0.009). Overlap with regulatory regions was further demonstrated by comparisons to the 127-epigenome dataset released by the Roadmap Epigenomics project, with enrichment for enhancers found in primary brain tissue and neuronal progenitor cells. Our results suggest a novel noncoding mechanism of ASD, describe a powerful method to identify important noncoding regions in the human genome, and emphasize the potential significance of gene activation and regulation in cognitive and social function.


Conflict of interest statement

The authors declare no competing interests.

Figures

Figure 1
Figure 1
Homozygosity and de novo CNV rates in three different ASD collections. (a) Observed homozygosity in the HMCA, AGRE, and SSC: Distribution of recent homozygosity (homozygous intervals 5 cM or longer in autosomes) within individuals from each cohort. For display purposes, samples with no homozygosity are not shown. (b) Burden of rare de novo CNV events in three ASD collections. De novo copy number events are observed more frequently in affected individuals across all three cohorts, although within individual cohorts, it reaches statistical significance only in the SSC (Fisher test, one sided). Within the HMCA, high homozygosity families do not show an excess of de novo copy number mutation. Families with low homozygosity show a trend towards excess, but this does not reach significance likely due to sample size. Results are presented in a stacked bar plot (CNV1 bottom, CNV3 top, Probes ≥ 25). Numbers of samples and ratios for each comparison are shown in Table S2.
Figure 2
Figure 2
Homozygous deletions and relation to histone modification marks. (a) Selection of homozygous deletions (CNV0). We used a series of increasingly stringent selection criteria to compare CNV0 rate in affected individuals versus unaffected siblings and evaluate the overlap between biallelic deletions and ENCODE histone peaks. (b) Burden of rare homozygous deletions (CNV0) in three ASD collections (Table 1). Percentage of affected individuals and unaffected siblings with one or more rare biallelic events. Affected individuals show an elevated rate of biallelic deletions in all datasets. The difference is significant only in the HMCA collection (Fisher test, one sided) and is driven by consanguineous families (high homozygosity). The corresponding number of samples and ratios are shown in Table S4a. (c) Example of a non-coding biallelic deletion (AU-16801, Table 2). This particular homozygous deletion is approximately 7 kb in size, and it removes an H3K4Me3 histone modification mark in the vicinity of BRINP3 / FAM5C gene. The ENCODE profile shown represents the cell lines profiles available from UCSC. (d)  Empirical distribution of the number of coincidences in HCMA families between biallelic deletions and 3 histone modification marks (H3K4Me1, H3K4Me3, and H3K27Ac) as defined by the ENCODE project. We randomize location of qPCR confirmed biallelic deletions. For events denoted in the HMCA families (Table 2), the joint probability to observe such an enrichment/depletion pattern is p < 0.009. ENCODE regions are defined using a score ≥ 20, and conclusions are robust regarding the threshold (Table S6). Simulations excluded sex chromosomes and low marker coverage regions (Methods: J,K).
Figure 3
Figure 3
Overlap of homozygous deletions with regulatory regions defined by the Epigenome Roadmap Project. Illustrated are p-values for coincidence between non-coding homozygous deletions and epigenetic marks. Most significant correlations are observed among primary Brain cells and Neuronal profiles. We use 127 profiles provided by the Epigenome Roadmap Project (Table S7a) and the 15-state ChromHMM model to test enrichment/depletion of coincidences in affected/unaffected individuals (noncoding CNVs defined by KnownGene annotation). Similar results can be found in Supplemental Information using alternative gene annotations (RefGene and Ensembl, Figures S6a-b, Tables S7b-e).
Figure 4
Figure 4
Examples of overlap between non-coding biallelic deletions and histone peaks as defined by the ENCODE project. In addition, we show histone peaks derived by ChIP-seq data from Primary Neuron culture. ENCODE or Primary Neuron profiles shown in the figures represent the union of all cell lines available. Additional examples are presented in Figures S5a-c. (a) Non-coding biallelic deletion for sample AU-8101. The homozygous deletion removes the SCN7A promoter as defined by RNA-Seq data. (b) Non-coding biallelic deletion for sample AU-18101. Published chromatin interaction data obtained from human fibroblasts demonstrate that one broadly active element directly interacts with the IRS1 gene promoter. (c) Non-coding biallelic deletion for sample AU-19401 upstream of UNC5D, a gene encoding a receptor implicated in neuronal axon guidance and cell survival. (d) Non-coding biallelic deletion for sample AU-18301. The homozygous deletion interrupts a non-coding gene (NUTM2B-AS1), a broadly expressed antisense transcript on the opposite strand of NUTM2B.
Figure 5
Figure 5
Protein–Protein Interactions between genes in proximity to homozygous deletions and 30 ASC genes,. STRING identifies interactions between 21/30 ASC genes and 16/76 genes (11 affected individuals) in the neighborhood of qPCR validated biallelic deletions from Table 2 (p < 6e-5, see Figure S7c). In contrast, STRING predicts only one interaction between ASC genes and the 22 genes from 5 unaffected siblings (p = NS, Figure S7d). For display clarity, disconnected genes from individuals are excluded from the figure.

References

    1. Girirajan S, et al. Phenotypic heterogeneity of genomic disorders and rare copy-number variants. N. Engl. J. Med. 2012;367:1321–1331. - PMC - PubMed
    1. O'Roak BJ, et al. Multiplex targeted sequencing identifies recurrently mutated genes in autism spectrum disorders. Science. 2012;338:1619–1622. - PMC - PubMed
    1. Yu TW, et al. Using whole-exome sequencing to identify inherited causes of autism. Neuron. 2013;77:259–273. - PMC - PubMed
    1. Bailey A, et al. Autism as a strongly genetic disorder: evidence from a British twin study. Psychol. Med. 1995;25:63–77. - PubMed
    1. Newschaffer CJ, et al. The epidemiology of autism spectrum disorders. Annu. Rev. Public Health. 2007;28:235–258. - PubMed

Publication types