. 2020 Aug 20;10(1):14025.
doi: 10.1038/s41598-020-70860-y.

Rapid and quantitative antimalarial drug efficacy testing via the magneto-optical detection of hemozoin

Affiliations

Rapid and quantitative antimalarial drug efficacy testing via the magneto-optical detection of hemozoin

Petra Molnár et al. Sci Rep. .

Abstract

Emergence of resistant Plasmodium species makes drug efficacy testing a crucial part of malaria control. Here we describe a novel assay for sensitive, fast and simple drug screening via the magneto-optical detection of hemozoin, a natural biomarker formed during the hemoglobin metabolism of Plasmodium species. By quantifying hemozoin production over the intraerythrocytic cycle, we reveal that hemozoin formation is already initiated by ~ 6-12 h old ring-stage parasites. We demonstrate that the new assay is capable of drug efficacy testing with incubation times as short as 6-10 h, using synchronized P. falciparum 3D7 cultures incubated with chloroquine, piperaquine and dihydroartemisinin. The determined 50% inhibitory concentrations agree well with values established by standard assays requiring significantly longer testing time. Accordingly, we conclude that magneto-optical hemozoin detection provides a practical approach for the quick assessment of drug effect with short incubation times, which may also facilitate stage-specific assessment of drug inhibitory effects.


Conflict of interest statement

The authors declare no competing interests.

Figures

Figure 1
Figure 1
Comparison of drug susceptibility assay methods and their principle of detection. Blue and black stripes indicate the time intervals when the corresponding assays are typically carried out and when the detected parasite products are formed, respectively. Pictures below the chart represent parasite maturation during the 48 h of the intraerythrocytic cycle. The P. falciparum HRP2 and pLDH proteins are detected by ELISA and DELI methods. The HRP2 is secreted mostly during the second half of the intraerythrocytic cycle, while the pLDH expression starts during the early stages and finishes by the schizont stage,,,. The fluorescent SYBR Green dye is added to the samples after the incubation time to intercalate with the parasitic DNA. The RMOD assay exploits the detection of hemozoin, produced by the hemoglobin metabolism of the parasites from early hours of the intraerythrocytic cycle,, until the schizont stages.
Figure 2
Figure 2
Typical hemozoin production characteristics of P. falciparum 3D7. The black circles represent the average MO values measured on drug-free parasite cultures of 1% parasitemia as a function of the mean parasite age (for details see “Sample preparation for RMOD measurements” section.). The white area shows the typical error band of the hemozoin production curve. This includes the horizontal error due to the finite age distribution of the cultures and the uncertainty of age assessment, as well as the vertical error due to the scatter of MO values originating from independent assays (for details see “Optical microscopy and smear evaluation” section.). The blue/grey background shading indicates the development of the subsequent erythrocytic stages,. On the right, the progress of hemozoin formation is shown in percentages of the full amount produced during the first erythrocytic cycle. The microscopy images of infected RBCs shown below the graph are representative of the developmental stages observed at the corresponding time points.
Figure 3
Figure 3
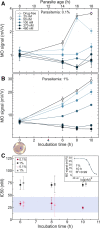
Inhibitory effect of piperaquine on P. falciparum 3D7 cultures as detected by RMOD assay. A,B MO values as a function of incubation time for the cultures with 0.1% and 1% parasitemia, respectively, incubated with various drug concentrations. The top axis shows the age of the parasites at the given sampling points determined by optical microscopic evaluation. Below the graph, an image shows the typical parasite stage at the starting point of the assay. The color coding of the curves indicates increasing drug concentrations from light to dark shades. The empty circles represent the drug-free control samples. Each data point represents the average of the MO values measured on triplicates. C IC50 values determined after 6, 8 and 10 h of incubation. Black and grey squares represent the IC50 values determined for the assay at 1% parasitemia in B and another independent assay of similar conditions, respectively. Red and pink circles show the IC50 values obtained from the assay of 0.1% parasitemia in A and another independent assay of similar conditions, respectively. The blue shaded area indicates the range of IC50 values reported in literature (Supplementary Table S1.). A representative dose–response fit curve corresponding to the 10 h time point of 1% assay is displayed in the top right corner of C.
Figure 4
Figure 4
Inhibitory effect of chloroquine on P. falciparum 3D7 and W2 cultures as measured by RMOD assay. A,B MO values of the P. falciparum 3D7 culture with 0.5% and 1% parasitemia incubated with various drug concentrations as a function of incubation time up to 48 h. The top axis shows the age of the parasites at the given sampling points, determined by optical microscopic evaluation. Below the graph, an image shows the typical parasite stage at the starting point of the assay. The color coding of the curves indicates the increasing drug concentrations from light to dark shades. The empty circles represent the drug-free control samples. Each circle represents the average of the MO values measured on triplicates. C IC50 values as a function of incubation time. IC50 values and the standard errors of their fit are represented by black squares in case of the 1% assay and grey squares in case of the 0.5% assay. The blue shaded area indicates the range of formerly reported IC50 values (Supplementary Table S1.),–,,–. The upper right corner shows a representative dose–response fit curve corresponding to the 20 h time point of the 1% assay. D MO values of the resistant P. falciparum W2 culture with 1% parasitemia incubated with various drug concentrations as a function of incubation time up to 48 h. The color coding of the curves indicates the increasing drug concentrations from light to dark shades. The empty squares represent the growth of samples treated with an ineffective drug dose (30–600 nM). Each circle represents the average of triplicates.
Figure 5
Figure 5
Inhibitory effect of dihydroartemisinin on P. falciparum 3D7 cultures as detected by RMOD assay. A MO values as a function of incubation time at 1% parasitemia incubated with various concentrations of dihydroartemisinin. The top axis shows the age of the parasites at the given sampling points, determined by optical microscopic evaluation. Below the graph, an image shows the typical parasite stage at the starting point of the assay. The color coding of the curves indicates the increasing drug concentrations from light to dark shades. The empty circles represent the growth of drug-free control samples. Each circle represents the average of the MO values measured on triplicates. B IC50 values of the dihydroartemisinin assay as a function of incubation time. The calculated values show a systematic increase during the complete intraerythrocytic cycle. The blue shaded area indicates the range of IC50 values reported earlier (Supplementary Table S1). The upper right corner shows a representative dose–response fit curve corresponding to the 32 h time point of the 1% assay.

Similar articles

Cited by

References

    1. Health Organization, W. Artemisinin resistance and artemisinin-based combination therapy efficacy (Status report—August 2018).
    1. Nsanzabana C, Djalle D, Guérin PJ, Ménard D, González IJ. Tools for surveillance of anti-malarial drug resistance: an assessment of the current landscape. Malar. J. 2018;17:1–16. - PMC - PubMed
    1. Eyasu M. Antimalarial drug resistance: in the past, current status and future perspectives. Br. J. Pharmacol. Toxicol. 2015;6:1–15.
    1. Laufer MK. Monitoring antimalarial drug efficacy: current challenges. Curr. Infect. Dis. Rep. 2009;11:59–65. - PMC - PubMed
    1. Sinha S, Sarma P, Sehgal R, Medhi B. Development in assay methods for in vitro antimalarial drug efficacy testing: a systematic review. Front. Pharmacol. 2017;8:1–14. - PMC - PubMed

Publication types