. 2020 Aug 20;10(1):14033.
doi: 10.1038/s41598-020-70959-2.

Autophagy regulates trophoblast invasion by targeting NF-κB activity

Affiliations

Autophagy regulates trophoblast invasion by targeting NF-κB activity

Soo-Young Oh et al. Sci Rep. .

Abstract

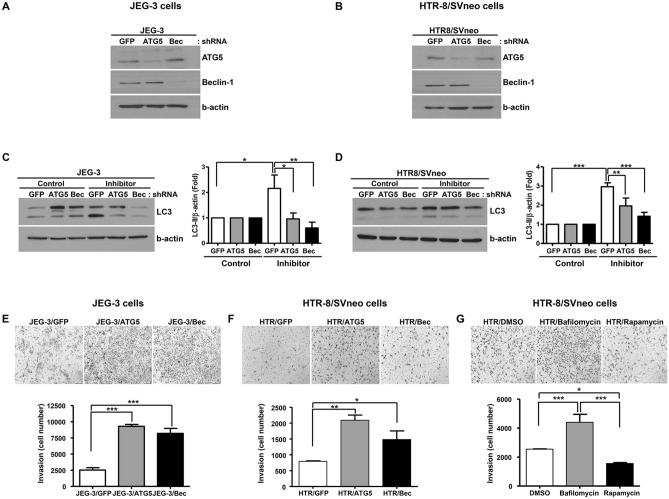
Preeclampsia is one of the most serious complications of pregnancy, affecting 5-10% of parturients worldwide. Recent studies have suggested that autophagy is involved in trophoblast invasion and may be associated with defective placentation underlying preeclampsia. We thus aimed to understand the mechanistic link between autophagy and trophoblast invasion. Using the two most commonly used trophoblast cell lines, JEG-3 and HTR-8/SVneo, we inhibited autophagy by ATG5 and beclin-1 shRNA. Conversion of LC3-II was evaluated in ATG5 and beclin-1 knock-down cells in the presence of the lysosomal protease inhibitors E-64d and pepstatin A, to detect the efficiency of autophagy inhibition. Upon autophagy inhibition, we measured cell invasion, activity of NF-κB and related signaling pathways, MMP-2, MMP-9, sFlt-1, and TNF-α levels. Autophagy inhibition increased the invasiveness of these trophoblastic cell lines and increased Akt and NF-κB activity as well as p65 expression. Of note, an NF-κB inhibitor significantly attenuated the trophoblast invasion induced by autophagy inhibition. Autophagy inhibition was also associated with increased MMP-2 and MMP-9 levels and decreased the production of sFlt-1 and TNF-α. Collectively, our results indicate that autophagy regulates trophoblast invasiveness in which the NF-κB pathway and MMP-2, MMP-9, sFlt-1 and TNF-α levels are affected.


Conflict of interest statement

The authors declare no competing interests.

Figures

Figure 1
Figure 1
Effects of autophagy inhibition on the invasive potential of JEG-3 and HTR-8/SVneo cells upon ATG5 or beclin-1 knockdown. (A,B) Western blot for ATG5 and beclin-1 upon treatment of ATG5 or beclin-1 shRNA in JEG-3 and HTR-8/SVneo cells. (C,D) Flux assay with a lysosomal protease inhibitor mixture, E-64d and pepstatin A, in JEG-3 and HTR-8/SVneo cells. Cells were treated with either the mixture of E-64d and pepstatin A or the vehicle, for 4 h. Three different experiments were performed and representative blots are shown with densitometric analysis for these experiments. The amount of LC3-II normalized to the amount of β-actin is represented by a bar graph (*p < 0.05, **p < 0.01, ***p < 0.001). (E,F) Invasion assays performed with JEG-3 and HTR-8/SVneo cells. Cells invading the Matrigel were stained with hematoxylin/eosin and counted under a microscope. Results of the invasion assay are represented in a bar graph generated with data obtained from three different experiments (n = 3, *p < 0.05; lower panel) and representative pictures from three different assays are shown in the upper panel.
Figure 2
Figure 2
Effects of autophagy inhibition by beclin-1 knockdown on NF-κB activity and MMP-2 and MMP-9 levels in JEG-3 and HTR-8/SVneo cells. (A,B) NF-κB activity upon treatment of beclin-1 shRNA in JEG-3 and HTR-8/SVneo cells. Cells expressing only GFP and beclin-1 shRNA were plated on 24-well plates and transfected with plasmids encoding NF-κB-Luc and pRL-SV40. Luciferase activity was measured using a dual luciferase reporter assay kit. Results are shown as the mean ± SEM of duplicate observations from three different experiments (n = 6, ***p < 0.001). (C,D) Invasion assays were performed with JEG-3 and HTR-8/SVneo cells in the presence of either an NF-κB inhibitor or control peptide. Invasive cells were stained with hematoxylin/eosin and counted under a microscope. Results of the invasion assay are represented in a bar graph generated with data obtained from three different experiments (n = 3, *p < 0.05, **p < 0.01) and representative pictures from three different assays are shown in the upper panel. (E,F) MMP-2 and MMP-9 levels were measured by ELISA in the media obtained from JEG-3 and HTR-8/SVneo stable cells upon control and beclin-1 shRNA treatment. Results are shown as the mean ± SEM of triplicate observations from three different experiments (n = 3, **p < 0.01, ***p < 0.001).
Figure 3
Figure 3
The expression of p65, phosphorylated Akt, and total Akt in autophagy-deficient JEG-3 and HTR-8/SVneo cells. (A,B) Western blot for p65, a subunit of NF-κB, in JEG-3 and HTR-8/SVneo cells expressing GFP or shRNA against ATG5 or beclin-1. The bar graph in the right panel represents p65 expression levels determined by densitometry, normalized to β-actin expression (n = 3, ***p < 0.001, **p < 0.01). (C,D) Phosphorylated Akt and total Akt were analyzed by Western blot using phospho-specific Akt antibody and anti-Akt antibody which recognizes both phosphorylated and unphosphorylated Akt. The bar graphs in the right panel represents phosphorylated and total Akt expression levels determined by densitometry, normalized to β-actin expression (n = 3, ***p < 0.001, **p < 0.01, *p < 0.05).
Figure 4
Figure 4
The levels of sFlt-1 and TNF-α in autophagy-deficient JEG-3 and HTR-8/SVneo cells. (A,B) sFlt-1 levels were measured by ELISA in the media obtained from JEG-3 and HTR-8/SVneo stable cells upon treatment of ATG5 or beclin-1 shRNA. Results are shown as the mean ± SEM of triplicate observations from three different experiments (n = 3, *p < 0.05, ***p < 0.001). (C,D) TNF-α levels were measured by ELISA in the media obtained from JEG-3 and HTR-8/SVneo stable cells upon treatment of ATG5 or beclin-1 shRNA in JEG-3 and HTR-8/SVneo cells. Results are shown as the mean ± SEM of triplicate observations from three different experiments (n = 3, *p < 0.05, **p < 0.01).

References

    1. Redman CW, Sargent IL. Latest advances in understanding preeclampsia. Science. 2005;308:1592–1594. doi: 10.1126/science.1111726. - DOI - PubMed
    1. Pijnenborg R, Bland JM, Robertson WB, Brosens I. Uteroplacental arterial changes related to interstitial trophoblast migration in early human pregnancy. Placenta. 1983;4:397–413. doi: 10.1016/S0143-4004(83)80043-5. - DOI - PubMed
    1. Kadyrov M, Kingdom JC, Huppertz B. Divergent trophoblast invasion and apoptosis in placental bed spiral arteries from pregnancies complicated by maternal anemia and early-onset preeclampsia/intrauterine growth restriction. Am. J. Obstet. Gynecol. 2006;194:557–563. doi: 10.1016/j.ajog.2005.07.035. - DOI - PubMed
    1. Kang R, Zeh HJ, Lotze MT, Tang D. The Beclin 1 network regulates autophagy and apoptosis. Cell Death Differ. 2011;18:571–580. doi: 10.1038/cdd.2010.191. - DOI - PMC - PubMed
    1. Palhegyi AM, Seranova E, Dimova S, Hoque S, Sarkar S. Biomedical implications of autophagy in macromolecule storage disorders. Front. Cell Dev. Biol. 2019;7:179. doi: 10.3389/fcell.2019.00179. - DOI - PMC - PubMed

Publication types