

Peripheral serum metabolomic profiles inform central cognitive impairment
- PMID: 32820198
- PMCID: PMC7441317
- DOI: 10.1038/s41598-020-70703-w
Peripheral serum metabolomic profiles inform central cognitive impairment
Abstract
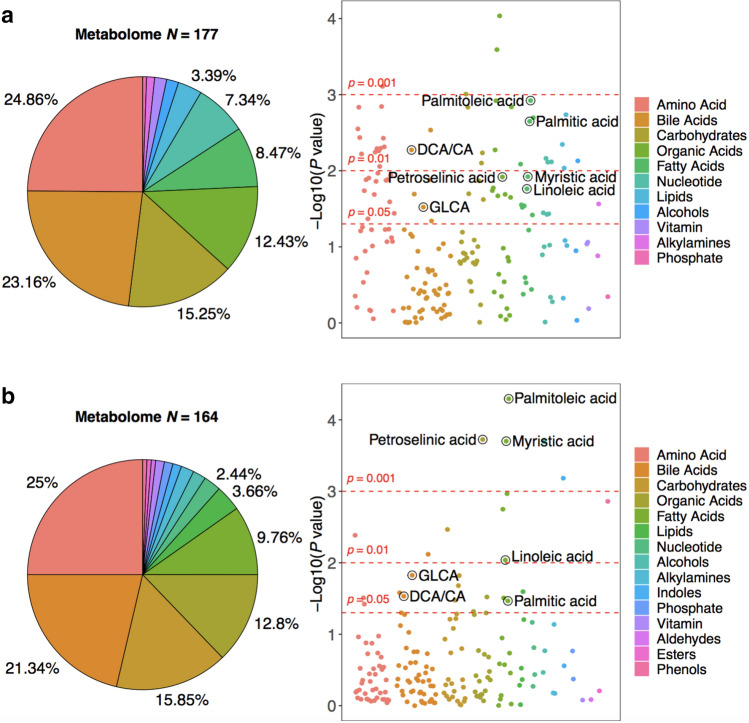
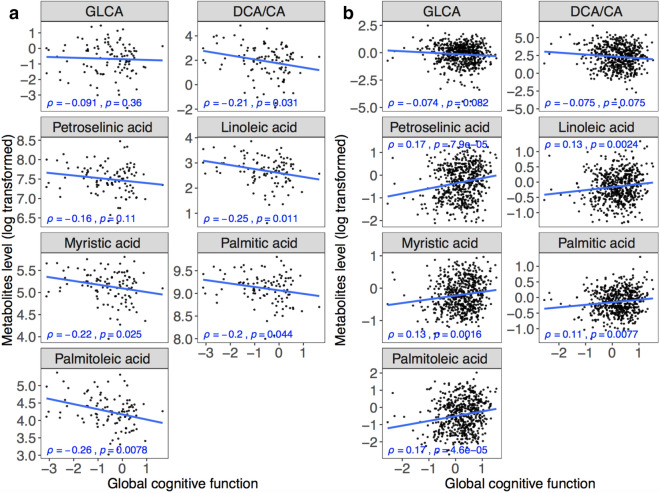
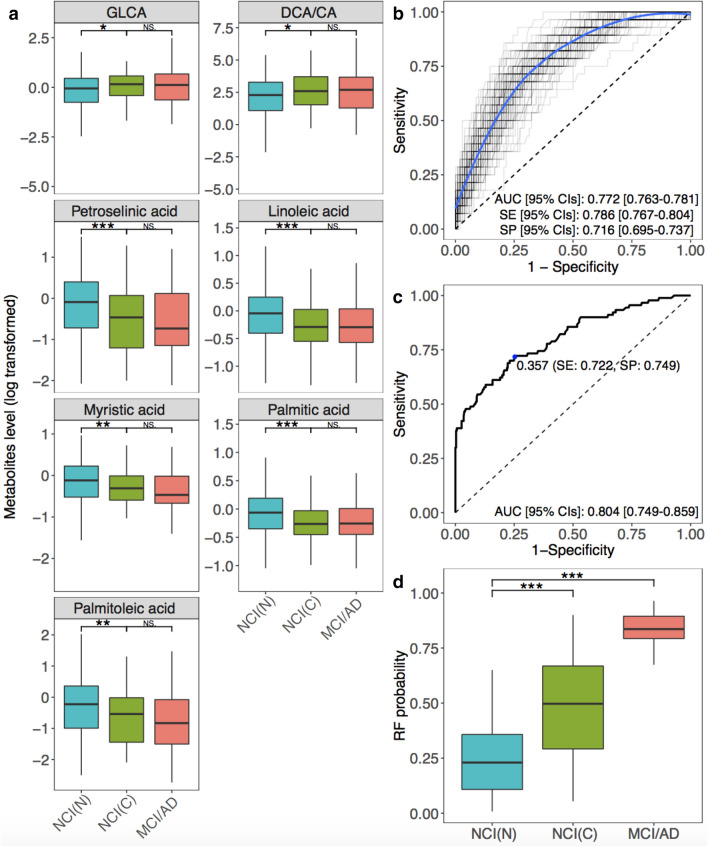
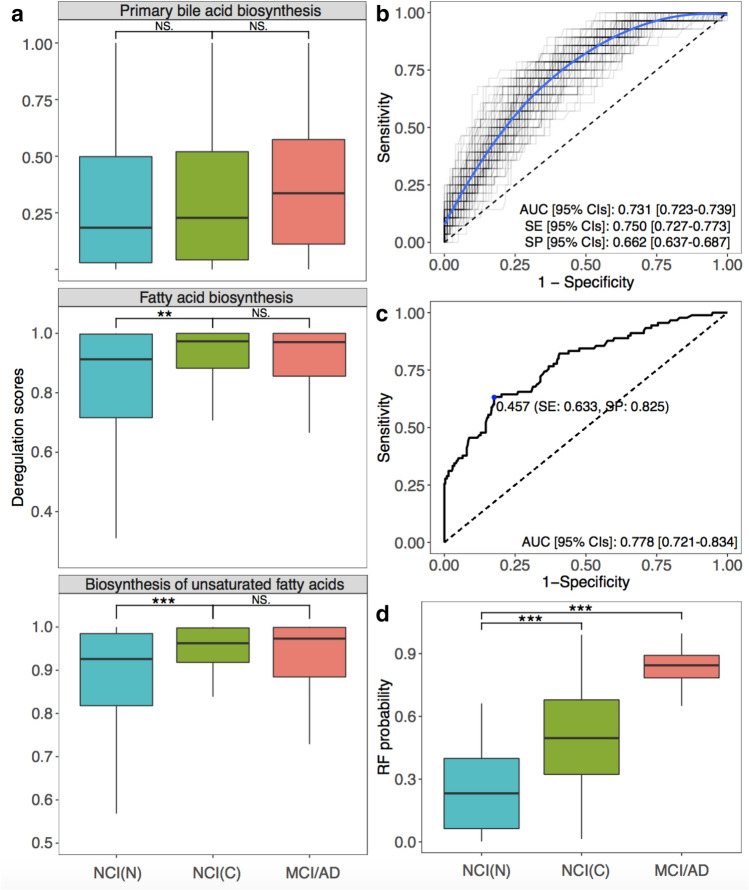
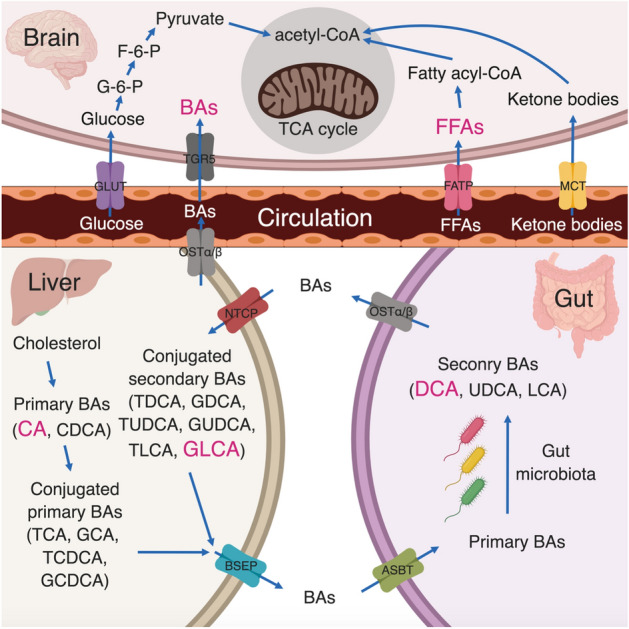
The incidence of Alzheimer's disease (AD) increases with age and is becoming a significant cause of worldwide morbidity and mortality. However, the metabolic perturbation behind the onset of AD remains unclear. In this study, we performed metabolite profiling in both brain (n = 109) and matching serum samples (n = 566) to identify differentially expressed metabolites and metabolic pathways associated with neuropathology and cognitive performance and to identify individuals at high risk of developing cognitive impairment. The abundances of 6 metabolites, glycolithocholate (GLCA), petroselinic acid, linoleic acid, myristic acid, palmitic acid, palmitoleic acid and the deoxycholate/cholate (DCA/CA) ratio, along with the dysregulation scores of 3 metabolic pathways, primary bile acid biosynthesis, fatty acid biosynthesis, and biosynthesis of unsaturated fatty acids showed significant differences across both brain and serum diagnostic groups (P-value < 0.05). Significant associations were observed between the levels of differential metabolites/pathways and cognitive performance, neurofibrillary tangles, and neuritic plaque burden. Metabolites abundances and personalized metabolic pathways scores were used to derive machine learning models, respectively, that could be used to differentiate cognitively impaired persons from those without cognitive impairment (median area under the receiver operating characteristic curve (AUC) = 0.772 for the metabolite level model; median AUC = 0.731 for the pathway level model). Utilizing these two models on the entire baseline control group, we identified those who experienced cognitive decline in the later years (AUC = 0.804, sensitivity = 0.722, specificity = 0.749 for the metabolite level model; AUC = 0.778, sensitivity = 0.633, specificity = 0.825 for the pathway level model) and demonstrated their pre-AD onset prediction potentials. Our study provides a proof-of-concept that it is possible to discriminate antecedent cognitive impairment in older adults before the onset of overt clinical symptoms using metabolomics. Our findings, if validated in future studies, could enable the earlier detection and intervention of cognitive impairment that may halt its progression.
Conflict of interest statement
R.K.D. is inventor on key patents in the field of metabolomics including applications for Alzheimer disease. M.A., R.B., and X.H. are co-inventors on patent WO2018049268 in this field. All other authors report no disclosures.
Figures
Similar articles
-
Association between fatty acid metabolism in the brain and Alzheimer disease neuropathology and cognitive performance: A nontargeted metabolomic study.PLoS Med. 2017 Mar 21;14(3):e1002266. doi: 10.1371/journal.pmed.1002266. eCollection 2017 Mar. PLoS Med. 2017. PMID: 28323825 Free PMC article.
-
Brain and blood metabolite signatures of pathology and progression in Alzheimer disease: A targeted metabolomics study.PLoS Med. 2018 Jan 25;15(1):e1002482. doi: 10.1371/journal.pmed.1002482. eCollection 2018 Jan. PLoS Med. 2018. PMID: 29370177 Free PMC article.
-
Dysregulation of multiple metabolic networks related to brain transmethylation and polyamine pathways in Alzheimer disease: A targeted metabolomic and transcriptomic study.PLoS Med. 2020 Jan 24;17(1):e1003012. doi: 10.1371/journal.pmed.1003012. eCollection 2020 Jan. PLoS Med. 2020. PMID: 31978055 Free PMC article.
-
Metabolic Profiling of Neocortical Tissue Discriminates Alzheimer's Disease from Mild Cognitive Impairment, High Pathology Controls, and Normal Controls.J Proteome Res. 2021 Sep 3;20(9):4303-4317. doi: 10.1021/acs.jproteome.1c00290. Epub 2021 Aug 6. J Proteome Res. 2021. PMID: 34355917 Free PMC article.
-
Untargeted Metabolomic Profiling Reveals Differentially Expressed Serum Metabolites and Pathways in Type 2 Diabetes Patients with and without Cognitive Decline: A Cross-Sectional Study.Int J Mol Sci. 2024 Feb 13;25(4):2247. doi: 10.3390/ijms25042247. Int J Mol Sci. 2024. PMID: 38396924 Free PMC article.
Cited by
-
Effects of a ketogenic and low-fat diet on the human metabolome, microbiome, and foodome in adults at risk for Alzheimer's disease.Alzheimers Dement. 2023 Nov;19(11):4805-4816. doi: 10.1002/alz.13007. Epub 2023 Apr 5. Alzheimers Dement. 2023. PMID: 37017243 Free PMC article.
-
Tauroursodeoxycholic acid: a bile acid that may be used for the prevention and treatment of Alzheimer's disease.Front Neurosci. 2024 Feb 19;18:1348844. doi: 10.3389/fnins.2024.1348844. eCollection 2024. Front Neurosci. 2024. PMID: 38440398 Free PMC article. Review.
-
Aging biomarkers and the brain.Semin Cell Dev Biol. 2021 Aug;116:180-193. doi: 10.1016/j.semcdb.2021.01.003. Epub 2021 Jan 25. Semin Cell Dev Biol. 2021. PMID: 33509689 Free PMC article. Review.
-
TRPV1 regulates ApoE4-disrupted intracellular lipid homeostasis and decreases synaptic phagocytosis by microglia.Exp Mol Med. 2023 Feb;55(2):347-363. doi: 10.1038/s12276-023-00935-z. Epub 2023 Feb 1. Exp Mol Med. 2023. PMID: 36720919 Free PMC article.
-
Comparison of Deep Learning and Traditional Machine Learning Models for Predicting Mild Cognitive Impairment Using Plasma Proteomic Biomarkers.Int J Mol Sci. 2025 Mar 8;26(6):2428. doi: 10.3390/ijms26062428. Int J Mol Sci. 2025. PMID: 40141072 Free PMC article.
References
-
- Qiu C, De Ronchi D, Fratiglioni L. The epidemiology of the dementias: an update. Curr. Opin. Psychiatry. 2007;20:380–385. - PubMed
-
- Murphy, S. L., Xu, J., Kochanek, K. D. & Arias, E. Mortality in the United States, 2017. NCHS Data Brief (2018). - PubMed
-
- Graham WV, Bonito-Oliva A, Sakmar TP. Update on Alzheimer’s disease therapy and prevention strategies. Annu. Rev. Med. 2017;68:413–430. - PubMed
-
- Hulstaert F, et al. Improved discrimination of AD patients using -amyloid(1–42) and tau levels in CSF. Neurology. 1999;52:1555–1555. - PubMed
Publication types
MeSH terms
Grants and funding
LinkOut - more resources
Full Text Sources
