Observational Study
. 2020 Aug 21:9:e60675.
doi: 10.7554/eLife.60675.

Differential occupational risks to healthcare workers from SARS-CoV-2 observed during a prospective observational study

Collaborators, Affiliations
Observational Study

Differential occupational risks to healthcare workers from SARS-CoV-2 observed during a prospective observational study

David W Eyre et al. Elife. .

Abstract

We conducted voluntary Covid-19 testing programmes for symptomatic and asymptomatic staff at a UK teaching hospital using naso-/oro-pharyngeal PCR testing and immunoassays for IgG antibodies. 1128/10,034 (11.2%) staff had evidence of Covid-19 at some time. Using questionnaire data provided on potential risk-factors, staff with a confirmed household contact were at greatest risk (adjusted odds ratio [aOR] 4.82 [95%CI 3.45-6.72]). Higher rates of Covid-19 were seen in staff working in Covid-19-facing areas (22.6% vs. 8.6% elsewhere) (aOR 2.47 [1.99-3.08]). Controlling for Covid-19-facing status, risks were heterogenous across the hospital, with higher rates in acute medicine (1.52 [1.07-2.16]) and sporadic outbreaks in areas with few or no Covid-19 patients. Covid-19 intensive care unit staff were relatively protected (0.44 [0.28-0.69]), likely by a bundle of PPE-related measures. Positive results were more likely in Black (1.66 [1.25-2.21]) and Asian (1.51 [1.28-1.77]) staff, independent of role or working location, and in porters and cleaners (2.06 [1.34-3.15]).

Keywords: Covid-19; SARS-CoV-2; epidemiology; global health; healthcare workers; risk factors; serology; symptoms; virus.


Conflict of interest statement

DE Lecture fees from Gilead, outside the submitted work, SL, DO, MC, ES, EL, FW, TJ, SC, AH, GD, SH, JK, KC, PF, JS, DV, FY, NS, PM, MD, TD, RS, LP, LD, AV, AA, BY, PD, AM, DS, FK, MN, MA, AB, NJ, LM, TC, BM, SH, RC, DC, DS, GS, TP, BH, AO, DE, CC, KJ, TW No competing interests declared

Figures
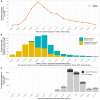
Figure 1.
Figure 1.. Epidemiological curve for hospital inpatients (panel A) and staff (panel B) diagnosed with Covid-19, by week and timing of asymptomatic staff testing (panel C).
Each patient admitted to hospital with a diagnosis of Covid-19 within ±7 days of any day during their admission is plotted based on the date of their positive PCR test. Testing for symptomatic staff was made available from 27th March 2020; staff were asked to attend on days 2–4 of symptoms and are plotted in the week of their positive test. Of 1128 staff positive by PCR or serology at the asymptomatic staff clinic, 192 had been previously diagnosed at the symptomatic staff clinic. Of the remaining 936 positive staff, 449 (48%) reported a date when they believed a Covid-19 illness had begun, these are plotted in yellow above, many with symptoms before the availability of staff testing. As 487 (52%) of staff did not provide a date of symptom onset the true values for the yellow bars on the y-axis are likely to be around two times higher. Panel C shows the week asymptomatic staff were tested, those testing SARS-CoV-2 PCR-positive and/or IgG-positive are shown in black and those with negative tests in grey. The overall percentage of staff tested each week with positive PCR and/or antibody results is shown above each bar. The bar for 01 June also includes 31 staff tested on 08 June.
Figure 2.
Figure 2.. Proportion of staff and patients remaining PCR-positive on repeat nasopharyngeal swabs.
Panel A shows pooled data and Panel B data separately for staff and patients. The number of individuals with a repeat test in each time interval is shown below each bar and 95% exact binomial confidence intervals are plotted. All tests following a first positive sample are included up until the first negative sample per patient. The number of tests positive after a repeat swab on the same day is indicative of the sensitivity of a single swab, 15/16 of these swabs were obtained from patients on wards by any available staff member, whereas staff sampling was undertaken by specially trained teams.
Figure 3.
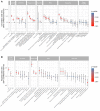
Figure 3.. Univariable (panel A) and multivariable (panel B) relationships between risk factors and staff infection with SARS-CoV-2 in 10,032 healthcare workers.
See Supplementary file 1B for count data, univariable and multivariable odds ratios. Pairwise interactions were sought between all variables the multivariable model, a single interaction exceeded the p<0.01 screening threshold, representing decreased risk of Covid-19 in emergency department staff reporting exposure to a Covid-19 without PPE (p=0.002). However, given the large number of interactions sought and biological implausibility, the interaction is omitted from the model presented. For the purpose of plotting p values <0.001 were rounded up to 0.001. Risk factor data were not available for two staff members. In panel A, the category for 01 June also includes 31 staff tested on 08 June.
Figure 4.
Figure 4.. Proportion of staff testing positive by specialty area.
The number of staff tested within each speciality is shown within each bar. The error bar indicates the 95% confidence interval. The ‘Other’ group includes staff members without a self-reported specialty. Staff working in a specialty area are predominantly nurses, healthcare assistances, doctors and therapists.
Figure 5.
Figure 5.. Proportion of staff testing positive by role.
The number of staff tested within each role is shown within each bar. The error bar indicates the 95% confidence interval.
Figure 6.
Figure 6.. Relationship between age and Covid-19 infection in hospital staff.
Panel A shows a histogram of staff ages for those attending asymptomatic screening, staff with a positive SARS-CoV-2 IgG antibody and/or PCR test at their first asymptomatic clinic attendance as shown in blue and those who were both PCR and antibody negative are shown in red. Panel B shows the univariable modelled percentage of staff positive by age, the solid line shows the expected value and the ribbon the 95% confidence interval.
Figure 7.
Figure 7.. Proportion of staff testing positive by self-described ethnicity.
The number of staff tested within each group is shown within each bar. The error bar indicates the 95% confidence interval.
Figure 8.
Figure 8.. Proportion of staff infected by extent of Covid-19 infectious pressure from patients, by eight hospital buildings across four hospitals (panel A) and by ward (panel B).
Covid-19 infectious pressure was calculated by considering each patient infectious from −2 to +7 days around the date of their first positive SARS-CoV-2 PCR test. Only staff working in a single hospital or ward are included in the plot. Wards with fewer than 10 staff tested are not plotted. Covid-19 cohort wards admitted only patients with suspected or known Covid-19, whereas Covid-19 general wards were acute medical wards receiving new admissions and acute medical patients initially believed not to have Covid-19. Non Covid-19 areas did not admit suspected Covid-19 patients and any suspected or confirmed Covid-19 patients were transferred off these wards as soon as possible.

References

    1. Adams ER, Ainsworth M, Anand R, Andersson MI, Auckland K, Baillie JK, Barnes E, Beer S, Bell JI, Berry T, Bibi S, Carroll M, Chinnakannan SK, Clutterbuck E, Cornall RJ, Crook DW, de Silva T, Dejnirattisai W, Dingle KE, Dold C, Espinosa A, Eyre DW, Farmer H, Fernandez Mendoza M, Georgiou D, Hoosdally SJ, Hunter A, Jefferey K, Kelly D, Klenerman P, Knight J, Knowles C, Kwok AJ, Leuschner U, Levin R, Liu C, López-Camacho C, Martinez J, Matthews PC, McGivern H, Mentzer AJ, Milton J, Mongkolsapaya J, Moore SC, Oliveira MS, Pereira F, Perez E, Peto T, Ploeg RJ, Pollard A, Prince T, Roberts DJ, Rudkin JK, Sanchez V, Screaton GR, Semple MG, Slon-Campos J, Skelly DT, Smith EN, Sobrinodiaz A, Staves J, Stuart DI, Supasa P, Surik T, Thraves H, Tsang P, Turtle L, Walker AS, Wang B, Washington C, Watkins N, Whitehouse J, National COVID Testing Scientific Advisory Panel Antibody testing for COVID-19: a report from the National COVID Scientific Advisory Panel. Wellcome Open Research. 2020;5:139. doi: 10.12688/wellcomeopenres.15927.1. - DOI - PMC - PubMed
    1. Aerosol Generating Procedures Health protection Scotland and NHS Scotland. [June 17, 2020];2020 https://hpspubsrepo.blob.core.windows.net/hps-website/nss/2893/documents...
    1. Disparities in the risk and outcomes from COVID-19 Public health England. [June 12, 2020];2020 https://assets.publishing.service.gov.uk/government/uploads/system/uploa...
    1. Folgueira MD, Munoz-Ruiperez C, Alonso-Lopez MA, Delgado R. SARS-CoV-2 infection in health care workers in a large public hospital in Madrid, Spain. medRxiv. 2020 doi: 10.1101/2020.04.07.20055723. - DOI
    1. Galan I, Velasco M, Casas ML, Goyanes MJ, Rodriguez-Caravaca G, Losa JE. SARS-CoV-2 seroprevalence among all workers in a teaching hospital in Spain: unmasking the risk. medRxiv. 2020 doi: 10.1101/2020.05.29.20116731. - DOI

Publication types

MeSH terms