. 2020 Aug 21:9:e54693.
doi: 10.7554/eLife.54693.

Senotherapeutic drugs for human intervertebral disc degeneration and low back pain

Affiliations

Senotherapeutic drugs for human intervertebral disc degeneration and low back pain

Hosni Cherif et al. Elife. .

Abstract

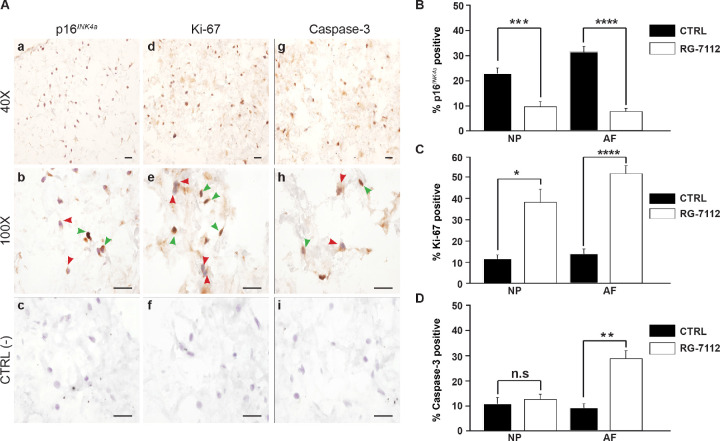
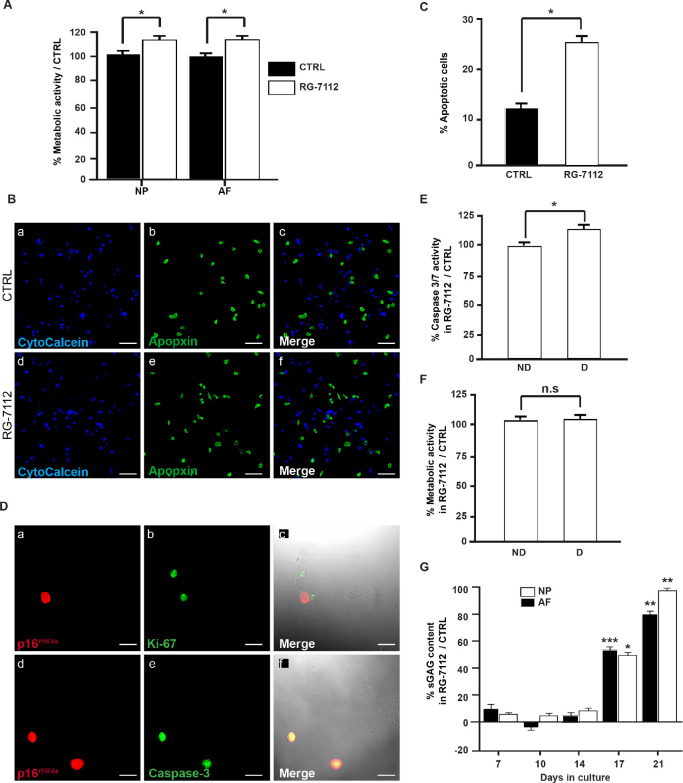
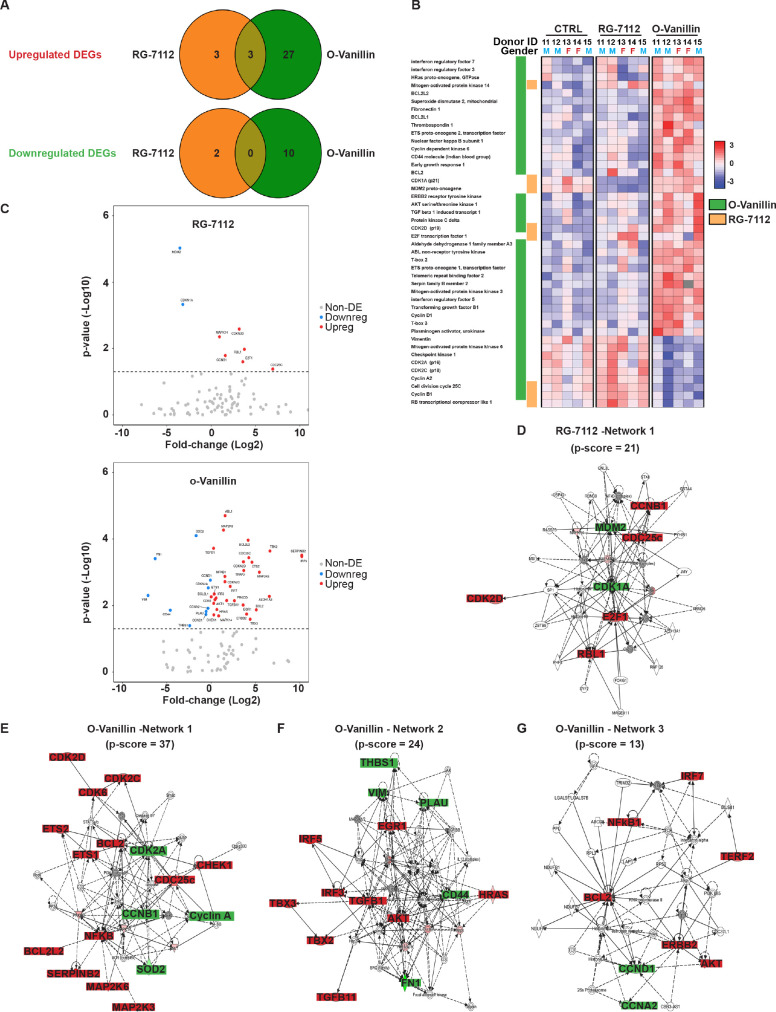
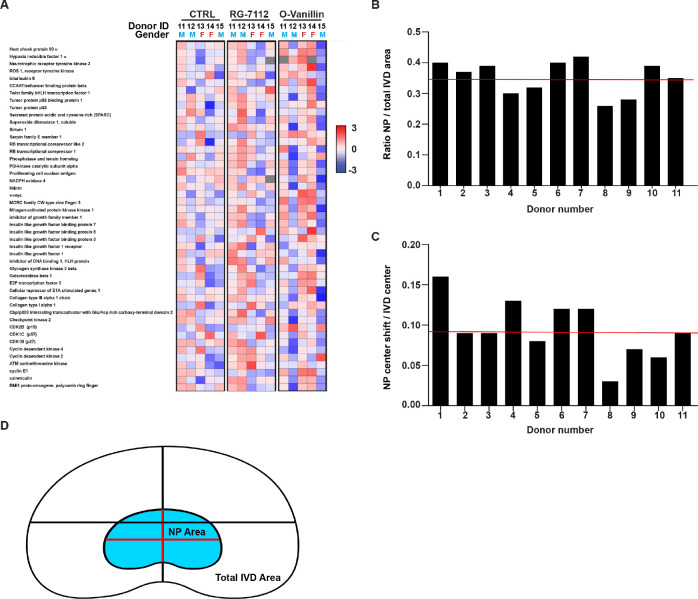
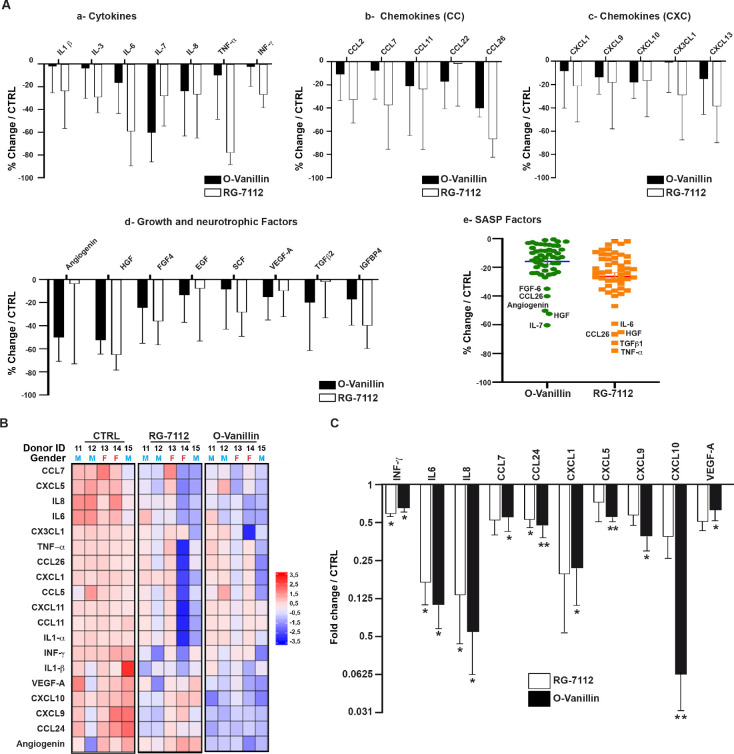
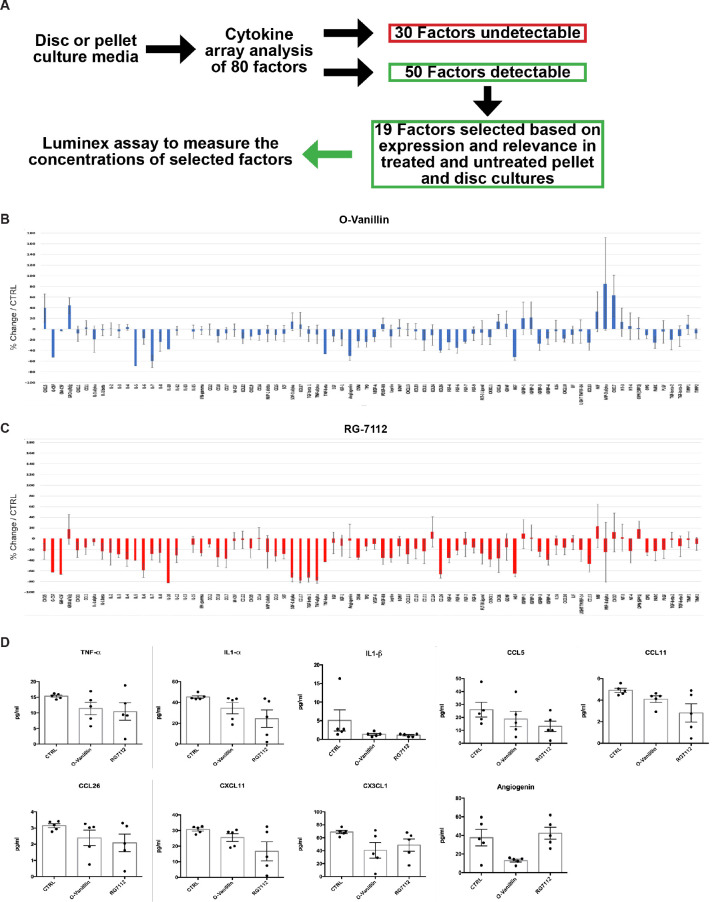
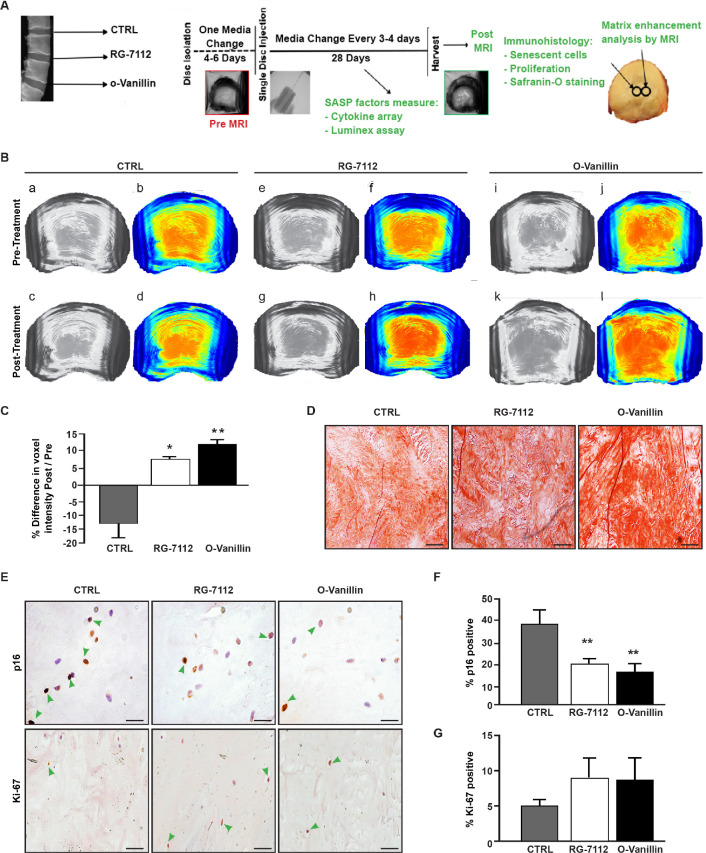
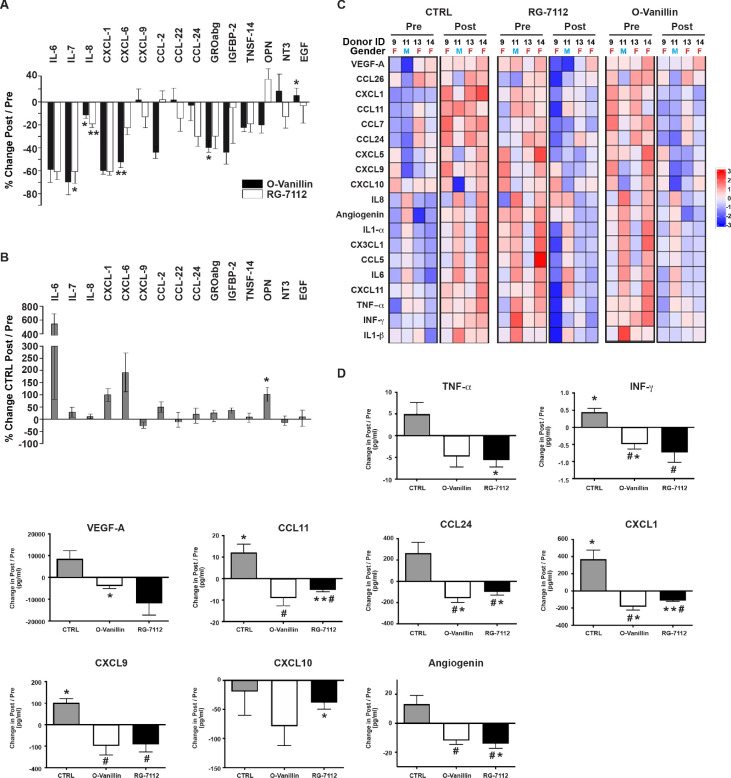
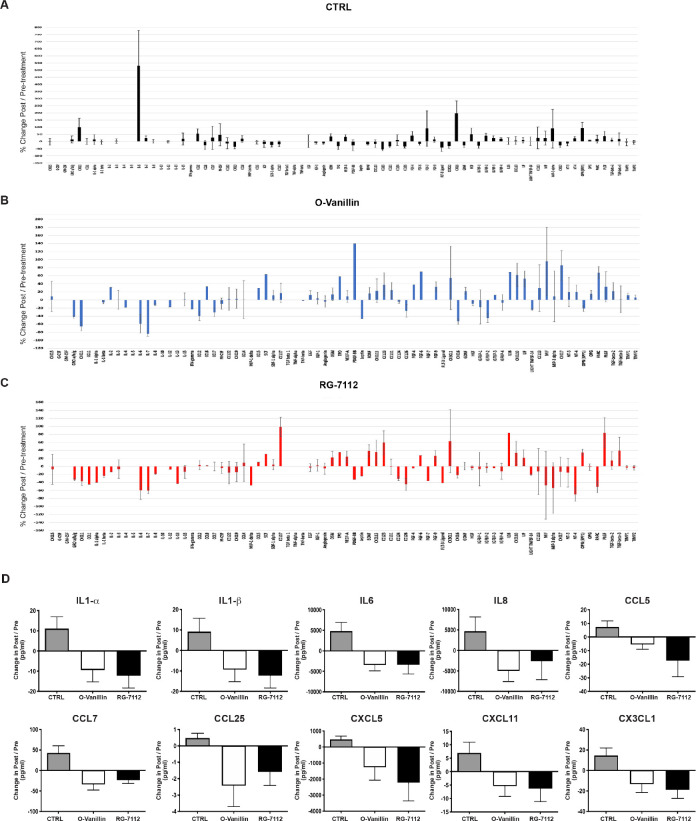
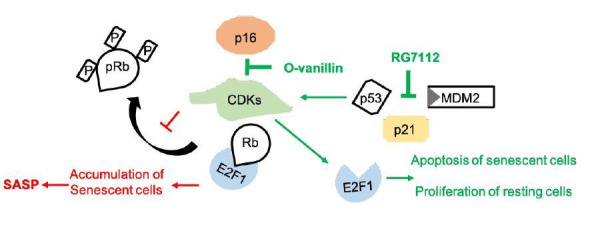
Cellular senescence is a contributor to intervertebral disc (IVD) degeneration and low back pain. Here, we found that RG-7112, a potent mouse double-minute two protein inhibitor, selectively kills senescent IVD cells through apoptosis. Gene expression pathway analysis was used to compare the functional networks of genes affected by RG-7112, a pure synthetic senolytic with o-Vanillin a natural and anti-inflammatory senolytic. Both affected a functional gene network related to cell death and survival. O-Vanillin also affected networks related to cell cycle progression as well as connective tissue development and function. Both senolytics effectively decreased the senescence-associated secretory phenotype (SASP) of IVD cells. Furthermore, bioavailability and efficacy were verified ex vivo in the physiological environment of degenerating intact human discs where a single dose improved disc matrix homeostasis. Matrix improvement correlated with a reduction in senescent cells and SASP, supporting a translational potential of targeting senescent cells as a therapeutic intervention.

Keywords: annulus fibrosus; cartilage; cell biology; human; intervertebral disc; medicine; nucleus pulposus.

Plain language summary

Pain in the lower back affects about four in five people during their lifetime. Over time, the discs that provide cushioning between the vertebrae of the spine can degenerate, which can be one of the major causes of lower back pain. It has been shown that when the cells of these discs are exposed to different stress factors, they stop growing and become irreversibly dormant. Such ‘senescent’ cells release a range of proteins and small molecules that lead to painful inflammation and further degeneration of the discs. Moreover, it is thought that a high number of senescent cells may be linked to other degenerative diseases such as arthritis. Current treatments can only reduce the severity of the symptoms, but they cannot prevent the degeneration from progressing. Now, Cherif et al. set out to test the effects of two different compounds on human disc cells grown in the laboratory. One of the molecules studied, RG-7112, is a synthetic drug that has been approved for safety by the US Food and Drug Administration and has been shown to remove senescent cells. The other, o-Vanillin, is a natural compound that has anti-inflammatory and anti-senescence properties. The results showed that both compounds were able to trigger changes to that helped new, healthy cells to grow and at the same time kill senescent cells. They also reduced the production of molecules linked to inflammation and pain. Further analyses revealed that the compounds were able to strengthen the fibrous matrix that surrounds and supports the discs. Cherif et al. hope that this could form the basis for a new family of drugs for back pain to slow the degeneration of the discs and reduce pain. This may also have benefits for other similar degenerative diseases caused by cell senescence, such as arthritis.


Conflict of interest statement

HC, DB, MM, OR, JO, LH No competing interests declared

Figures

Figure 1.
Figure 1.. RG-7112 treatment of IVD pellet cultures.
(A) Representative images indicating how we deemed positive and negative p16INK4a (a), Ki-67 (d), and caspase-3 (g) staining. (b, e and h) Magnified images of (a, d and g). Arrow heads indicate positive (green) and negative (red) staining. (c, f and i) no secondary antibody control photomicrographs. Quantification of (B) p16INK4a (n = 7), (C) Ki-67, and (D) caspase-3 expression, (n = 8). Scale bars: 20 μm in (A). The cells were from degenerating IVDs as indicated in Table 2. Values are presented as mean ± SEM in (B–D). * Indicates a significant difference assessed by the two-tailed Student's t-test: p<0.05; **p<0.01 and ****p<0.0001.
Figure 1—figure supplement 1.
Figure 1—figure supplement 1.. Senolytic activity of RG-7112 on human IVD cells in vitro.
(A) Metabolic activity in control and treated NP and AF pellet cultures from degenerate IVDs (n = 6). (B) Representative photomicrographs of untreated (a–c) and RG-7112 treated (d–f) NP cells stained for cytocalcein (viable), apopxin (apoptotic) and merged images. (C) Quantification of apoptosis in treated and control groups (n = 3). (D) p16INK4a separate-staining with Ki-67 (a–c) and colocalization with caspase-3 (d–f) in NP cells (n = 3). (E) RG-7112 (5 μM) selectively induced apoptosis in degenerate NP cells compared to non-mildly-degenerate as measured by the caspase 3/7 activity kit. The results are expressed as a percentage compared to the untreated control (n = 8). (F) Alamar blue assay comparison of the effect of RG-7112 (5 μM) on the viability of degenerate and non-degenerate NP cells. Results are presented as fold-change compared to the control (n = 8). (G) Glycosaminoglycan (sGAG) levels in the NP and AF-treated pellet media at days 7, 14, 21 and 28 were assessed by DMMB. GAG release was normalized to day 0 GAG concentration and then to the sGAG concentration of untreated culture media (n = 6). Scale bars: 50 μm in (B) and 25 μm (D). Values are presented as mean ± SEM in (A, C, E, F and F). Data was analyzed by Student’s t-tests to compare two groups. * indicates a significant difference of p<0.05, ** of p<0.01 and *** of p<0.001.
Figure 2.
Figure 2.. Differentially expressed senescence related genes in NP pellets.
(A) Venn diagrams of the differentially up and downregulated genes among the different groups. O-Vanillin, RG-7112-treated NP cells in pellets culture. For Upregulated genes odds ratio (OR) = 2.13 and p=0.39; for Downregulated genes: OR = 0 and p=1. (B) Heatmap of the top 44 over and under expressed genes in control (CTRL), RG-7112 and o-Vanillin-treated NP cells. All genes shown were first normalized to the housekeeping gene GAPDH. Data shown are relative to the calculated Z scores across the samples (see Materials and methods) and ranked by significance adjusted to p<0.05. Red represents relatively high levels of expression; blue represents relatively low levels of expression. Significantly differentially expressed genes are indicated with green lines for o-Vanillin and in orange lines for RG-7112. Each column represents one individual (for a total of n = 5 per group) and each row represents expression of a single gene. Donor ID and gender are indicated for each subject. (C) Volcano plots of mRNA expression of o-Vanillin and RG-7112 treated NP pellets: Plotted along the x-axis is the mean of log2 fold-change, along the y-axis the negative log10 of the p-values. Blue circles refer to downregulated genes, red circles refer to upregulated genes and grey circles to non-DEGs in o-Vanillin and RG-7112-treated NP pellets. The horizontal grey line is the negative logarithm of the t-test-adjusted p-value threshold (-log10 of p=0.05). (D) IPA diagrams of differentially expressed genes in RG-7112 and (E–G) o-Vanillin-treated NP pellets within the selected set of 91 genes. Direct and indirect interactions are shown by solid lines and dashed lines respectively. Green indicates gene downregulation; red depicts upregulation and molecules found by the data mining tools of IPA (build tools) are shown in gray. Color intensity represents the average of log2 fold change with brighter colors representing a more significant difference between treated and controls. Symbols for each molecule are presented according to molecular functions and type of interactions. Functional assignations attributed by IPA software. Significant difference set at p<0.05 was assessed by repeated measures Analysis of Variance (ANOVA) with Turkey’s post hoc test for multiple pairwise comparison in (B–C) and Fisher’s exact test in (A, D–G). The cells were from degenerating IVDs as indicated in Table 2.
Figure 2—figure supplement 1.
Figure 2—figure supplement 1.. Non differentially expressed genes Heatmap and NP area measure in human IVD.
(A) 47 genes did not show significant expression change in RG-7112 (5 µM) and o-Vanillin (100 µM) treated NP cells when compared with control (CTRL). See methods for statistical calculation and genes ranking. Quantification of the average NP (B) area (C) and position in human IVD. Red lines indicate the average ratio (n = 11 discs). (D) Schematic representation of the average NP area and position.
Figure 3.
Figure 3.. Profile of SASP factors released from pellet cultures following senolytic treatment.
(A) Culture media was analyzed by a RayBio Human Cytokine Array. Relative mean densitometry units of the 80 factors were normalized to untreated controls with the most 25 downregulated SASP factors presented: cytokines (A–a), CC-chemokines (A–b), CXC-chemokines (A–c), growth and neurotrophic factors (A–d). Scatter plot showing the distribution in average change of 50 cytokines quantified using cytokine array (A–e). (B) Heatmap displaying quantification of 19 selected cytokines (19-plex Luminex array). Each column represents one individual (n = 5). The rows represent expression of a single protein. Data shown are log2 (fold change) relative to the average expression level in each condition. Donors ID and gender are indicated for each subject. (C) Significantly downregulated factors are presented as mean fold difference ± SEM; (n = 5). Culture media was collected from the same NP cells used in Figure 2. *Indicates significant difference assessed by repeated measures Analysis of Variance (ANOVA) with Turkey’s post hoc test for multiple pairwise comparison: p<0.05 and **indicates p<0.01.
Figure 3—figure supplement 1.
Figure 3—figure supplement 1.. Total cytokine array and Luminex measures in pellet culture media.
(A) Schematic representation of the media analysis by cytokine arrays and Luminex assay. Cytokine/chemokine array quantification of the media in NP cell pellets treated with (B) o-Vanillin (100 μM) and (C) RG-7112 (5 μM). Results present the percentage of change in treated compare to untreated pellet cultures. (D) Nine inflammatory factors in pellet media (TNF-α, IL-1α, IL-1β, CCL5, CCL11, CCL26, CXCL11, CX3CL1 and Angiogenin) displaying no statistically significant decrease measured by Luminex assay. Data is presented as mean ± SEM and was analyzed by repeated measures Analysis of Variance (ANOVA) with Turkey’s post hoc test for multiple pairwise comparison (n = 5).
Figure 4.
Figure 4.. RG-7112 and o-Vanillin effects in ex vivo human IVD culture.
(A) Schematic of the ex vivo organ culture experiment. Lumbar spines from organ donors were assessed radiographically for signs of degeneration. Three discs per experiment were isolated from the same spine, cultured for 4–6 days then scanned with MRI and injected with vehicle, o-Vanillin or RG-7112. Discs were then cultured for an additional 28 days, with media changes every 3–4 days. The discs were scanned by MRI again at day 28. Media and tissues were used for SASP factor release and histology respectively. (B) Representative images of mid-axial T1ρ slices pre-treatment (a–b, e–f, i–j) and the same location post treatment (c–d, g–h, k–l) with vehicle (CTRL), RG-7112 (5 μM) or o-Vanillin (100 μM). The heatmap correlates the red color with the highest and the blue color with the lowest T1ρ values. (C) Quantification for NP regions with the graph showing percentage change in T1ρ values post- compared to the pre-treatment scans. (D) Representative safranin O/fast green staining of histological sections. (E) Representative images of disc sections stained with antibodies against p16INK4a and Ki-67. Quantification of (F) p16INK4a and (G) Ki-67 expression. Scale bars = 150 µm in 4D, 25 µm in 4E (p16INK4a) and 50 µm in 4E (ki-67); Error bars represent mean ± SEM, Statistical significance was assessed by two-tailed Student's t-test to compare pre and post disc groups (C) and by repeated measures Analysis of Variance (ANOVA) with Turkey’s post hoc test for multiple pairwise comparison in (F and G). *Indicates p<0.05 and **indicates p<0.01, n = 4 for each condition. The tissues were from degenerating IVDs as indicated in Tables 2 and 3.
Figure 5.
Figure 5.. Profile of SASP factors released from ex vivo human IVDs cultures following senolytic treatment.
Culture media was analyzed by a RayBio Human Cytokine Array. Relative mean densitometry units of the 80 factors were normalized to pre-treatment media of the same IVD. The percentage change (post/pre) of the 15 most affected factors are shown for RG-7112 and o-Vanillin (A) and vehicle (B) treated discs. (C) Heatmap displaying quantification of 19 selected cytokines (19-plex Luminex array). Each column represents one individual and each row represent expression of a single protein. Data shown are log2 (fold change) in pre- or post-treated disc media relative to their respective expression level average. (D) Nine analytes (INF-γ, TNF-α, CCL11, CCL24, CXCL1, CXCL9, CXCL10, Angiogenin and VEGF) displayed statistically significant differences when measured in post compared to pretreated disc media. Error bars represent mean ± SEM. Statistical significance when comparing pre and post discs groups was assessed by two-tailed Student's t-test (A, B and D): * Indicates p<0.05 and **indicates p<0.01. Data was analyzed by repeated measures Analysis of Variance (ANOVA) with Turkey’s post hoc test for multiple pairwise comparison (D) where # Indicates significant difference (p<0.05) between treated and untreated groups, (n = 4). The analyzed media were collected from same donors used in Figure 4.
Figure 5—figure supplement 1.
Figure 5—figure supplement 1.. Complete profiling and measure of growth factors and cytokines in disc cultures media.
Total cytokine/chemokine array quantification of inflammatory factors release in (A) Control, (B) o-Vanillin and (C) RG-7112 discs. Shown in the graphs is the ratio (% change) of the factors detected in the cultures media of post-treated and compared with their respective pre-treated cultures media. (D) Ten analytes in disc media (IL-1α, IL-1β, IL-6, IL-8, CCL5, CCL7, CCL26, CXCL5, CXCL11 and CX3CL1) displayed no statistically significant decrease when compared with their respective controls. Data is presented as mean ± SEM and was analyzed by t-tests for pre and post groups and by repeated measures Analysis of Variance (ANOVA) with Turkey’s post hoc test for multiple pairwise comparison (n = 4).
Author response image 1.

References

    1. Acosta JC, O'Loghlen A, Banito A, Guijarro MV, Augert A, Raguz S, Fumagalli M, Da Costa M, Brown C, Popov N, Takatsu Y, Melamed J, d'Adda di Fagagna F, Bernard D, Hernando E, Gil J. Chemokine signaling via the CXCR2 receptor reinforces senescence. Cell. 2008;133:1006–1018. doi: 10.1016/j.cell.2008.03.038. - DOI - PubMed
    1. Acosta JC, Banito A, Wuestefeld T, Georgilis A, Janich P, Morton JP, Athineos D, Kang TW, Lasitschka F, Andrulis M, Pascual G, Morris KJ, Khan S, Jin H, Dharmalingam G, Snijders AP, Carroll T, Capper D, Pritchard C, Inman GJ, Longerich T, Sansom OJ, Benitah SA, Zender L, Gil J. A complex secretory program orchestrated by the inflammasome controls paracrine senescence. Nature Cell Biology. 2013;15:978–990. doi: 10.1038/ncb2784. - DOI - PMC - PubMed
    1. Acosta JC, Gil J. A role for CXCR2 in senescence, but what about in Cancer? Cancer Research. 2009;69:2167–2170. doi: 10.1158/0008-5472.CAN-08-3772. - DOI - PubMed
    1. Adams MA, Lama P, Zehra U, Dolan P. Why do some intervertebral discs degenerate, when others (in the same spine) do not? Clinical Anatomy. 2015;28:195–204. doi: 10.1002/ca.22404. - DOI - PubMed
    1. Adams MA, Hutton WC. The effect of fatigue on the lumbar intervertebral disc. The Journal of Bone and Joint Surgery. British Volume. 1983;65:199–203. doi: 10.1302/0301-620X.65B2.6826631. - DOI - PubMed

Publication types