. 2020 Mar 24;9(2):17.
doi: 10.1167/tvst.9.2.17. eCollection 2020 Mar.

A Deep-Learning Approach for Automated OCT En-Face Retinal Vessel Segmentation in Cases of Optic Disc Swelling Using Multiple En-Face Images as Input

Affiliations

A Deep-Learning Approach for Automated OCT En-Face Retinal Vessel Segmentation in Cases of Optic Disc Swelling Using Multiple En-Face Images as Input

Mohammad Shafkat Islam et al. Transl Vis Sci Technol. .

Abstract

Purpose: In cases of optic disc swelling, segmentation of projected retinal blood vessels from optical coherence tomography (OCT) volumes is challenging due to swelling-based shadowing artifacts. Based on our hypothesis that simultaneously considering vessel information from multiple projected retinal layers can substantially increase vessel visibility, in this work, we propose a deep-learning-based approach to segment vessels involving the simultaneous use of three OCT en-face images as input.

Methods: A human expert vessel tracing combining information from OCT en-face images of the retinal pigment epithelium (RPE), inner retina, and total retina as well as a registered fundus image served as the reference standard. The deep neural network was trained from the imaging data from 18 patients with optic disc swelling to output a vessel probability map from three OCT en-face input images. The vessels from the OCT en-face images were also manually traced in three separate stages to compare with the performance of the proposed approach.

Results: On an independent volume-matched test set of 18 patients, the proposed deep-learning-based approach outperformed the three OCT-based manual tracing stages. The manual tracing based on three OCT en-face images also outperformed the manual tracing using only the traditional RPE en-face image.

Conclusions: In cases of optic disc swelling, use of multiple en-face images enables better vessel segmentation when compared with the traditional use of a single en-face image.

Translational relevance: Improved vessel segmentation approaches in cases of optic disc swelling can be used as features for an improved assessment of the severity and cause of the swelling.

Keywords: U-Net; deep learning; multiple en-face images; optic disc swelling; optical coherence tomography; papilledema; retinal blood vessels; vessel segmentation.


Conflict of interest statement

Disclosure: M.S. Islam, None; J.-K. Wang, None; S.S. Johnson, None; M.J. Thurtell, None; R.H. Kardon, Fight for Sight, Inc. (S), Department of Veterans Affairs Research Foundation, Iowa City, IA (S); M.K. Garvin, University of Iowa (P)

Figures

Figure 1.
Figure 1.
Comparisons of the fundus photograph and OCT pairs with mild optic disc swelling (top row: a1, b1, c1), moderate swelling (middle row: a2, b2, c2), and severe swelling (bottom row: a3, b3, c3). Left column (a1, a2, a3) shows fundus photographs. Middle column (b1, b2, b3) shows the OCT central B-scans with automated layer segmentation. Right column (c1, c2, c3) shows the OCT RPE en-face images. Note: In case of swelling, the yellow arrows indicate vessel attributes changes in (a), the cyan lines in (c) represent the location of the central B-scans, and the green arrows in (b) and (c) indicate the matched shadow regions.
Figure 2.
Figure 2.
Architecture of the proposed deep-learning approach. Three image patches (32 × 32 pixels) are separately extracted from the OCT en-face images of the RPE complex, the inner retina, and the total retina. Next, these three patches are concatenated to each other at the first layer in the network. The numbers in black and in gray at each block represent the number of channels and dimensions at the current network layer, and the colors of the arrows represent different network operations.
Figure 3.
Figure 3.
Data distribution (by ONH volume) of the training and testing data sets (shown in pink and green bars, respectively). There are 36 patients in total: 18 in the training data set and the other 18 in the testing data set. The severity of the disc swelling has been matched between both data sets based on the ONH volumes.
Figure 4.
Figure 4.
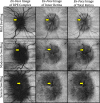
Demonstrations of vessel visibility of en-face images from different retinal layers in mild (top row), moderate (middle row), and severe (bottom row) optic disc swelling (continued from Fig. 1): left column, the RPE en-face image; middle column, the inner retina en-face image; and right column, the total retina en-face image. The yellow arrows indicate the vessel visibility changes.
Figure 5.
Figure 5.
Data dot plots for the measurements of area under ROC curve (AUC), average precision (AP), mean square error (MSE), mean coefficient of determination (R2), and mean accuracy (ACC) with 95% confidence intervals: green, manual tracing (MT) stage I; dark yellow, MT stage II; purple, MT stage III; blue, the probability map from the proposed deep learning (DL) approach; and red, the binary map, which is obtained using Ostu algorithm) from the DL approach.
Figure 6.
Figure 6.
Scatterplots of 18 testing participants for displaying the relationships between the AUC and ONH volume from the manual tracing (MT) stage III (the best performance in all three manual tracing stages; shown as magenta crosses) and proposed deep-learning (DL) approach probability map (shown as cyan triangles).
Figure A1.
Figure A1.
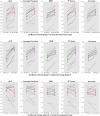
Trajectory connection dot plots for the measurements of area under ROC curve (AUC), average precision (AP), mean square error (MSE), mean coefficient of determination (R2), and mean accuracy (ACC) with 95% confidence intervals: Dark yellow and green, manual tracing (MT) stage I (in Fig. A1(a) and (b) respectively); purple, MT stage III; and red, the binary map (which is obtained using Ostu algorithm) from the DL approach. (a) Trajectory connection between the MT stage I and DL binary map results. (b) Trajectory connection between the MT stage I and III results. (c) Trajectory connection between the MT stage III and DL binary map results.

References

    1. Van Stavern GP. Optic disc edema. Semin Neurol. 2007; 27: 233–243. - PubMed
    1. Frisén L. Swelling of the optic nerve head: a staging scheme. J Neurol Neurosurg Psychiatry. 1982; 45: 13–18. - PMC - PubMed
    1. Hayreh SS. Optic disc edema in raised intracranial pressure, V: pathogenesis. Arch Ophthalmol. 1977; 95: 1553–1565. - PubMed
    1. Trobe JD. Papilledema: the vexing issues. J Neuroophthalmol. 2011; 31: 175–186. - PubMed
    1. Scott CJ, Kardon RH, Lee AG, et al. .. Diagnosis and grading of papilledema in patients with raised intracranial pressure using optical coherence tomography vs clinical expert assessment using a clinical staging scale. Arch Ophthalmol. 2010; 128: 705–711. - PubMed

Publication types